Effects of precipitation and temperature on precipitation use efficiency of alpine grassland in Northern Tibet, China - Nature
←
→
Page content transcription
If your browser does not render page correctly, please read the page content below
www.nature.com/scientificreports
OPEN Effects of precipitation
and temperature on precipitation
use efficiency of alpine grassland
in Northern Tibet, China
Xiaoke Zhang1, Xindong Du1 & Zhangming Zhu2*
Precipitation use efficiency (PUE) is crucial in understanding the coupling between ecosystem carbon
and water cycling. In this study, we used a time series (2000–2013) dataset of net primary productivity
(NPP) based on the Carnegie–Ames–Stanford Approach (CASA) model together with precipitation
to reveal the spatial and temporal patterns of alpine grassland PUE in Northern Tibet. The mean
annual PUE values of alpine meadow, alpine meadow steppe, alpine steppe, alpine desert steppe,
and alpine desert were 0.48, 0.39, 0.36, 0.29 and 0.23 gc m−2 mm−1, respectively. The spatial patterns
of PUE of alpine grassland demonstrated an initial increase in the arid region and a subsequent
decrease in the humid region along the precipitation gradient and peaked at approximately 500 mm.
To evaluate the temporal patterns, the sensitivity Slope and the Pearson correlation coefficient Rxy
between the PUE and climatic factors were calculated. The inter-annual variability of PUE exhibited
a significant negative correlation with annual precipitation (P < 0.05), which implies that NPP had a
lower sensitivity to precipitation in most regions. The relationship between PUE and the mean annual
temperature is different for different regions. Our findings have an important role in understanding
the impacts of precipitation availability on climate change and in the scientific management of the
alpine grassland ecosystems.
Net primary productivity (NPP) is an important variable of terrestrial ecosystems, as it is an important indicator
of the global carbon c ycle1,2. Precipitation use efficiency (PUE), which is the ratio of NPP to precipitation, has
been considered as an integral method for assessing the response of NPP to spatial and temporal variations of
annual precipitation3,4. PUE is a considerable constraint for simulating ecosystem productivity in m odels5 and
6,7
can be used as an indicator of regional degradation . It is also essential in understanding the coupling between
ecosystem carbon and water c ycling8.
Recently, the PUE trends of grassland along the precipitation gradient have demonstrated various perceptions.
In general, PUE decreased spatially with potential evapotranspiration and increasing a ridity4,9. However, some
studies found that PUE exhibited a unimodal pattern with an increasing trend in dry regions and a decreasing
trend in mesic regions10–12. Huxman et al.13 found that PUE decreased with increasing precipitation and that
there is a convergence to a common maximum PUE during the driest years at each of the sites they selected
in America. In contrast, Hu et al.14 found that the maximum PUE exhibited large site-to-site variation along a
4500-km grassland transect. Thus, it is critical to reveal the patterns of PUE across the precipitation gradient in
alpine grasslands in Northern Tibet.
Previous studies have suggested that PUE may be influenced by factors, such as edaphic conditions (soil tex-
ture and soil carbon content), vegetation conditions (vegetation cover and species richness), and biogeochemical
constraints (soil nitrogen (N))9,11,13,14. Climatic factors also have a significant effect on PUE through influenc-
ing the ecosystem carbon c ycle3. The PUE of grassland ecosystems has been reported to exhibit d ecreasing9,
15 16
unchanging and increasing trends with increasing precipitation. In a mixed-grass prairie in USA, double
precipitation suppressed the PUE and half precipitation increased the PUE under different treatments17. PUE
either decreases18, exhibits no c hanges17, or i ncreases1 under warming. For drought, Zhang et al.3 found that a
wet year preceded by a dry year resulted in the lowest PUE and a dry year preceded by a wet year resulted in the
1
School of Public Administration, Hohai University, Nanjing 210098, Jiangsu, China. 2School of Ecology and
Environmental Science and Yunnan Key Laboratory for Plateau Mountain Ecology and Restoration of Degraded
Environments, Yunnan University, Kunming 650091, China. *email: zhangmingzhu@ynu.edu.cn
Scientific Reports | (2020) 10:20309 | https://doi.org/10.1038/s41598-020-77208-6 1
Vol.:(0123456789)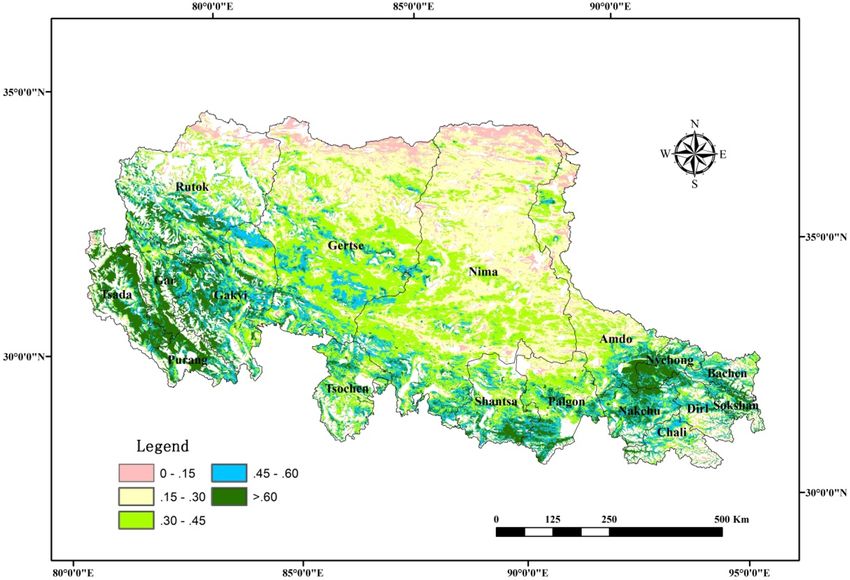
www.nature.com/scientificreports/
Figure 1. Spatial distribution of the mean annual PUE in Northern Tibet during 2000–2013. The map was
created using ArcMap 10.6, URL: https://www.esri.com/en-us/arcgis/products/arcgis-pro/overview.
Alpine grassland type Area/km2 MAP/(mm a−1) NPP/(gc m−2 a−1) PUE/(gc sm−2 mm−1)
Alpine meadow 99,056 501.26 238.94 0.48
Alpine meadow steppe 52,618 365.99 143.89 0.39
Alpine steppe 256,331 246.61 88.06 0.36
Alpine desert steppe 99,056 181.77 53.18 0.29
Alpine desert 50,451 189.27 43.29 0.23
Table 1. MAP, NPP, and PUE of different alpine grassland types in Northern Tibet during 2000–2013. MAP,
multi-year mean annual precipitation.
highest PUE across China. From the point of view of ecosystem resilience, Campos et al.19 found higher PUE in
drier years, which increased significantly with drought. Therefore, it is essential to have a deep understanding of
how PUE responds to climate change to accurately forecast the ecosystem carbon cycle.
Many of the previous studies are based on the spatial patterns of PUE in the plot s cale9,11,15,17. Little research
has been conducted to study the PUE dynamics of the alpine grassland ecosystem in a regional scale and its
driving forces. In this study, we investigated the spatial–temporal pattern and variation of PUE of alpine grass-
lands in Northern Tibet, over the time period from 2000 to 2013. Our goals were to: (1) determine the changes
in the PUE pattern along the precipitation gradient and (2) explore the temporal relationship between PUE and
climatic factors.
Results
Spatial patterns of PUE in Northern Tibet. During 2000 and 2013, the spatial distribution of the mean
annual PUE of the alpine grassland in Northern Tibet gradually decreased from south to north, which changed
from more than 0.6 gc m−2 mm−1 in the south and descended to less than 0.15 gc m−2 mm−1 in the north (Fig. 1).
For different alpine grassland classes, the mean annual PUE values were in the order of alpine meadow > alpine
meadow steppe > alpine steppe > alpine desert steppe > alpine desert. The PUE values were 0.48, 0.39, 0.36, 0.29
and 0.23 gc m−2 mm−1, respectively (Table 1).
PUE variation along the precipitation gradient. Figure 2 illustrates that NPP in the alpine grass-
land was positively correlated with the multi-year mean annual precipitation (MAP). While MAP is more than
400 mm a−1 in the alpine meadow, change in the NPP trend is not obvious along the precipitation gradient.
The PUE of the alpine grassland exhibited an initial increase and a subsequent decrease along the precipitation
gradient. The PUE increased with MAP in the drier portions of the precipitation gradient. In contrast, the PUE
Scientific Reports | (2020) 10:20309 | https://doi.org/10.1038/s41598-020-77208-6 2
Vol:.(1234567890)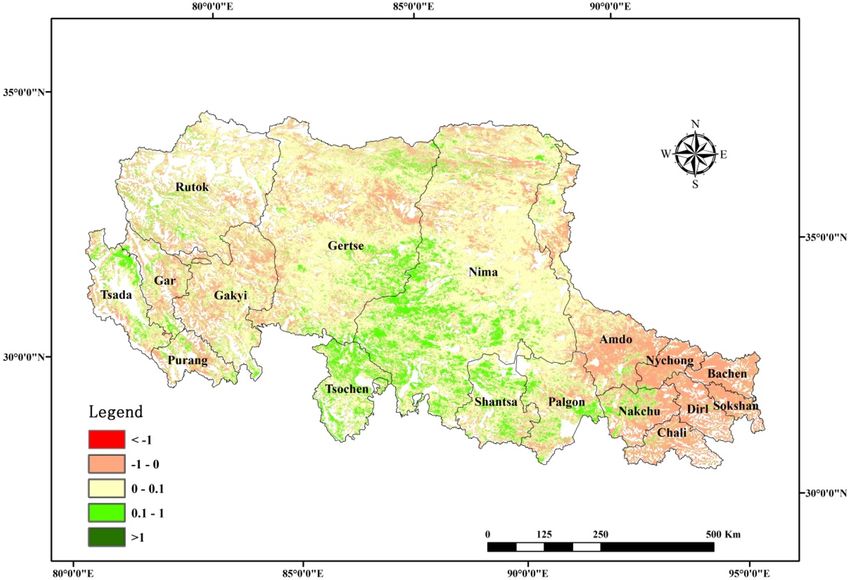
www.nature.com/scientificreports/
Figure 2. NPP and PUE patterns along the precipitation gradient.
decreased with MAP in the wetter portions of the precipitation gradient. Thus, PUE of the alpine grasslands
peaked at approximately 500 mm of MAP.
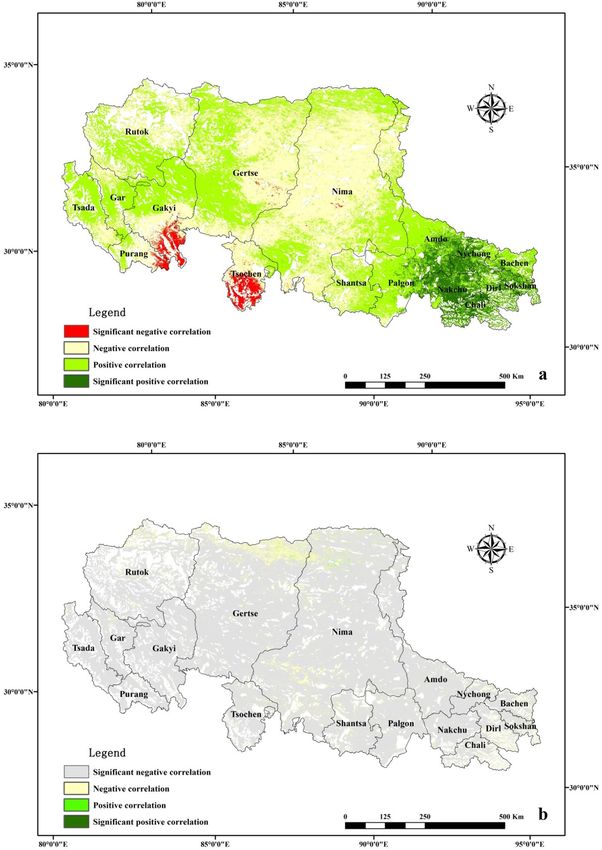
Relationship between PUE and Climatic Factors. The correlation coefficients between PUE and cli-
matic variables differed for different alpine grasslands (Fig. 3). The inter-annual variability of PUE exhibited a
significant negative correlation with annual precipitation (P < 0.05).
Nevertheless, the relationship between PUE and the mean annual temperature is different for different regions.
In the southeast-distributed alpine meadow, PUE exhibits a significant positive correlation with the mean annual
temperature (P < 0.05). In the south of Gakyi and Tsochen counties, PUE exhibits a significant negative correla-
tion with the mean annual temperature (P < 0.05). In the middle of the study region, PUE exhibits a negative
correlation with the mean annual temperature and a positive correlation with the mean annual temperature in
other regions.
Discussion
PUE pattern in Northern Tibet. For different alpine grassland classes, the mean annual PUE values
exhibited greater differences. Alpine meadow exhibited a maximum PUE value of 0.48 gc m−2 mm−1, whereas
the alpine desert exhibited a minimum PUE value of 0.23 gc m−2 mm−1. The spatial pattern of the mean annual
PUE for different alpine grassland types was congruent with those of previous studies8,11,20. The drier the climate,
the higher the water consumption coefficient and the lower the PUE. The reason for this may be largely due to
9,11,14.
their differences in vegetation cover, species richness, soil texture, soil carbon content and soil N
Our results also supported the view that PUE exhibited a unimodal pattern across the precipitation gradient,
with an increasing trend in the dry regions and a decreasing trend in the humid regions, which was similar to
that in global g rasslands10,11. Some studies were inconsistent with the findings of this study. Lauenroth et al.15
observed that the PUE of native grasslands exhibited no significant change across the precipitation gradient in
the United States. Hu et al.14 and Bai et al.9 found that PUE increased across the precipitation gradient. Therefore,
the PUE patterns at different scales were not the same.
For the PUE peak value, Paruelo et al.10 found that PUE peaked at approximately 475 mm. Hu et al.14 consid-
ered that the maximum value point may be in a MAP range of 400–600 mm, which is quite close to this study. In
the humid region, the lower PUE may have been caused by higher runoff, or higher evapotranspiration r ate14,21. In
the arid region, the lower PUE could be caused by lower NPP, higher evaporation, or higher water limitation9,19.
Therefore, effective precipitation is the main factor that can control the PUE patterns.
Impact of climatic factors on PUE. Figure 3 depicts the relationship between the PUE and tempera-
ture in this study. The influence of temperature on PUE is extremely complicated and distinct for the different
regions. While the temperature changes, the change in PUE may be through stomatal control mechanisms9.
Scientific Reports | (2020) 10:20309 | https://doi.org/10.1038/s41598-020-77208-6 3
Vol.:(0123456789)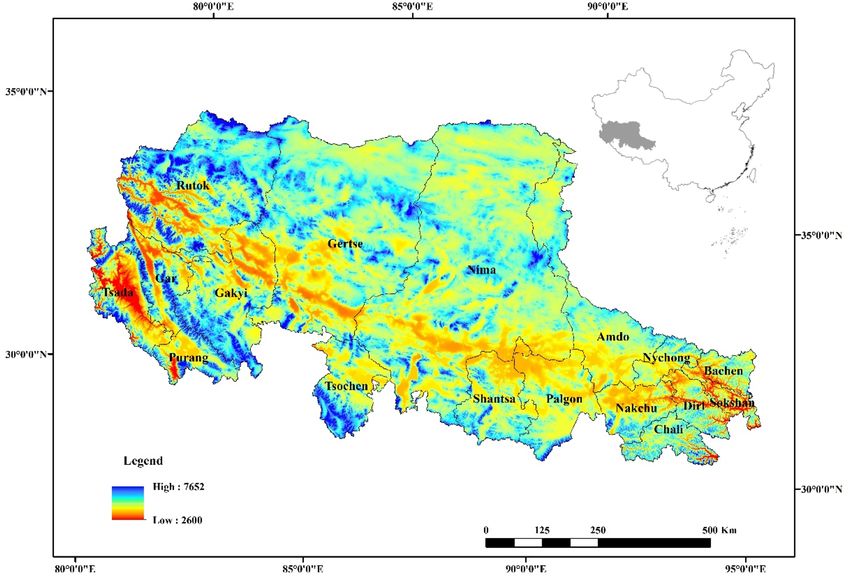
www.nature.com/scientificreports/
Figure 3. Correlation between PUE and (a) temperature, (b) annual precipitation during 2000–2013. The map
was created using ArcMap 10.6, URL: https://www.esri.com/en-us/arcgis/products/arcgis-pro/overview.
The optimum temperature of plant photosynthesis demonstrates a large variability for different environmental
conditions. When the environment temperature change is below the optimum temperature of photosynthesis,
the influence of temperature on PUE is positive, or vice v ersa22,37. In the future, warming in humid regions may
continue to have positive effects on PUE; warming in arid regions induced by drought may strengthen its nega-
tive effects on PUE of alpine grasslands.
In this study, the temporal correlation between PUE and annual precipitation was negative, which was con-
sistent with the findings of Chen et al.9. Figure 4 depicts that NPP exhibits a lower sensitivity to precipitation;
the slope value between NPP and precipitation is between − 1 and 1 in most regions. NPP increases with pre-
cipitation, as the slope value is greater than 0 but less than 1 in the central regions. This illustrates that when
the precipitation increases by 1 mm, NPP increases by less than 1 gc m−2 a−1. The inter-annual variation of
Scientific Reports | (2020) 10:20309 | https://doi.org/10.1038/s41598-020-77208-6 4
Vol:.(1234567890)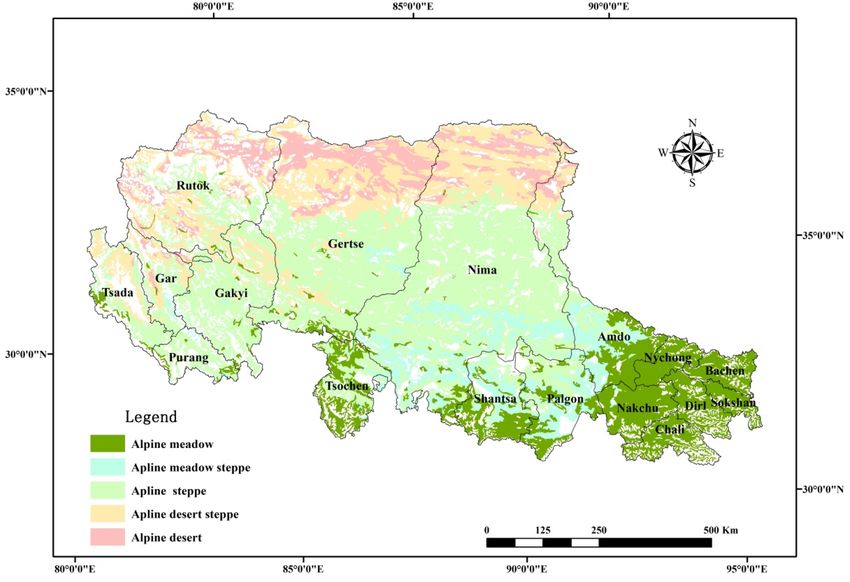
www.nature.com/scientificreports/
Figure 4. Sensitivity Slope between NPP and precipitation. The map was created using ArcMap 10.6, URL: https
://www.esri.com/en-us/arcgis/products/arcgis-pro/overview.
precipitation is larger than that of the NPP variation, i.e., the annual precipitation increases, NPP increases;
as the NPP increase in amplitude is smaller, the PUE (NPP/MAP) decreases. NPP decreases with increasing
annual precipitation in the meadow and in some other sporadic regions. As the annual precipitation increases,
NPP decreases and PUE (NPP/MAP) also decreases. Therefore, the inter-annual variability of PUE exhibited a
significant negative correlation with the annual precipitation. For further studies, we need to clarify the internal
mechanisms influencing the PUE variations at different scales.
Methods
Study area. As the sole and largest geographical part at the highest elevation on earth, the Qinghai–Tibet
plateau is called the “Third Pole”. It acts as an important reservoir for water and regulates the water resources and
climatic conditions of East Asia and as well as those of the whole world23,24. The study area, Northern Tibet, is
an important part of the Qinghai-Tibet plateau and includes the Ngari and Nakchu prefectures with an average
altitude of more than 4000 m (Fig. 5). The climate of the entire area is extremely cold and dry, and hydrothermal
conditions are very harsh. The mean annual temperature ranges from approximately − 1.8 °C to 4.2 °C. The
annual precipitation varies between 67.5 and 752.3 mm and is less than 100 mm in Gar county. The annual pre-
cipitation in this region declines from south to north and from east to west, and is mostly concentrated from May
to September, a period that accounts for 90% of the annual precipitation. High altitude western winds are strong
in spring and winter, and gales above force 7 are frequent and occur for over 100 days annually, which leads to
dry weather and low soil temperature25,26. Alpine grassland, mainly comprised of alpine meadows and steppes,
is the main vegetation type across much of the region, covering 94.4% of the total area in Northern Tibet, which
is sensitive to the variable environment of Northern Tibet27.
Data. In this study, we used the MODIS NDVI time series of satellite images at 250 km spatial and 16-day
temporal resolution, covering a period from 2000 to 2013. The product MOD13Q1 was obtained from the web-
site https://ladsweb.nascom.nasa.gov/data/search.html. We acquired five MODIS tiles (h24v05, h25v05, h25v06,
h26v05 and h26v06) for our study region. The MODIS tiles were mosaicked and re-projected from the Sinusoi-
dal projection to the Albers projection. Monthly NDVI images were generated by the maximum NDVI value
composite (MVC) method using the two 16-day composites for each m onth28,29.
The mean annual temperature and annual precipitation were generated by datasets (SURF_CLI_CHN_PRE_
MON_GRID_0.5 and SURF_CLI_CHN_TEM_MON_GRID_0.5), which were derived from the China Mete-
orological Data Sharing Service System (https://data.cma.cn). To match a spatial resolution of 250 m × 250 m,
datasets were produced by ordinary kriging spatial i nterpolation29. Grassland classification data were obtained
from the grassland resources of Tibet autonomous region. Alpine grasslands were identified from the southeast to
northwest: alpine meadow, alpine meadow steppe, alpine steppe, alpine desert steppe, and alpine desert (Fig. 6)29.
Scientific Reports | (2020) 10:20309 | https://doi.org/10.1038/s41598-020-77208-6 5
Vol.:(0123456789)www.nature.com/scientificreports/
Figure 5. Location and topography in Northern Tibet, China. The map was created using ArcMap 10.6, URL:
https://www.esri.com/en-us/arcgis/products/arcgis-pro/overview.
Figure 6. Spatial distributions of alpine grassland classes in Northern Tibet. The map was created using
ArcMap 10.6, URL: https://www.esri.com/en-us/arcgis/products/arcgis-pro/overview.
Methods. The Carnegie–Ames–Stanford Approach (CASA) model was developed to calculate NPP on a
large scale, based on NDVI, climate, and classification data. It was determined by two parts: absorbed photosyn-
thetically active radiation ( APAR) and light use efficiency (ε). The formula is as follows:
Scientific Reports | (2020) 10:20309 | https://doi.org/10.1038/s41598-020-77208-6 6
Vol:.(1234567890)www.nature.com/scientificreports/
NPP(x, t) = APAR(x, t)∗ε(x, t) = IPAR(x, t)∗FPAR(x, t)∗εmax ∗Tε1 (x, t)∗Tε2 (x, t)∗Wε (x, t)
IPAR(x, t) = SOL(x, t) ∗ 0.5
(NDVI(x, t) − NDVI i,min ) × (FPARmax − FPARmin )
FPAR(x, t) = + FPARmin
(NDVI i,max − NDVI i,min )
(SR(x, t) − SRi,min ) × (FPARmax − FPARmin )
FPAR(x, t) = + FPARmin
(SRi,max − SRi,min )
1 + NDVI(x, t)
SR(x, t) =
1 − NDVI(x, t)
FPAR(x, t) = αFPARNDVI + (1 − α)FPARSR
Tε1 = 0.8 + 0.02 × Topt (x) − 0.0005 × [Topt (x)]2
1.184 1
Tε2 (x, t) =
×
1 + exp 0.2 × Topt (x) − 10 − T(x, t) {1 + exp[0.3 × (−Topt (x) − 10 + T(x, t))]}
Wε (x, t) = 0.5 + 0.5 × E(x, t)/Ep (x, t)
E(x, t) = P(x, t) × Rn (x, t) × (P(x, t))2 + (Rn (x, t))2 + P(x, t) + Rn (x, t)
/{[P(x, t) + Rn (x, t)] × [(P(x, t))2 + (Rn (x, t))2 ]}
Ep0 (x, t) 0.5
Rn (x, t) = [Ep0 (x, t) × P(x, t)]0.5 × {0.369 + 0.598 × [ ] }
P(x, t)
Ep (x, t) = E(x, t) + Ep0 (x, t) /2
Here, IPAR is the interrupted photosynthetically active radiation; SOL(x, t) is the total solar radiation based
on sunshine duration; FPAR is fraction of the photosynthetically active radiation absorbed by the canopy, which
is calculated from the MODIS NDVI; εmax is the maximum light use efficiency as 0.608 gC M J−126; Tε andWε
are the unitless stress values for temperature and water; Topt (x) is the air temperature (°C) in the month when
NDVI reaches its maximum for the year; E(x, t) is the estimated evapotranspiration (mm); Ep (x, t) is the potential
evapotranspiration (mm); P(x, t) is the precipitation (mm); Rn (x, t) is the net solar radiation (MJ) and Ep0 (x, t)
is the local potential evapotranspiration (mm); r espectively24,30–32.
To analyse the temporal variation of the alpine grassland PUE in Northern Tibet, the sensitivity Slope21 and
the Pearson correlation coefficient Rxy33,34 between the PUE and climatic factors were calculated.
n
(xi − x)(y − y)
Slope = i=1 n 2
i=1 (x − x)
n
i=1 (xi− x)(y − y)
Rxy =
n 2 n 2
i=1 (xi − x) i=1 (y − y)
Here, x and y are respectively the multi-year mean of the climatic factors and the PUE; xi and yi are respec-
tively the climatic factors and PUE of the year i . If Rxy passes through the significance test (P < 0.05), it exhibits
a significant positive or negative correlation.
Validation of NPP. To validate the NPP simulated by the CASA model, biomass was measured in the
eld39. The alpine grassland NPP for both aboveground (ANPP) and belowground (BNPP) was calculated using
fi
the same method as that proposed by Chen et al.35 A significant linear relationship was observed between the
observed and simulated NPP (P < 0.01) (Fig. 7). We compared our results with the results from other studies
(Table 2), and found that the NPP calculated by the CASA model was reliable.
Data availability
The datasets generated and/or analyzed during the current study are available from the corresponding author
on reasonable request.
Scientific Reports | (2020) 10:20309 | https://doi.org/10.1038/s41598-020-77208-6 7
Vol.:(0123456789)www.nature.com/scientificreports/
Figure 7. Comparison of observational data with simulation results.
This study Chen et al.35 Piao et al.36 Gao et al.37 Zhou et al.38
Grassland type CASA GLO-PEM CASA CASA TEM
Alpine meadow 239 301 176 63.5 214.6
Alpine steppe 86 70 80 30.6 64
Alpine desert 43 18 24 15.6
Table 2. Mean annual NPP simulated for alpine grasslands by different researchers (gc m−2 a−1).
Received: 20 November 2019; Accepted: 2 November 2020
References
1. Xu, X. et al. Interannual variability in responses of belowground net primary productivity (NPP) and NPP partitioning to long-
term warming and clipping in a tallgrass prairie. Global Change Biol. 18(5), 1648–1656 (2012).
2. Hui, D. & Jackson, R. B. Geographical and interannual variability in biomass partitioning in grassland ecosystems: a synthesis of
field data. New Phytol. 169(1), 85–93 (2006).
3. Zhang, X. et al. Impact of prolonged drought on rainfall use efficiency using MODIS data across China in the early 21st century.
Remote Sens. Environ. 150, 188–197 (2014).
4. Jiang, Y. et al. Effects of community structure on precipitation-use efficiency of grasslands in Northern Tibet. J. Veg Sci. 28, 281–290
(2017).
5. Roupsard, O. et al. Scaling-up productivity (NPP) using light or water use efficiencies (LUE, WUE) from a two-layer tropical
plantation. Agrofor. Syst. 76(2), 409–422 (2009).
6. Prince, S. D., De Colstoun, E. B. & Kravitz, L. L. Evidence from rain-use efficiencies does not indicate extensive Sahelian deserti-
fication. Global Change Biol. 4(4), 359–374 (1998).
7. Fensholt, R. & Rasmussen, K. Analysis of trends in the Sahelian “rain-use efficiency” using GIMMS NDVI, RFE and GPCP rainfall
data. Remote Sens. Environ. 115(2), 438–451 (2011).
8. Ye, H., Wang, J., Huang, M. & Qi, S. Spatial pattern of vegetation precipitation use efficiency and its response to precipitation and
temperature on the Qinghai-Xizang Plateau of China. Chin. J. Plant. Ecol. 36(12), 1237–1247 (2012).
9. Bai, Y. et al. Primary production and rain use efficiency across a precipitation gradient on the Mongolia plateau. Ecology 89(8),
2140–2153 (2008).
10. Paruelo, J. M., Lauenroth, W. K., Burke, I. C. & Sala, O. E. Grassland precipitation-use efficiency varies across a resource gradient.
Ecosystems 2(1), 64–68 (1999).
11. Yang, Y., Fang, J., Fay, P. A., Bell, J. E. & Ji, C. Rain use efficiency across a precipitation gradient on the Tibetan Plateau. Geophys.
Res. Lett. 37, L15702 (2010).
12. Li, H. X., Liu, G. H. & Fu, B. J. Spatial variations of rain-use efficiency along a climate gradient on the Tibetan Plateau: a satellite-
based analysis. Int. J. Remote Sens. 34(21), 7487–7503 (2013).
13. Huxman, T. E. et al. Convergence across biomes to a common rain-use efficiency. Nature 429(6992), 651–654 (2004).
14. Hu, Z. et al. Precipitation-use efficiency along a 4500-km grassland transect. Glob. Ecol. Biogeogr. 19(6), 842–851 (2010).
15. Lauenroth, W. K., Burke, I. C. & Paruelo, J. M. Patterns of production and precipitation-use efficiency of winter wheat and native
grasslands in the central Great Plains of the United States. Ecosystems 3(4), 344–351 (2000).
16. Hooper, D. U. & Johnson, L. Nitrogen limitation in dryland ecosystems: Responses to geographical and temporal variation in
precipitation. Biogeochemistry 46(1–3), 247–293 (1999).
17. Xu, X., Sherry, R. A., Niu, S., Li, D. & Luo, Y. Net primary productivity and rain-use efficiency as affected by warming, altered
precipitation, and clipping in a mixed-grass prairie. Global Change Biol. 19(9), 2753–2764 (2013).
18. De Boeck, H. J. et al. How do climate warming and plant species richness affect water use in experimental grasslands?. Plant Soil
288(1–2), 249–261 (2006).
19. Campos, G. E. P. et al. Ecosystem resilience despite large-scale altered hydroclimatic conditions. Nature 494(7437), 349–352 (2013).
Scientific Reports | (2020) 10:20309 | https://doi.org/10.1038/s41598-020-77208-6 8
Vol:.(1234567890)www.nature.com/scientificreports/
20. Qiu, J., Zhang, H. & Shen, W. Spatial characteristics of precipitation use efficiency on the Qinghai-Tibet Plateau From 1982 to
2007. J. Fudan. Univ. Nat. Sci. 53(1), 126–133 (2014).
21. Wang, Q. W., Yu, D. P., Dai, L. M., Zhou, L. & Zhou, W. M. Research progress in water use efficiency of plants under global climate
change. Chin. J. Appl. Ecol. 21(12), 3255–3265 (2000).
22. Chen, S. P., Bai, Y. F., Zhang, L. X. & Han, X. G. Comparing physiological responses of two dominant grass species to nitrogen
addition in Xilin River Basin of China. Environ. Exp. Bot. 53(1), 65–75 (2005).
23. Qiu, J. The third pole. Nature 454(7203), 393–396 (2008).
24. Chen, B. X. et al. The impact of climate change and anthropogenic activities on alpine grassland over the Qinghai-Tibet Plateau.
Agric. For. Meteorol. 189, 11–18 (2014).
25. Jiang, Y. B. et al. Effects of community structure on precipitation-use efficiency of grasslands in northern Tibet. J. Veg. Sci. 28,
281–290 (2017).
26. Gao, Q. Z. et al. Effects of topography and human activity on the net primary productivity (NPP) of alpine grassland in northern
Tibet from 1981 to 2004. Int. J. Remote Sens. 34(6), 2057–2069 (2013).
27. Zhang, J. H., Yao, F. M., Zheng, L. G. & Yang, L. M. Evaluation of grassland dynamics in the Northern-Tibet Plateau of China using
remote sensing and climate data. Sensors 7(12), 3312–3328 (2007).
28. Li, Z., Huffman, T., McConkey, B. & Townley-Smith, L. Monitoring and modeling spatial and temporal patterns of grassland
dynamics using time-series MODIS NDVI with climate and stocking data. Remote Sens. Environ. 138, 232–244 (2013).
29. Zhang, X. K., Lu, X. Y. & Wang, X. D. Spatial-temporal NDVI variation of different alpine grassland classes and groups in Northern
Tibet from 2000 to 2013. Mt. Res. Dev. 35(3), 254–263 (2015).
30. Yu, D. Y., Shi, P. J., Shao, H. B., Zhu, W. Q. & Pan, Y. H. Modelling net primary productivity of terrestrial ecosystems in East Asia
based on an improved CASA ecosystem model. Int. J. Remote Sens. 30(18), 4851–4866 (2009).
31. Gao, Q. Z. et al. Dynamics of alpine grassland NPP and its response to climate change in Northern Tibet. Clim. Change 97(3–4),
515–528 (2009).
32. Zhu, W. Q., Pan, Y. Z., He, H., Yu, D. Y. & Hu, H. B. Simulation of maximum light use efficiency for some typical vegetation types
in China. Chin. Sci. Bull. 51(4), 457–463 (2006).
33. Zhao, G. S. et al. Spatial-temporal variation of ANPP and rain-use efficiency along a precipitation gradient on Changtang Plateau,
Tibet. Remote Sens. 11, 325 (2019).
34. Sun, J. & Du, W. Effects of precipitation and temperature on net primary productivity and precipitation use efficiency across China’s
grasslands. GISci. Remote Sens. 54(6), 881–897 (2017).
35. Chen, Z. Q., Shao, Q. Q., Liu, J. Y. & Wang, J. B. Analysis of net primary productivity of terrestrial vegetation on the Qinghai-Tibet
Plateau, based on MODIS remote sensing data. Sci. China Earth Sci. 55(8), 1306–1312 (2012).
36. Piao, S. & Fang, J. Terrestrial net primary production and its spatio-temporal patterns in Qinghai-Xizang Plateau, China during
1982–1999. J. Nat. Resour. 03, 373–380 (2002).
37. Gao, Q. Z., Wan, Y. F., Li, Y. E., Lin, E. D. & Yang, K. Grassland net primary production and its spatiotemporal distribution in
Northern Tibet: a study with CASA model. Chin. J. Appl. Ecol. 11, 2526–2532 (2007).
38. Zhou, C. P., Ouyang, H., Wang, Q. X., Watanabe, M. & Sun, Q. Q. Estimation net primary productivity in Tibetan Plateau. Acta
Geogr. Sin. 01, 74–79 (2004).
39. Yang, Y. H. et al. Storage, patterns and controls of soil organic carbon in the Tibetan grasslands. Global Change Biol. 14, 1592–1599
(2008).
Acknowledgments
This research was co-funded by the National Natural Sciences Foundation of China, Grant Number 41601435,
the National Key Research and Development Program, Grant Number 2016YFC0502002, and the Fundamental
Research Funds for the Central Universities, Grant Numbers 2019B20214 and 2018B21414. We would like to
thank the China Meteorological Data Sharing Service System for providing meteorological data (https://data.
cma.cn/).
Author contributions
X.Z. and X.D. designed this study. X.Z. conducted field surveys, analyzed the data and prepared figures. Z.Z.
helped for interpreting the results and editing the language. All of the authors contributed to the interpretation
of the results and the writing of the manuscript.
Competing interests
The authors declare no competing interests.
Additional information
Correspondence and requests for materials should be addressed to Z.Z.
Reprints and permissions information is available at www.nature.com/reprints.
Publisher’s note Springer Nature remains neutral with regard to jurisdictional claims in published maps and
institutional affiliations.
Open Access This article is licensed under a Creative Commons Attribution 4.0 International
License, which permits use, sharing, adaptation, distribution and reproduction in any medium or
format, as long as you give appropriate credit to the original author(s) and the source, provide a link to the
Creative Commons licence, and indicate if changes were made. The images or other third party material in this
article are included in the article’s Creative Commons licence, unless indicated otherwise in a credit line to the
material. If material is not included in the article’s Creative Commons licence and your intended use is not
permitted by statutory regulation or exceeds the permitted use, you will need to obtain permission directly from
the copyright holder. To view a copy of this licence, visit http://creativecommons.org/licenses/by/4.0/.
© The Author(s) 2020
Scientific Reports | (2020) 10:20309 | https://doi.org/10.1038/s41598-020-77208-6 9
Vol.:(0123456789)You can also read