Experimental analysis of time delays in wind turbine wake interactions - IOPscience
←
→
Page content transcription
If your browser does not render page correctly, please read the page content below
Journal of Physics: Conference Series

PAPER • OPEN ACCESS

Experimental analysis of time delays in wind turbine wake interactions
To cite this article: S Macrì et al 2020 J. Phys.: Conf. Ser. 1618 062058

View the article online for updates and enhancements.

                                This content was downloaded from IP address 46.4.80.155 on 22/12/2020 at 15:07
The Science of Making Torque from Wind (TORQUE 2020)                                                            IOP Publishing
Journal of Physics: Conference Series       1618 (2020) 062058                            doi:10.1088/1742-6596/1618/6/062058

Experimental analysis of time delays in wind
turbine wake interactions
                      S Macrìa , T Ducd , A Leroya,b , N Girardd , S Aubrunc
                      a
                        Univ. Orléans, INSA-CVL, PRISME EA4229, 45072 Orléans, France
                      b
                        Centre de Recherche de l’École de l’Air, B.A. 701, 13661 Salon-de Provence, France
                      c
                        Ecole Centrale de Nantes, LHEEA, 1 rue de la Noë, 44321 Nantes, France
                      d
                        Engie Green, Le Monolithe, 59 rue Denuzière, 69285 Lyon, France
                      E-mail: stefano.macri@univ-orleans.fr

                      Abstract. Wind farm control is a current hot topic that deals with the capacity to improve
                      the overall wind power production of a farm by controlling individual wind turbines in order
                      to mitigate their wake effects. The dynamic properties of these different strategies need to be
                      taken into account in order to improve wind farm control models. In this work a post-processing
                      of SCADA data acquired with a high sampling frequency on two neighboring wind turbines is
                      performed through inter-correlation functions in order to assess the time delays between the
                      wind turbine responses depending on wind direction and wind speed.

1. Introduction & work objectives
Nowadays to deal with cost reduction and development constraints the principal solution is to
densify wind farms [1]. This strategy brings some inconveniences such as wake interactions
that leads to power losses and fatigue increase. To reduce these side effects wind farm control is
the envisaged solution. Indeed, these control strategies aim to improve the overall wind power
production of a farm by controlling individual wind turbines in order to mitigate their wake
effects. Two strategies are mainly studied, the induction control that is based on a power
curtailment strategy and the yaw control that is based on a wake steering strategy. The
potentiality of wind farm control has already been investigated and confirmed by simulations
[2, 3] and full scale field tests [4–6]. The dynamic properties of these different strategies are
now taken into account in some wind farm control models [7] but some parameters need to be
refined. For instance, the time delays between a manoeuvre of an upstream wind turbine and its
effect on the downstream one can be approached by a pure advection hypothesis, assuming that
the time delay is equal to the time for the air masses advected at the free wind speed to transit
from the upstream to the downstream wind turbine. Some previous works suggested to use a
proportion (80%) of the free wind speed as advection speed [7], or an average between the free
wind speed and the wake speed [8]. Furthermore, the wind turbine dynamic response will also
impact the overall time delay. Consequently, this parameter needs to be further studied and
better quantified. Through the post processing of a field database collected during the French
national project SMARTEOLE on two full-scale wind turbines, the overall time delay between
the dynamics of two wind turbines will be assessed. Correlation functions between both wind
turbine power time series acquired at a sampling frequency of 1Hz are performed and time delays
              Content from this work may be used under the terms of the Creative Commons Attribution 3.0 licence. Any further distribution
              of this work must maintain attribution to the author(s) and the title of the work, journal citation and DOI.
Published under licence by IOP Publishing Ltd                          1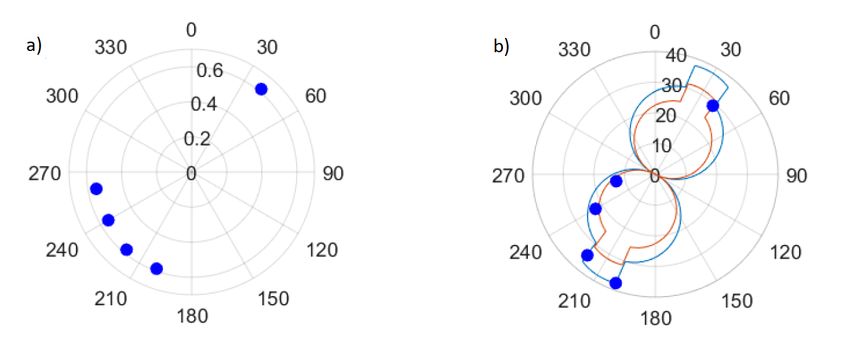
The Science of Making Torque from Wind (TORQUE 2020) IOP Publishing
Journal of Physics: Conference Series 1618 (2020) 062058 doi:10.1088/1742-6596/1618/6/062058
between the wind turbine responses are assessed. By classifying the set of time series according
to the wind direction and the wind turbine operating point, the influence of the wake interaction
on the time delay between the wind turbine responses will be studied.
2. Approach & methods
2.1. Experimental setup
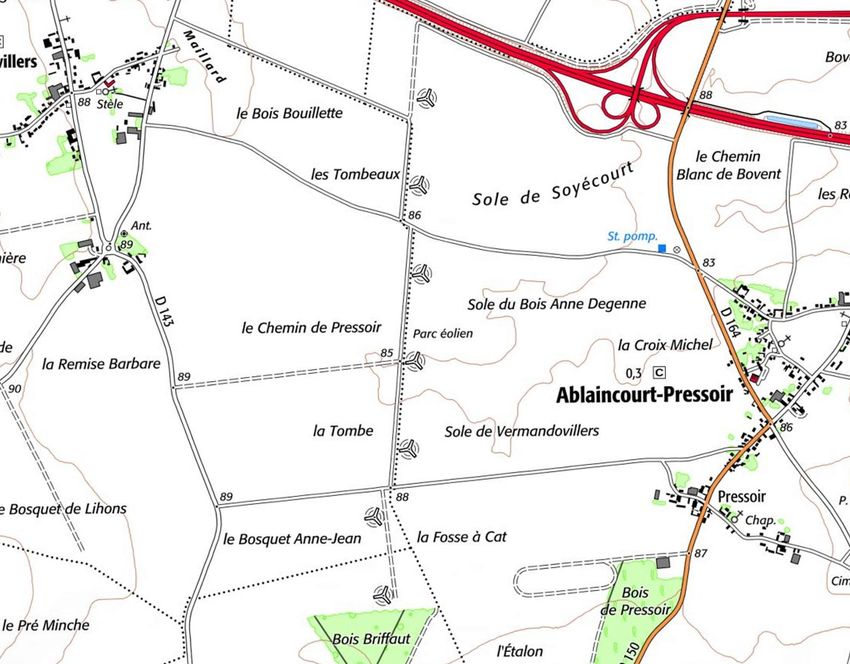
The measurement campaign took place on a wind farm (WF) located in the north of France
(Figure 1) with measurements done between January 2017 and November 2018 and already
used in [9] and [10]. The WF (Engie Green owned) is called Sole du Moulin Vieux (SMV)
and is located on the western limit of the Ablaincourt-Pressoir municipality. It is made of seven
wind turbines (WTs) named SMV1 to SMV7 which are sited from north to south and spaced
approximately 4.3 D apart. These SENVION MM82 WTs (guaranteed power curve in figure 2b)
have a diameter (D) and hub height (HH) of D = 82 m and HH = 80 m; and their nominal
power is 2050 kW which is reached for a nominal wind speed of 14.5 ms−1 , while their cut-in
wind speed is 3.5 ms−1 .
5°
207°
173.5°
ENGIE Green
Le Monolithe La Sole du Moulin Vieux Wind Farm Echelle :
59 Rue Denuzière
69002 LYON
Wind Turbines and Measurement Devices
Figure 1: Layout of the SMV wind farm and location of wind measurement devices. Inter-
distances between the wind turbines are expressed in rotor diameters (with D=82 m), while red
arrows indicate the wind direction with maximum wake interaction between the turbines. The
location of the ground based lidar Windcube V2 is also indicated.
2The Science of Making Torque from Wind (TORQUE 2020) IOP Publishing
Journal of Physics: Conference Series 1618 (2020) 062058 doi:10.1088/1742-6596/1618/6/062058
The site is not complex, with a very flat terrain composed mainly of grasslands, with the
exception of a small forest located south of the farm. The long term observed wind, illustrated
on the wind rose of figure 2a, shows that the prevailing wind directions comes mainly from the
south west. This corresponds mostly to the alignment between turbines SMV5 and SMV6 which
is 207° with respect to the north, consequently this layout makes it possible to observe a very
strong and frequent wake effect between these two turbines.
Wind speed: Probability of
N occurrence [%]
ws < 5 m/s
5 < ws < 10 m/s NNO NNE 5
10 < ws < 15 m/s 4
ws > 15 m/s
3
ONO ENE
2
1
O E 0
OSO ESE
SSO SSE
S
(a) Long term observed wind rose. Taken from [10] (b) Senvion MM82 guaranteed power curve
Figure 2: Wind resource at the site of Ablaincourt-Pressoir and guaranteed power curve of the
wind turbines.
2.2. Identification of reference wind turbines
A crucial point of this work was the supervisory control and data acquisition (SCADA) time
series classification according to wind direction and wind speed. Indeed measurements of two
different wind turbines in the same WF can be discordant for multiples reasons, so an inaccurate
choice of the reference WT can trick the classification. Concerning the wind speed just the
presence of the wake of an other WT can affect the measurements, while for wind direction some
undesired bias on the vane position can false the measurements. In order to reduce the possible
sources of error in the estimation of the wind characteristics the SCADA data-set quality was
tested taking as a reference a ground based lidar (Windcube V2) whose location is indicated on
figure 1. Indeed over a quite large period of measurement (May 2017 - Jan 2018) both SCADA
and Windcube data were available. The lidar provides averages over ten minutes of wind speed
and direction at different heights. The SCADA average wind measurements for the same ten
minutes intervals were compared to the lidar measurements at the range 80 m only, to be
consistent with the wind turbine hub heights. For each wind turbine in the farm, the difference
in measured wind speed and direction was calculated for each sample, and then this data-set was
classified according to the Windcube wind direction and binned over 20◦ sector, giving a single
mean error value per wind turbine for each direction sector. Some considerations regarding the
lidar position have to be done before analyzing the results. Indeed, according to the farm layout
in figure 1, the lidar is generally in the wake of one or more WT for mostly the wind sectors
[20◦ :180◦ ]. This affects its measurements, especially concerning the wind speed, and thus those
sectors are disregarded in the following analysis. The first evaluation was focused on the wind
direction measurement: this measurement being less sensitive to wake effects it was chosen to
establish a single reference WT in order to proceed with the classification of the entire SCADA
data-set over wind sectors. The wind direction was evaluated looking at the mean absolute
error (MAE) between the seven WT SCADA measurements and the Windcube. Figure 3 shows
the result of this analysis. Looking at the MAE, and taking into consideration the position of
3The Science of Making Torque from Wind (TORQUE 2020) IOP Publishing
Journal of Physics: Conference Series 1618 (2020) 062058 doi:10.1088/1742-6596/1618/6/062058
the Windcube, the WT SMV3 is a good choice as reference since its MAE is generally among
the smaller for most of the bins, and in particular for the sector of maximal wake interaction.
Focusing on the wind sector [180°:340°] (Windcube upwind) it shows a maximum error below
8°.
Figure 3: SCADA wind direction measurements mean absolute errors (MAE)
The same kind of evaluation was done as regards to the wind speeds. The percentage error
of the SCADA wind speed measurements with respect to the Windcube was calculated for each
sector. Figure 4 shows the results of the analysis. Three different WT references has been
taken according to the wind sectors in order to consistently take into account the wake effects
within the wind farm. Indeed, looking at sector [220°:320°], where there are no supposed wake
interactions, SMV4 represents a good choice (measurement error generally less than 2%) as
a reference for this sector. Just by symmetry considerations, SMV4 has been also chosen as
reference for the sector [40°:140°] since the Windcube is an unreliable reference for this sector.
Then according to the farm layout and the observed results, it is reasonable to take SMV1
as reference for northern wind sectors [340°:20°] and respectively SMV7 for southern sectors
[160°:200°].
4The Science of Making Torque from Wind (TORQUE 2020) IOP Publishing
Journal of Physics: Conference Series 1618 (2020) 062058 doi:10.1088/1742-6596/1618/6/062058
35
30
Wind speed error [%]
25
20
15
10
5
0
0 50 100 150 200 250 300 350
WD bins [°]
Figure 4: SCADA wind speed percentage mean errors
The table 1 below recaps the chosen reference wind turbines for each wind sector.
Table 1: Summary of the reference turbines chosen for wind speed and wind direction
measurements, depending on the wind direction sector.
Reference wind turbine
Wind direction sector
Wind speed Wind direction
North [340°; 20°] SMV1
East [40°; 140°] SMV4
SMV3
South [160 ; 200°] SMV7
West [220; 320°] SMV4
2.3. Data filtering & processing
Once determined the proper references for the estimation of wind characteristics it was possible
to process the whole SCADA database. The database contains ten minute averaged and standard
deviation data for each WT and high frequency sampled data (1Hz) for WT SMV5 & SMV6 only.
Before using the inter-correlation functions on the active power signals of these two turbines for
each ten minutes interval, some filtering had to be made. The filters that were applied to the
data are listed below:
(i) Both wind turbines had to be operational.
(ii) No movement of the nacelle position of both turbines had to be observed.
(iii) Any abnormal turbine behavior (such as curtailment) was filtered out.
(iv) Only periods with a wind speed between 10 ms−1 and 12 ms−1 (measured at the identified
reference wind turbine) were kept in the analysis. This is done in order to observe both
high wake effects and sufficiently high power production at the downstream turbine.
5The Science of Making Torque from Wind (TORQUE 2020) IOP Publishing
Journal of Physics: Conference Series 1618 (2020) 062058 doi:10.1088/1742-6596/1618/6/062058
Furthermore a data quality check was applied to the 1Hz active power time series. Indeed, to
properly study the correlation it was necessary to have a continuous sampling (600 samples for
10 minutes period at 1Hz) without gaps and duplicated values. So, over each ten minutes period,
the high frequency time series were analyzed to remove duplicates and detect the presence of
missing data in the time-series. Any ten minute time series with gaps longer than one second
were rejected, as concern the others, contingent gaps were filled by linear interpolation.
2.4. Calculation of inter-correlation between the turbines
After the data filtering and processing it was possible to proceed on the calculation of the
inter-correlation levels for each selected period. Any possible trend in the power signals was first
removed in order to focus on the power fluctuations of both wind turbines. The inter-correlation
in function of the time delay τ between the de-trended (continuous linear trends removed on
10-min signals) power signals PSM V 6 and PSM V 5 was calculated as in eq(1):
∫
Γ(τ ) = PSM V 6 (t)PSM V 5 (t − τ )dt (1)
The maximal value of Γ(τ ) was calculated for each correlation function. Periods with
correlation peaks below 0.5 were rejected, while for the others the time delay τ correspondent
to the peak was retrieved. The filtered correlation statistics were binned over 20° wind sector
(using the reference wind turbine SCADA data). Sector with less than 10 samples were rejected
because they were considered as non-statistically representative. In the end, after all these
restrictive filters only five sectors corresponding to the most prevailing wind directions were
obtained (see figure 2a).
3. Results
Figure 5a shows the inter-correlation levels between the wind turbine power signals measured
on SMV5 and SMV6. Each dot corresponds to the average of the 10 minutes periods correlation
statistics over a wind direction sector of 20°. For an easier representation the absolute values of
the inter-correlations statistics are shown. Indeed, according to the wind sector SMV6 can be
either upwind or downwind compared to SMV5 causing negative inter-correlation statistics.
Figure 5: Polar plot of inter-correlations levels (a) and time response in seconds (b) between the
1Hz power signals of wind turbine SMV6 and SMV6 with wind speed between 10ms−1 and
12ms−1 . Dots represents the inter-correlation statistics, colored lines the Tadv estimations
thresholds. For the time response each circle represents ten seconds.
6The Science of Making Torque from Wind (TORQUE 2020) IOP Publishing
Journal of Physics: Conference Series 1618 (2020) 062058 doi:10.1088/1742-6596/1618/6/062058
Results show inter-correlation levels around 0.6 for all the sectors matching the filtering
conditions independently of the wake interactions presence. Figure 5b shows the average
measured delay between the active power signals variations of SMV5 and SMV6 obtained by their
inter-correlations. As a general approach this work aims to evaluate whether this time delay
could be related to physical phenomenon, in particular the advection time between the two
wind turbines. As possible evaluation of the quality of the results, it was chosen to compare the
data with a classical estimation of the advection time based on the wind speed. The advection
time, intended as the time for the air masses to transit from the location of the upstream
turbine to the position of the downstream one, was so estimated by the measurement of the
reference SCADA wind speed. As mentioned at the start of the paper, one solution to estimate
the advection time in wake interaction conditions is to use a portion (80%) of the free stream
velocity (U∞ ) as done in [7]. Having considered in this work only wind speeds between 10 ms−1
and 12 ms−1 the advection time (Tadv ) corresponding to these thresholds was estimated. Figure
6 schematize the calculation of the stream-wise distance ∆X between SMV5 & SMV6. Knowing
the geometrical spacing between the wind turbine W TDist = 3.7D (at 207°) and the wind
direction W D, by simple trigonometric it possible to retrieve ∆X as in eq(2). Then ∆X is
divided for the advection speed Uadv to retrieve Tadv (represented by the colored lines in figure
5b). Concerning the advection speed, for the wake interactions sectors [200°:220°] and [20°:40°]
it was taken 0.8U∞ while for the other sectors just U∞ .
∆X = W TDist cos(W D − 207◦ ) (2)
Figure 6: Determination of the stream-wise distance ∆X (α = W D − 207◦ )
Finally looking at the time response results it can be found a general accordance between
the classical estimation of Tadv and the time response between the wind turbines. Focusing on
the wake regions, the results show as the wake interaction affects the wind turbine dynamic.
Indeed, the presence of the wake not only (as well known) decrease the power availability on the
downstream turbine, but reduce its time response and this reduction can be retrieved by the
evaluation of the power time series such as the aerodynamic advection time. The importance of
the evaluation of this parameter directly by the power time series is given by the fact that these
are generally the most reliable SCADA data and they can be easily integrated in the machine
control system.
7The Science of Making Torque from Wind (TORQUE 2020) IOP Publishing
Journal of Physics: Conference Series 1618 (2020) 062058 doi:10.1088/1742-6596/1618/6/062058
4. Conclusion
A post-processing of SCADA data acquired with a high sampling frequency on two neighbouring
wind turbines is performed through inter-correlation functions in order to assess the time delays
between the wind turbine responses depending on wind direction and wind speed. Furthermore
the influence of the level of wake interactions is discussed in terms of inter-correlation statistics
showing a general accordance with the classical advection considerations. The obtained results
show that this kind of analysis can contribute to refine the dynamic parameters of the wind
farm control models. For several reasons (among other the storage) it is not trivial to have
available a large 1Hz database. So the purpose of this work was to evaluate the potentiality
of this approach on the exploitation of the power measurements to retrieve the wind turbine
response especially in wake interactions condition. For these considerations this work has to be
considered as a preliminary study. Right now, an other acquisition campaigns is on going with
1Hz SCADA being recorded on all wind turbines in the farm. Hopefully, the study of this new
database will help in pushing further this first analysis.
Acknowledgments
The experimental database used in the present study had been collected during the project
SMARTEOLE (ANR-14-CE05-0034) funded by the French National Research Agency
References
[1] Lucy Y Pao and Kathryn E Johnson. A tutorial on the dynamics and control of wind
turbines and wind farms. In 2009 American Control Conference, pages 2076–2089. IEEE,
2009.
[2] Ervin Bossanyi and Tiago Jorge. Optimisation of wind plant sector management for energy
and loads. In 2016 European Control Conference (ECC), pages 922–927. IEEE, 2016.
[3] Pieter Gebraad, Jared J Thomas, Andrew Ning, Paul Fleming, and Katherine Dykes.
Maximization of the annual energy production of wind power plants by optimization of
layout and yaw-based wake control. Wind Energy, 20(1):97–107, 2017.
[4] LAH Machielse, S Barth, ETG Bot, HB Hendriks, and JG Schepers. Evaluation of “heat
and flux” farm control. final report. Technical report, ECN-E–07-105, 2008.
[5] JW Wagenaar, L Machielse, and J Schepers. Controlling wind in ecn’s scaled wind farm.
Proc. Europe Premier Wind Energy Event, pages 685–694, 2012.
[6] P. Fleming, J. Annoni, J. J. Shah, L. Wang, S. Ananthan, Z. Zhang, K. Hutchings,
P. Wang, W. Chen, and L. Chen. Field test of wake steering at an offshore wind
farm. Wind Energy Science, 2(1):229–239, 2017. doi: 10.5194/wes-2-229-2017. URL
https://www.wind-energ-sci.net/2/229/2017/.
[7] Ewan Machefaux, Gunner Chr Larsen, Niels Troldborg, Mac Gaunaa, and Andreas
Rettenmeier. Empirical modeling of single-wake advection and expansion using full-scale
pulsed lidar-based measurements. Wind Energy, 18(12):2085–2103, 2015.
[8] Ervin Bossanyi. Combining induction control and wake steering for wind farm energy and
fatigue loads optimisation. In Journal of Physics: Conference Series, volume 1037, page
032011. IOP Publishing, 2018.
[9] E Torres Garcia, S Aubrun, O Coupiac, N Girard, and M Boquet. Statistical characteristics
of interacting wind turbine wakes from a 7-month lidar measurement campaign. Renewable
energy, 130:1–11, 2019.
[10] Duc et al. Local turbulence parameterization improves the jensen wake model and its
implementation for power optimization of an operating wind farm. Wind Energy Science,
8The Science of Making Torque from Wind (TORQUE 2020) IOP Publishing
Journal of Physics: Conference Series 1618 (2020) 062058 doi:10.1088/1742-6596/1618/6/062058
4(2):287–302, 2019. doi: 10.5194/wes-4-287-2019. URL https://www.wind-energ-sci.
net/4/287/2019/.
9You can also read