A Comparison of Beach Replenishment on the U.S. Atlantic, Pacific, and Gulf Coasts
←
→
Page content transcription
If your browser does not render page correctly, please read the page content below
Journal of Coastal Research SI 6 127140 Fort Lauderdale, Florida Summer 1990
A Comparison of Beach Replenishment on the U.S. Atlantic,
Pacific, and Gulf Coasts
Lynn A. Leonard, Katharine L. Dixon and Orrin H. Pilkey
ABSTRACT
LEONARD, L.A.; DIXON, K.L. and PILKEY, O.H., 1990. A comparison of beach replenishment on the
U.S. Atlantic, Pacific, and Gulf coasts. Journal of Coastal Research, SI# 6, 127140. Fort Lauderdale
(Florida). ISSN 07490208.
The record of beach replenishment on the U.S. Atlantic, Gulf, and Pacific coasts has been examined. For
the most part, past beach replenishment projects have not been monitored. As a result, limited durability
data exist. Fewer durability data exist for the Gulf and Pacific coasts than for the Atlantic coast.
Available data suggest, however, that the durabilities experienced by Atlantic and Gulf coast replenished
beaches are similar, and that, in general, the Pacific has a better record of artificial beach maintenance
than the Atlantic or Gulf coasts. On all three coasts, most fills lasted between one and five years.
The majority of Gulf and Pacific coast replenished beaches are shorter than Atlantic coast replenished
beaches. Atlantic coast replenished beaches range in length from 0.5 mile to 10.5 miles; the average
length is 3.2 miles. Gulf coast beaches range in length from 1,000 feet to 5 miles; the average length is
1.2 miles. Pacific coast replenished beaches range from 0.2 of a mile to 6 miles; the average length is 1.2
miles.
In general, Pacific coast replenished beaches have the greatest cumulative density (volume per unit
length) averaging 6,228,000 cy/mi, followed by the Atlantic Coast averaging 1,585,000 cy/mi. Gulf coast
beaches tend to have the lowest densities, averaging 547,000 cy/mi.
Storms, as opposed to grain size, length, and density, appear to be the main factor responsible for
variation in replenished beach durability for all three coasts.
INTRODUCTION
In general, our society has three avenues of response to an eroding shoreline: (1) hard stabilization, i.e.
seawalls and revetments, (2) soft stabilization, i.e. beach replenishment, and (3) retreat or relocation. At
present, the first option, hard stabilization, is recognized as destructive to recreational beaches.
Meanwhile, the third option, retreat or relocation, is often politically difficult to implement because many
property owners object to relinquishing their land. As a result, beach replenishment is an increasingly
popular response to a rising sea level.
This paper addresses beach replenishment on a national scale. Sociopolitical and physical parameters of
replenishment operations on the U.S. Atlantic, Gulf, and Pacific coasts are compared and contrasted.
Data from all three areas through 1987 are used to determine the regional scale effects of several beach
replenishment parameters on artificial beach durability. The analysis is complex since general beach
characteristics and the type of data existing for each area as well as for each design parameter differ.
Three beaches, one from each of the three geographical areas, are presented as case studies. These
beaches have been replenish according to an engineering design, and monitoring data are available for
each.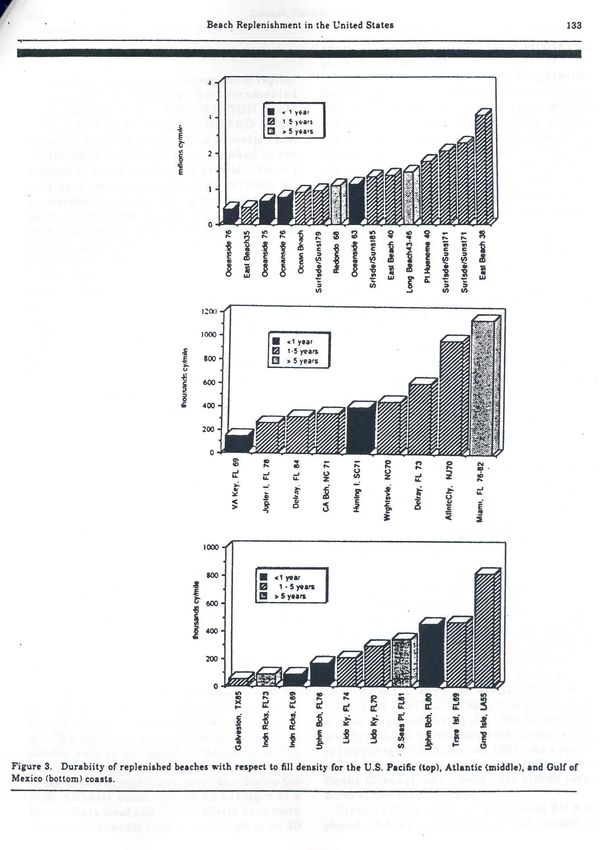
This study is a synthesis of earlier beach replenishment studies (PILKEY and CLAYTON, 1988;
LEONARD, 1988; DIXON and PILKEY, 1989; CLAYTON, 1989). As stated in these studies, limited
durability (beach lifetime) data exist due to a lack of project monitoring and published results. Analyses
have used data through 1987. Actual residence times of artificial beaches, measured by volumetric losses
or return of shoreline position to preproject location are often undocumented. Much of the available
beach lifetime data (especially for Pacific coast beaches) are qualitatively rather than quantitatively
expressed. That is, in many instances, information about postplacement behavior of the beach is
restricted to the terms “lost”, “gone”, etc. Even when all data are used (i.e. qualitative and quantitative),
numerous gaps remain in the data set. Because of gaps and the unusual mix of both qualitative and
quantitative data, only broad and general conclusions may be drawn.
THE U.S. EXPERIENCE
As of 1988, approximately 90 Atlantic coast beaches, 35 Gulf coast beaches, and 30 Pacific coast
beaches had been replenished. On most of the beaches, more than one beach replenishment operation has
been carried out. Overall, efforts in the United States (as of 1987) have resulted in over 400,000,000
cubic yards of sand emplaced over more than 400 miles of shoreline. The Atlantic coast has the greatest
length of replenished shoreline, over 270 miles, followed by the Gulf Coast, over 100 miles, and the
Pacific coast, over 30 miles.
Funding
Replenished U.S. beaches fall into six broad funding categories: flood control; navigation; emergency
repair; 1962 storm repair (on the Atlantic coast only); and projects designed to mitigate the damages
caused by federal navigation projects (referred to as “Section 111:”). Beach erosion control projects may
be funded by federal, state, local, or private sources, or a compination thereof. The cost of navigation
projects is almost always completely federal. The purpose of a federal navigation project is, primarily,
channel maintenance. If the dredge material is of beach quality and beach disposal is economically
feasible, beaches may be replenished under the federal navigation project category. Although a regular
practice on the Pacific coast, beach disposal is less common on the Atlantic and Gulf coasts where many
cubic yards of sand are dumped offshore as a result of federal navigation projects. The 1962 storm repair
projects were those designed to provide temporary storm protection after beach losses on Atlantic
beaches attributable to the 1962 Ash Wednesday storm.
On the Atlantic coast, 76% of the replenishment operations for which cost data are available were
federally funded. Specifically, 26% were federally funded beach erosion control projects, 23% were 1962
storm repair (mostly in New Jersey), 10% were navigation projects, 9% were emergency repair, 7% were
flood control, and two of 163 projects (1%) were Section 111 projects. Twentyone percent of the
replenishments were funded through state and local agencies, and 3% through private sources (PILKEY
and CLAYTON, 1988).
On the Gulf of Mexico coast, the 80 federally funded (in part or full) pumpings fall into three broad
categories: erosion control/storm protection; navigation; and emergency repair. Thirtyfive percent of the
replenishments were in the federally funded navigation category. On the Gulf coast, the cost of these
projects is completely federal. Twentyfour percent of the projects were in the federally funded erosion
control/storm protection, and 11% were in the emergency repair categories. The thirty projects (15%)
fully funded by state and local monies are considered beach erosion control/storm protection. Five
percent of the replenishment operations received their funding from private sources.
Most Pacific coast beaches have received sand in conjunction with harbor dredging and maintenance
(58%). Sixteen percent of the replenishments are beach erosion control/federal, and beach erosion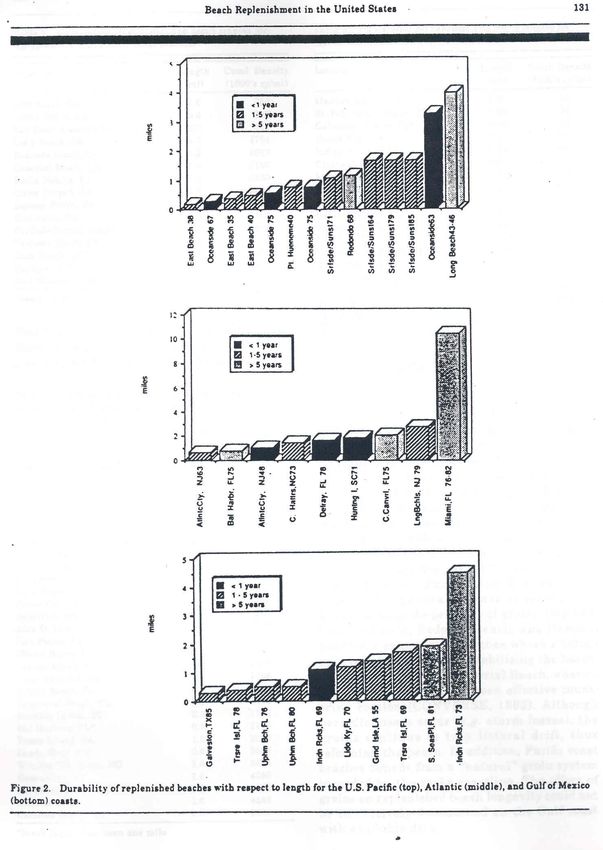
control/state and local, each. Ten percent fell into the privately funded category. Durability As mentioned, lack of project monitoring, especially for those projects constructed in conjunction with navigation projects, has resulted in limited available durability data. Where volumetric losses or linear recession rates have been reported, fill response has been quantified in terms of “beach lifetime” categories as a general expression of beach longevity. Beach lifetime categories are defined as the amount of time between fill emplacement and the loss of at least 50% of the original fill volume. Such is a conservative estimate of durability, as most artificial beaches had actually experienced a greater than 50% loss of fill material by the time assigned as the beach "halflife". The beach lifetime categories used for this study are less than one year, one to five years, and greater than five years. Another measure of beach lifespan is the percent of fill remaining one year after emplacement. The percentage of replenished beaches in each of the three longevity categories is similar for the Atlantic and Gulf coasts. On the Atlantic coast, 26% of the replenished beaches fell into the less than one year beach lifetime category. Sixtytwo percent fell into the one to five year category, and 12% fell into the greater than five year category. On the Gulf coast, the percentages are: 15% less than one year beaches; 75% one to five year beaches; and 10% greater than five year beaches (Figure 1). Characterizing Pacific coast replenished in terms of fill longevity (beach lifetime categories), 18% of the beaches fall into the less than one year category, 55% in the one to five year category, and 27% in the greater than five year category (Figure 1). One might expect a replenished beach constructed to engineering design specifications (i.e. beach erosion
control project) to exhibit greater longevity than a beach which has served as the disposal site for dredged
material. Although most Pacific coast beaches are replenished in conjunction with dredging operations,
the Pacific coast exhibits a percentage of beaches in the less than one year category similar to the
percentages determined for the Atlantic and Gulf coasts, and a lower percentage of replenished beaches
in the one to five year category than on the Atlantic or Gulf coasts (Figure 1). In the greater than five
year category, however, the greater longevity of Pacific coast replenished beaches relative to Atlantic and
Gulf coast beaches is overwhelming. Twentyseven percent of the Pacific coast beaches fall into the
greater than five year category, as compared to 12% for the Atlantic coast and 10% for the Gulf coast.
REPLENISHMENT DESIGN PARAMETERS
Length
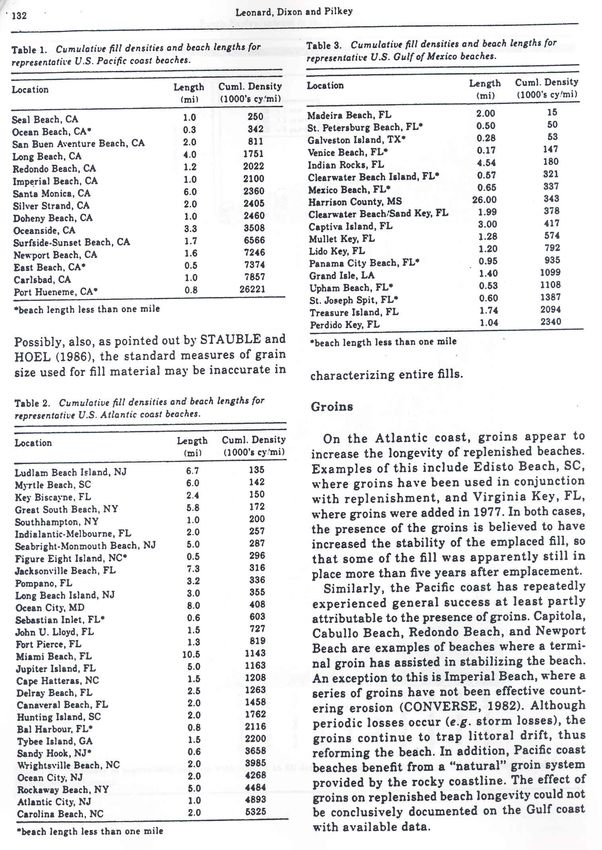
The length of replenished beaches has been considered an important control on artificial beach durability
(DEAN, 1983. 1988). Longer beaches are assumed to experience greater longevities than shorter
beaches. Alantic coast replenished beaches range in length from one half mile (Figure Eight Island, NC)
to 10.5 miles (Miami Beach. FL); the average length is three and twotenths miles. Gulf coast beaches
range in length from 1,000 feet (Redington Shores, FL) to five miles (Grand Isle, LA); the average length
is one and twotenths miles. Pacific coast replenished beaches range from two tenths of a mile (East
Beach, CA) to six miles (Long Beach. CA); the average length is one and twotenths miles.
In general, the shorter lengths of many Pacific coast beaches have not hindered the overall success
(Figure 2). Initial analysis suggests no relationship between replenished beach longevity and replenished
beach length on the Pacific coast. These findings concur with data from the Atlantic coast (Figure 2).
Length may exert modest control over replenished beach durability on the Gulf coast (Figure 2).
Although the reasons for these relationships are unclear, one possibility is that a lower degree of offshore
movement of fill occurs along Gulf coast beaches than along Atlantic or Pacific coast replenished
beaches.
Density
Fill density refers to the volume of sand per unit length of shoreline emplaced during the replenishment
operation. Initial fill densities for the Atlantic coast range from 142,000 cy/mi (Myrtle Beach, SC) to
1,893,000 cy/mi (Carolina Beach, N.C). The range on the Gulf coast is 15,000cy/mi (Madeira Beach, FL)
to 821,000 (Grand Isle, LA). On the Pacific coast, initial fill densities range from 20,000 cy/mi (Silver
Strand, CA) to 2,128,000 cy/mi (SurfsideSunset Beach, CA).
Cumulative density refers to the total volume of sand per unit length of the shoreline emplaced through
replenishment, including the initial replenishment and all subsequent nourishment projects. Pacific coast
replenished beaches have the greatest cumulative fill densities, ranging from 250,000 cy/mi (Seal Beach.
Length CA) to 26,221,000 cy/mi (Port Hueneme, CA); the mean Pacific coast density is approximately
1,632,000 cy/mi (Table 1). The Atlantic coast (Table 2) follows with cumulative densities ranging from
135,000 cy/mi (Ludlam Beach Island, NJ) to 5,325,000 cy/mi (Carolina Beach, NC); the mean Atlantic
coast cumulative density is approximately 1,525,000 cy/mi. Gulf coast replenished beaches (Table 3)
generally exhibit lower densities, ranging from 15,000 cy/mi (Galveston Island, TX) to 2,340,000 cy/mi
(Perdido Key, FL). The mean cumulative density for Gulf coast replenished beaches is approximately
547,000 cy/mi. Fill density is widely assumed to be directly related to replenished beach longevity.
Empirical evidence indicates that greater fill densities may yield greater replenished beach longevities
(STAUBLE and HOEL, 1986; LEONARD, 1988). On a regional scale, of individual projects does not
exert control over replenished beach longevity as measured by beach lifetime categories on either the
Gulf coast (Figure 3) or the Pacific coast (Figure 3). On the Atlantic coast, however, density appears to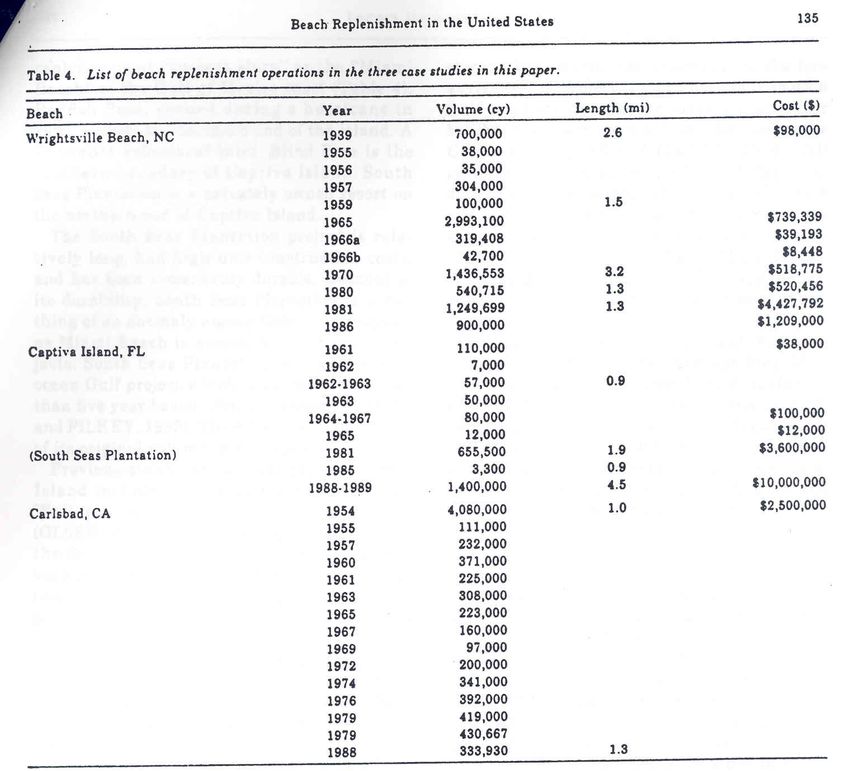
influence replenished beach durability (Figure 3), particularly when durability is measured as the percent
of fill remaining after the first year of project life (LEONARD et al., 1990). On the Gulf coast, this
measure supports the conclusion that density does not exert control over durability (DIXON and
PILKEY, 1989). Unfortunately, measures of percent of fill remaining after one year could not be
obtained for the Pacific coast.

Grain Size

Grain size is also widely assumed to be an important replenishment design parameter and a major factor
in determining the durability of a replenished beach. Yet, comparison of grain size versus durability of
replenished beaches on the U.S. Atlantic, Gulf, and Pacific coasts reveals no evidence of a relationship.
Possibly, this is because the range of grain sizes that has been used for beach replenishment is small.
Possibly, also, as pointed out by STAUBLE and HOEL (1986), the standard measures of grain size used
for fill material may be inaccurate in characterizing entire fills.
Groins

On the Atlantic coast, groins appear to increase the longevity of replenished beaches. Examples of this
include Edisto Beach, SC, where groins have been used in conjunction with replenishment, and Virginia
Key, FL, where groins were added in 1977. In both cases, the presence of the groins is believed to have
increased the stability of the emplaced fill, so that some of the fill was apparently still in place more than
five years after emplacement.

Similarly, the Pacific coast has repeatedly experienced general success at least partly attributable to the
presence of groins. Capitola, Cabullo Beach, Redondo Beach, and Newport Beach are examples of
beaches where a terminal groin has assisted in stabilizing the beach. An exception to this is Imperial
Beach, where a series of groins have not been effective countering erosion (CONVERSE, 1982).
Although periodic losses occur (e.g. storm losses), the groins continue to trap littoral drift, thus reforming
the beach. In addition, Pacific coast beaches benefit from a "natural" groin system provided by the rocky
coastline. The effect of groins on replenished beach longevity could not be conclusively documented on
the Gulf coast with available data.
Storm Activity

The effects of storms on movement of replenished beach sand has been well documented (e.g. ASHLEY
et al., 1987; WINTON et al., 1981; LEONARD, 1988). LEONARD (1988) observed that the longevity of
Atlantic coast replenished beaches is closely linked to the number of storms in the first year of a beach's
existence, as well as the time between fill emplacement and the first storm event. Similar]y, a correlation
between high erosion rates Pacific coast artificial beaches and the passage of major storms has been
documented (CLAYTON,1989).

Although no quantitative correlation between replenished beach longevity and storm activity has been
documented for the Gulf coast, the Gulf coast beach replenishment literature cites storm activity 20% of
the time to explain replenished shoreline changes (DIXON and PILKEY, 1989). In the Atlantic coast
literature, unexpected storm activity is cited as the underlying reason for a beach's success or failure
almost 47% of the time (LEONARD, 1988).

                                            CASE STUDIES
Three beaches have been selected as representative nourished beaches in their respective geographical
area (i.e. Atlantic, Gulf, Pacific). Selection criteria are: project was designed and constructed as part of a
beach erosion control project (federal or non federal), and monitoring data exist for the project. The
beaches chosen are: Wrightsville Beach, NC (Atlantic coast); South Seas Plantation, FL (Gulf of Mexico
coast); and Carlsbad, CA (Pacific coast) (Table 4).

Wrightsville Beach, North Carolina

Wrightsville Beach in New Hanover County, NC, has been subjected repeatedly to local and federal
efforts to stabilize the shoreline (Table 4). The beach is approximately 4.19 mi in length, with an average
dune height of 13 feet above mean sea level. Wrightsville Beach is one of the most frequently nourished
beaches on the U.S. Atlantic coast, and is an example of a beach where local and federal efforts have
more or less continuously kept a beach in place for 25 years. From 1939 to 1987, these efforts cost more
than $7,500,000.
Local attempts to stabilize Wrightsville Beach began as ear]y as 1923 with the construction of five timber groins, and again in 1925 with the emplacement of an addition six concrete reinforced groins. The earliest documented replenishment operation occurred as the result of funding by local interests in 1939 when 700,000 cy of sand were placed on the beach. From 1939 to 1960, Wrightsville Beach experienced extensive shoreline retreat attributed to hurricanes in 1944, 1955, 1958, and 1960 (WINTON et al., 1981). An estimated 500,000 cy of sand were placed on the beach between 1955 and 1960 in an attempt to compensate for the sand losses resulting from the passage of these storms (U.S. ARMY CORPS OF ENGINEERS, WILMINGTON DISTRICT, 1980). Federal funding of replenishment at Wrightsville Beach began in 1962 when Congress authorized the construction of a combined beach erosion control/hurricane protection project along the 14,000 feet of Atlantic shoreline extending north from Masonboro Inlet (U.S. ARMY CORPS OF ENGINEERS, WILMINGTON DISTRICT, 1982). During initial construction, 2,993,000 cy of very coarse shelly sand was dredged from Banks Channel and placed on the beach. Subsequent nourishment operations in May and October 1966 were completed with 318,000 cy and 42,000 cy of sand dredged from Masonboro Inlet and the estuary behind neighboring Shell Island. The construction of the first of the Masonboro Inlet jetties between 1965 and 1986 was said to adversely affect Wrightsville Beach project longevity. Since the jetty was at the "downstream" end of the beach, the cause of any adverse effect is unclear. The replenished beach experienced unexpectedly high rates of
erosion, particularly along the northern 7,000 feet of the project (U.S. ARMY CORPS OF ENGINEERS, WILMINGTON DISTRICT, 1982). The total volume of sand emplaced during the 1966 fill (approximately 360,000 cy) was lost from the study area in two years (WINTON et al., 1981). As a result, 1,377,000 cy of material were dredged from Banks Channel, and placed over almost three miles of the beach in 1970. From 1970 to 1980, no additional fill was placed, although the shoreline had receded to the pre1970 shoreline position by 1974 (WINTON et al., 1981). In 1980, approximately 500,000 cy of medium to coarse sand were added as part of an emergency fill (U.S. ARMY CORPS OF ENGINEERS, WILMINGTON DISTRICT, 1982). Continued losses required complete restoration of the original (1965) shore protection project. This replenishment was performed between December, 1980 and April, 1981. The return to the original design configuration required the dredging and placement of approximately 1,250,000 cy of sand from Masonboro Inlet over the northern 7,000 feet of the project area (U.S. ARMY CORPS OF ENGINEERS, WILMINGTON DISTRICT, 1982). The behavior of this fill is undocumented; however, subsequent losses required an additional 900,000 cy of sand be placed on Wrightsville Beach in May, 1986. Despite the varying combination of replenishment parameters incorporated in the replenishment design plans at Wrightsville Beach, the longevity of any one pumping operation has not exceeded four years. Analyses of repeated pumpings at Wrightsville Beach (LEONARD et al., 1990) suggest that changes in grain size and length do not affect beach longevity to the extent that changes in fill volume and storm activity do. South Seas Plantation, Captiva Island, Florida South Seas Plantation on Captiva Island, Lee County FL, is considered by many as the replenishment "success story" or the "Miami Beach" of the Gulf of Mexico coast (Table 4). Redfish Pass, opened during a hurricane in 1926, bounds the northern end of the island. A somewhat ephemeral inlet, Blind Pass is the southern boundary of Captiva Island. South Seas Plantation is a privately owned resort on the northern end of Captiva Island. The South Seas Plantation project is relatively long, had high unit construction costs, and has been remarkably durable. Because of its durability, South Seas Plantation is something of an anomaly among Gulf coast projects, as Miami Beach is among Atlantic coast projects. South Seas Plantation is the only open ocean Gulf project which falls into the greater than five year beach lifetime category (DIXON and PILKEY, 1989). The fill lost only about 31% of its original volume in five years. Previous stabilization attempts at Captiva Island include the installation of 134 Budd Wall concrete "dog bone" groins in 1961 (OLSEN, 1982). Some of these groins fall within the South Seas Plantation project area, and were covered by fill. Most of the efforts at Captiva have been locally and/or privately funded groins, revetments, seawalls, and small fills along various small stretches of shoreline. A federally funded beach erosion control project received Congressional authorization in 1970, but was never implemented due to lack of local cooperation (STEVENS and OLSEN, 1979). The South Seas Plantation project was constructed to an engineering design, and has been monitored. Construction of the project took place from July to October, 1981. The project is nearly two miles long. Another exceptional fact about this project is that it was funded fully by private resources at a cost of about $3,600,000 (OLSEN, 1982). The hydraulically emplaced 650,000 cy of fill was taken from the ebb tidal delta of Redfish Pass at the north end of the project area. The southern end of the project is about two miles from Blind Pass. A "terminal groin" was constructed at the north end of the project to retard
transport of fill material into Redfish Pass.

The long life of the project is attributed to grain size of the fill material (OLSEN, 1982). The fill material
was nearly identical to native, with an excess of coarse shell (STAUBLE and HOEL, 1986). Yet,
attributing the longevity of the project to grain size may not tell the whole story; other factors may
contribute to the longevity of the project. The project is long on a Gulf coast scale. Analyses suggest that
longer beaches may experience longer lifetimes on the Gulf coast (DIXON and PILKEY, 1989). Fill
retention might also be attributed to the presence of shore perpendicular structures beneath and at the
northern end of the fill. Monitoring shows relative accretion in the northern section of the fill and erosion
in the southern section (STAUBLE and HOEL, 1986). Perhaps the terminal groin at the northern end is
trapping sediment.

A beach erosion control project was constructed from August, 1988 through May, 1989 over the length
of Captiva Island, including most of South Seas Plantation (HAGERUP, 1989) (Table 4). The project
covers four and a half miles, and used 1,400,000 cy of sand borrowed from Redfish Pass. Cost of this
most recent Captiva project was about $10,000,000 from private, local, and state funds.

     Privacy Statement | Legal Notice | State Req. Reports | Compact with Texans | Webmaster
   Contact Us | TAMU Homeland Security | Texas A&M University System | Texas A&M College
                                               Station
 Texas A&M Qatar | Texas A&M Galveston | Statewide Search | Texas Homeland Security | State of
                                               Texas
You can also read