Resource-use Efficiency in Watermelon Production in the Patuakhali District, Bangladesh - Journal Repository
←
→
Page content transcription
If your browser does not render page correctly, please read the page content below
Asian Journal of Agricultural and Horticultural Research

                            1(3): 1-8, 2018; Article no.AJAHR.41182

     Resource-use Efficiency in Watermelon Production
                 in the Patuakhali District, Bangladesh
            Bishwajit Sarker1*, Shankar Majumder2 and Sheikh Mohammad Sayem2
                1
             Department of Agricultural Statistics, Sylhet Agricultural University, Sylhet, Bangladesh.
 2
  Department of Agricultural Statistics, Bangladesh Agricultural University, Mymensingh, Bangladesh.

                                                                                           Authors’ contributions

        The work has been carried out from author BS master’s thesis and collaboration with supervisor
  author SM and co- supervisor author SMS. Author BS designed the study, performed the descriptive
statistical analysis, wrote the protocol and wrote the first draft of the manuscript. Authors SM and SMS
      managed the other analyses of the study. All authors managed the literature searches, edited the
                                                     manuscript, read and approved the final manuscript.

                                                                                                Article Information

                                                                                      DOI: 10.9734/AJAHR/2018/41182
                                                                                                              Editor(s):
        (1) Ahmed Medhat Mohamed Al-Naggar, Professor of Plant Breeding, Department of Agronomy, Faculty of Agriculture,
                                                                                                Cairo University, Egypt.
                                                                                                             Reviewers:
                                       (1) Miguel Aguilar Cortes, Universidad Autonoma Del Estado De Morelos, Mexico.
                                              (2) Hayder Khan Sujan, Sher-e-Bangla Agricultural University, Bangladesh.
                                      Complete Peer review History: http://www.sciencedomain.org/review-history/24340

                                                                                    Received 16th February 2018
                                                                                                    th
  Original Research Article                                                            Accepted 24 April 2018
                                                                                                    th
                                                                                       Published 27 April 2018

ABSTRACT

 This study was conducted in the Patuakhali District of Bangladesh during the production period
 2015-2016 to determine the efficiency of resource use in watermelon production. A total of 180
 farmers were selected from the study area through multistage stratified random sampling
 technique and face to face interview was conducted to collect primary data. To estimate the
 coefficients of the various variables the Cobb-Douglass production function was used and, MVP
 index was also used to evaluate the efficiency of resource use in the study area. From the
 regression results, land, seed, labour and pesticide were observed to affect watermelon output
 significantly (1%) and hence are the determinants of watermelon production. Resource use
 efficiency analysis revealed that farmers are not efficient in using resources in watermelon
 production and indicated that land (33.62), seed (10.17), labour (19.32) and fertiliser (1.92), were
 being underutilised and pesticide was being highly over-utilized in the study area. Therefore, by
 increasing the use of these resources can maximise profit in watermelon production in
 Bangladesh.

_____________________________________________________________________________________________________

*Corresponding author: Email: bsarker481@gmail.com;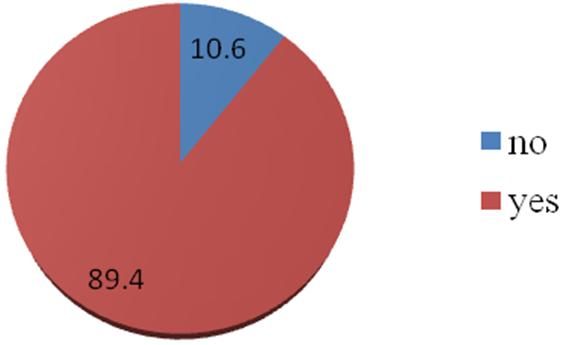
Sarker et al.; AJAHR, 1(3): 1-8, 2018; Article no.AJAHR.41182

Keywords: Resource use; efficiency; Cobb-Douglas; watermelon; Bangladesh.

1. INTRODUCTION                                            A lot of published (with online) articles on
                                                           watermelon cultivation and resource use
Watermelon is a prevalent delicious food with              efficiency in different crops, vegetables and fruits
vitamin A and C which is also a good source of             had been searched and reviewed. Murshida
Carbohydrate. Nowadays, it is cultivated                   Khanam and Umme Hafsa conducted research
commercially in our country, and we can earn a             on Market model analysis and forecasting
lot of foreign currency by exporting this. So,             behavior      of    Watermelon     production     in
watermelon production can play an essential role           Bangladesh [1]. Md. Ghulam Rabbany, Airin
in our economic development [1]. It is an                  Rahman, Sharmin Afrin, Fazlul Hoque, Faijul
important summer cash crop which has great                 Islam. analysed the Cost of Production and
demand in the domestic market. Its demand is               profitability of Watermelon [4]. I. Adeoye, F. B.
increasing day by day, but both acreage and                Olajide-Taiwo, O. Adebisi-Adelani, J. M. Usman
production are decreasing [2]. Commercial                  and M. A. Badmus. July 2011. Studied economic
cultivation of watermelon is concentrated in the           analysis of watermelon based production system
district of Patuakhali, Chittagong, Raishahi,              [5]. S. Folaranmi, G. Yusuf1, F. S. Lategan1 & I.
Natore, Jessore, Comilla and GopalGonj [3] and             A. Ayinde; 2013 [6] examined profitability and
it is considered as profitable crop to the growers         adoption of watermelon technologies by farmers.
of those areas.                                            But no research work has been done on
                                                           resource use efficiency of the watermelon
In any production activity resources are used              production in Bangladesh. For this reason,
regarding as the inputs that drive the production          an attempt was made to conduct the present
process. In watermelon farming, the resources              study.
required include the seeds, land, labour, capital,
fertilizer and pesticide. The main equipment               2. METHODOLOGY
applied is the conventional cutlass and hoe
technology which has been blamed for the low               For the selection of the watermelon growing
output levels of farmers. A resource or input is           farmers a multi-stage stratified sampling design
said to be efficiently utilized when it is placed to       has been used. Among different districts of
the greatest apply achievable and at minimum               Bangladesh the study has been chosen
cost permissible.                                          Patuakhali district, considering the intensity of
                                                           watermelon production coverage especially in
In a bid to aid farmers enhance productivity; the          sandy lands of coastal islands. This district is the
spotlight is usually on whether farmers are                largest watermelon growing region, both in
using better and superior technologies. It is              acreage and output over the last few years [3].
however essential to explore whether these                 Then three upazilas are selected from the district
farmers are even making maximum use of what                by using simple random sampling (SRS)
is existing to them in terms of inputs so that the         technique. After selecting the upazilas one union
stakeholders involved in agriculture will be               from each selected upazila is selected randomly
persuaded that the new technologies they                   using SRS technique. Then, two villages from
intend to introduce to farmers will be used                each union are selected by same technique.
efficiently and cost—effectively to further output.        Finally, 30 watermelon growing farmers from
Farmers might use resources wisely but not at              each village are selected using multistage
the financially viable level. Since the aim of             stratified sampling technique with equal
every agribusiness firm is to maximize profit              allocation as the population of all the villages is
whiles minimizing cost, it is relevant to                  more or less equal (450, 455, 475, 437, 467, and
determine the efficiency of resource-use.                  465, respectively). The ultimate sample size is
                                                           180 respondents from which primary data were
This study seeks to express the socio-economic             obtained through the administration of a pre
characteristics of watermelon farmers, calculate           tested structured questionnaire. Information
approximately the farm production function of              was collected on the respondents’ socio-
watermelon with a view of deriving the marginal            economic characteristics such as age, education
factor productivity so as to estimate how                  level, farm size, farming experience, cost and
competently the watermelon farmers are using               revenue in watermelon production etc. under the
their resources.                                           study.

                                                       2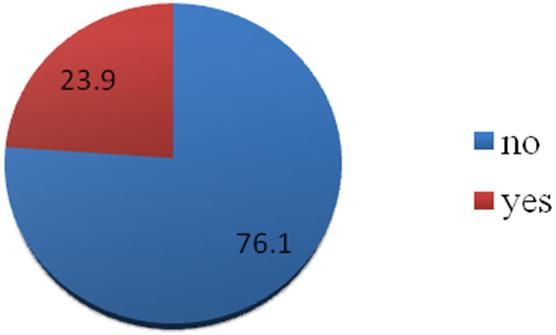
Sarker et al.; AJAHR, 1(3): 1-8, 2018; Article no.AJAHR.41182

2.1 Analytical Techniques                                The MPP is obtained from the estimated
                                                         regression coefficients which are the elasticities
Descriptive statistics using percentage and              of Production (E).
frequency tables were used in the analysis of
the socio-economic characteristics of the                MPPx=dy/dx But Ex= dy/dx.x/y, Hence Ex .y/x =
farmers.                                                 dy/dx = MPPx Therefore, MVPx = Ex .y/x.px

                                                         y = mean value of output, x = mean value of
Ordinary Least Squares (OLS) was used to                 input x
obtain the farm production function. The Cobb
Douglas production function was employed in              MVP for each in input was therefore obtained by
this study as it gave the best fit compared to the       multiplying the regression coefficient of that input
linear, exponential and semi-log functional              with the ratio of the mean value of output and
forms.                                                   that input and with the unit price of output.

The linear stochastic form of the specified Cobb         MFC of each input was however obtained from
– Douglas function is given as;                          data collected on the unit market prices of the
                                                         various inputs during the 2016 production
lnY = lnA + b1lnX1 + b2lnX2 + b3lnX3 + b4lnX4 +          season.
b5lnX5 + µi
                                                         The decision rule for the efficiency analysis is if:
Where:
                                                         r = 1; resource is been used efficiently
Y=Watermelon output (piece), X1=Farm size                r >1; resource is under utilization and increased
(decimal),     X2=Quantity     of    seed (kg),          utilization will increase output.
X3= Labour (man-days), X4= Quantity of                   r  50 years) were
Where                                                    found 7 and 6.3 percent, respectively.

Pxi=Unit price of input Xi                               The education levels of the farmers under study
MVP is obtained from the expression, MVP =               were presented in Fig. 3.2. The education levels
MPP × Py                                                 of the farmer were categorized by primary,
                                                         secondary and tertiary level. However, about 76,
Where                                                    20 and 4 per cent of them were primary,
                                                         secondary and tertiary level, respectively.
MPP=Marginal Physical Product and Py =Unit               Highest rate of educated farmer was at primary
Price of Output                                          level, that is, most of the farmers had primary

                                                     3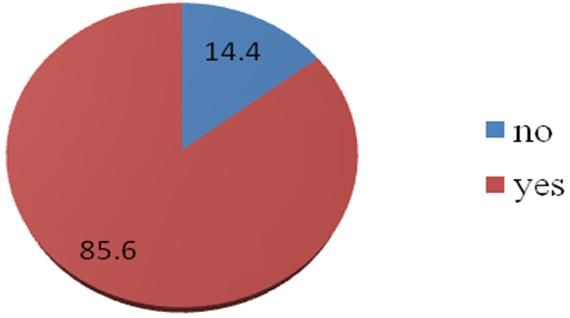
Sarker et al.; AJAHR, 1(3): 1-8, 2018;; Article no.AJAHR.41182
                                                                                                                                    no.

knowledge of education who cultivates                                               per cent farmers
                                                                                                armers have experienced on farming
watermelon. The local literacy rate is 54.1% also                                   years 6-8.8. This experience include not only on
supports these results [11].                                                        watermelon farming but also on other crop
                                                                                    cultivation such as rice, wheat, maize,
Experience of the farmers on farming is                                             vegetables, etc.
presented as a histogram in Fig. 3.3. About 39

                                               100
             Percentage (%) of farmers

                                                   80

                                                   60

                                                   40

                                                   20

                                                   0
                                                          50
                                                                       Age of farmers (years)

                                                           Fig. 3.1.
                                                                3.1 Age distribution of the farmers

                                                   80
                     Percentage (%) of farmers

                                                   70
                                                   60
                                                   50
                                                   40
                                                   30
                                                   20
                                                   10
                                                    0

                                                                             Education level

                                                           Fig. 3.2.
                                                                3.2 Education levels of the farmers

                                                   40
                       Percentage (%) of farmers

                                                   35
                                                   30
                                                   25
                                                   20
                                                   15
                                                   10
                                                    5
                                                    0
                                                        4 to 6      6 to 8          8 to 10          >10
                                                                       Experience on farming (years)

                                                        Fig. 3.3. Experience on farming of the farmers

                                                                                4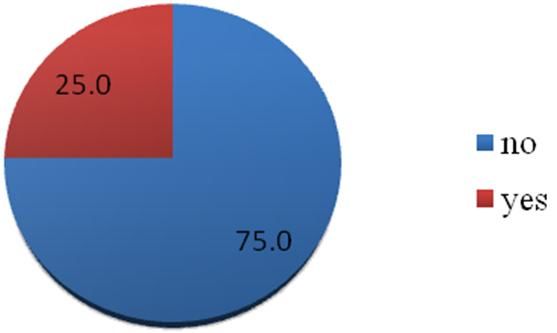
Sarker et al.; AJAHR, 1(3): 1-8, 2018; Article no.AJAHR.41182
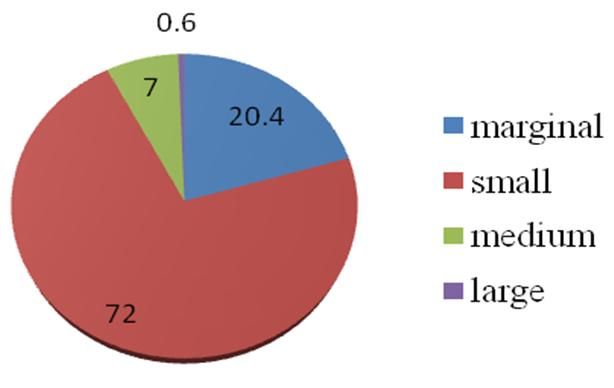
Fig. 3.4 reveals that among the farms, about 20, also provide education. Thus, in the present
72, 7 and 1 per cent are marginal, small, study, an attempt is made to find out whether
medium, and large farms, respectively. Most of watching and/or listening to agricultural
the farmers were of small category (72 percent) programmes on TV and/or radio has any
in this study. The average land size of the farmer significant impact on farmer’s efficiency. Among
in this district is 245 decimals which supports this the farmers under study, only 25 per cent of them
result [11] Range of land for marginal, small, reported that they have taken this facility more or
medium, and large farmers were 5-49 decimals, less regularly which is shown in Fig. 3.8.
50-249 decimals, 250-749 decimals, and above
750 decimals. Farming is the main livelihood of rural people. All
the farmers of this study are involved in farming
In Fig. 3.5, a pie chart for sample farmers who whereas about 76 per cent of them depend
have received extension contact is shown. About solely on agriculture for their livelihood (Fig.
85 per cent of the farmers under study have 3.9).This result truly same as the local average
reported that they took extension contact from that main sources of income is Agriculture
their relatives or any experienced person during (57.05%) [11]. The remaining farmers were
watermelon production. They received involved in other activities.
information on pesticide, insecticide, plant
diseases and input prices. 3.1 Production Data
Only a small portion of sample farmer received
training on farming (Fig. 3.9). A little per cent of The average area under watermelon cultivation
the sample farmers have participated in among the farmers is 173.76 decimals (Table
agricultural training organized by different GOs 3.1), about 60 per cent farmers have cultivated in
and NGOs. They have received different watermelon less than 150 decimals. All the
techniques on farming, such as, cultivation farmers have grown local watermelon variety.
techniques, fertilization and tillage operation. The The mean output of the farmers was 64.98
duration of the training they received varied from piece/decimal.
1 to 12 days.
The average human labour used by the farmers
Watermelon cultivation needs high requirement is 0.006 man-day per decimal. The labourers are
of working capital for watermelon cultivation of family and hired. Most of the labourers are
compared with rice, wheat, maize and used for land preparation and harvesting. The
vegetables. Most of watermelon growing farmers average amount of seed used by the farmers is
must take credit from NGOs or relatives or other 0.0028 kilogram per decimal. The average
institutes due to possess insufficient land and fertilizer used by the farmers is 7.646 kg/decimal.
capital (Fig. 3.7). This is just opposite of the The farmers mainly use Urea, TSP (Triple super
finding [12] that the farmers do not receive phosphate) and MP (Muirate of potash). In
financial assistance in form of credit from formal addition to these three fertilizers, some farmers
sources. They depend mostly on their personal have used Gypsum, Zinc, Boron, DAP (Di-
savings. ammonium phosphate) and mixed fertilizer. The
average amount of Pesticide used by the farmers
TV and Radio have become common devices in
is 0.4293 litre per decimal.
rural areas which not only entertain people but
Fig. 3.4. Percentage of the farms in each farm Fig. 3.5. Percentage of the farms having
category extension contact
5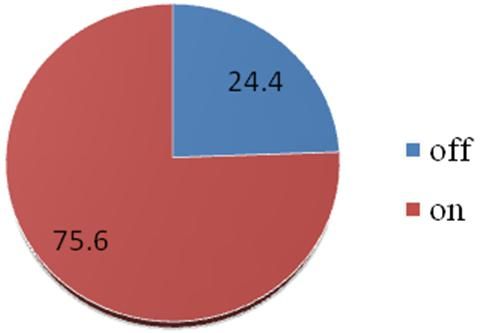
Sarker et al.; AJAHR, 1(3): 1-8, 2018; Article no.AJAHR.41182

     Fig. 3.6. Training received by the farmers                Fig. 3.7. Percentage of the farmers credit
                    (in percentage)                                taken for watermelon production

      Fig. 3.8. Watching and/or listening to                        Fig. 3.9. Involvement in farming
  agriculture related programmes on TV and/or                      among the farmers (in percentage)
               Radio (in percentage)

The result for the production function analysis is         labour increase by 1%, yield of watermelon
shown below in Table 3.2.                                  would increase by 9.0%, and 17.1%,
                                                           respectively. Pesticide, however, had a negative
Estimated Cobb-Douglas production function for             coefficient indicating that an increase in pesticide
watermelon production.                                     will lead to a decrease in yield and this
                                                           corroborates [6] who studied on resource-use
From the regression results, land, seed, labour            efficiency in cowpea production in North East
and pesticide were observed to affect                      Zone of Adamawa State and reported an inverse
watermelon output significantly and hence are              relationship between pesticide and output.
the determinants of watermelon production in the
study area. All of them were significant at 1%.            From the result of resource-use efficiency
The R2 value for the regression is 95.6% and this          estimation shown in Table 3.3, the use of
means that the factor inputs explain 95.6% of the          pesticide was found to have a negative efficiency
variations in the watermelon output. Also from             coefficient. This indicates an extreme use of
the F – statistic it can be concluded that the             pesticideby the farmers which in turn leads to
overall regression is significant at 1%                    reduction in profit obtained. On the other hand,
significance level. The values of the coefficients         seed, land, labour, and fertilizer were the
indicate the elasticity of the various inputs to the       inputs being underutilized as their Efficiency
output. Considering land the elasticity value              coefficient is greater than one. To increase
indicates that if land under cultivation is                output, there is the need for the farmers to
increased by 1%, the yield of watermelon would             increase the utilization of seed, land, labour, and
increase by 78.4%. If the quantity of seed and             fertilizer.

                                                       6
Sarker et al.; AJAHR, 1(3): 1-8, 2018; Article no.AJAHR.41182
Table 3.1. Different characteristics of input resources of watermelon cultivation
Input Mean value Standard error (Mean)
Area (decimal) 172.682 11.5315
Watermelon output (piece/decimal) 64.988 0.1232
Human labour (man-day/decimal) 0.0614 0.0044
Seed (kg/decimal) 0.0028 0.0002
Fertilizer (kg/decimal) 7.6465 0.0050
Pesticide (liters/decimal) 0.4293 0.0406
Table 3.2. Dependent variable: LOG (OUTPUT)
Factor inputs Coefficients Std. error t – values
Land 0.784 0.033 24.080***
Seed 0.090 0.031 2.867***
Labour 0.171 0.043 4.013***
Fertilizer 0.017 0.018 0.934
Pesticide -0.058 0.017 -3.419***
constant 5.035 0.225 22.360***
R2 0.956
F- value 758.523***
*** Significant at 1% Source: Field survey, 2016
Table 3.3. Efficiency of resource – use in watermelon production
Resource / Input Coefficient MVP MFC r
Land 0.784 5805.52 173 33.61972
Seed 0.090 4.92115 0.48 10.17
Labour 0.171 204.9312 11 19.323
Fertilizer 0.017 2536.502 1320 1.921
Pesticide -0.058 -485.801 74 -6.554
Source: Field survey, 2016
4. CONCLUSION REFERENCES
Findings from the study indicate enough 1. Khanam M, Hafsa U. Market model
potential, therefore, exist for the increased analysis and forecasting behavior of
production of watermelon in the study area. The watermelon production in Bangladesh.
farmers receive financial assistance in the form Bangladesh J. Sci. Res. 2013;26(1&2):47-
of credit from formal sources with a high-interest 56.
rate which has been blamed for the high cost of
2. Hoque MS, Uddin MF, Islam MA. A market
farmers. So, the government and financial
model for watermelon with supply under
institutions in the area should consider making
rational expectations: An empiricals study
loans available and accessible to the farmers so
on Bangladesh. European Scientific
that they can afford to increase the use of the
Journal. 2015;11(9):236.
inputs that are currently being underutilised.
Also, there is the need for extension service 3. BBS. Bangladesh Bureau of Statistics.
through a department of agricultural extension in Yearbook of Agricultural Statistics of
the study area to train the farmers to increase the Bangladesh, Planning Division,
use of land, hired labour and seed and also the Government of the People’s Republic of
right quantities of pesticide and fertiliser to boost Bangladesh, Dhaka, Bangladesh; 2014.
the profitability of the farm. 4. Rabbany MG, Rahman A, Afrin S, Hoque
F, Islam S. An analysis of cost of
COMPETING INTERESTS production of watermelon and profitability
at Gopalgonj District in Bangladesh.
Authors have declared that no competing European Journal of Banking and Finance.
interests exist. 2013;10.
7Sarker et al.; AJAHR, 1(3): 1-8, 2018; Article no.AJAHR.41182
5. Adeoye I, Olajide-Taiwo FB, Adebisi- 9. Goni M, Mohammed S, Baba BA. Analysis
Adelani O, Usman JM, Badmus MA. of resource-use efficiency in rice
Economic analysis of watermelon based production in the Lake Chad Area of Borno
production system in Oyo State, Nigeria. State, Nigeria. Journal of Sustainable
ARPN Journal of Agricultural and Development in Agriculture &
Biological Science. 2011;6(7). ISSN: 1990- Environment. 2007;3:31-37.
6145. 10. Stephen J, Mshelia SI, Kwaga BT.
6. Folaranmi S, Yusuf G, Lategan FS, Ayinde Resource-use efficiency in cowpea
IA. Profitability and adoption of watermelon production in the North-Eastern zone of
technologies by farmers in Moro Local Adamawa State, Nigeria; Department of
Government of Kwara State, Nigeria. Forestry and Wildlife Management,
Journal of Agricultural Science. 2013;5(5). Federal University of Technology. Yola,
ISSN: 1916-9752. E-ISSN: 1916-9760. Nigeria; 2004.
7. Kabir MMA, Alam AAKM, Rahman AHMA.
11. District Statistics; 2015.
Impact of agricultural credit on MV Boro
rice cultivation in Bangladesh. Journal of 12. Tamboa JA, Gbemub T. Resource-use
Agriculture & Rural Development. efficiency in tomato production in the
2006;4(1&2):161-168. Dangme West District, Ghana. Conference
8. Fasasi AR. Resource use efficiency in yam on International Research on Food
production in Ondo State, Nigeria. Security, Natural Resource Management
Agricultural Journal. 2006;1(2):36-40. and Rural Development. Zurich; 2010.
© 2018 Sarker et al.; This is an Open Access article distributed under the terms of the Creative Commons Attribution License
(http://creativecommons.org/licenses/by/4.0), which permits unrestricted use, distribution, and reproduction in any medium,
provided the original work is properly cited.
Peer-review history:
The peer review history for this paper can be accessed here:
http://www.sciencedomain.org/review-history/24340
8You can also read