House Prices & Affordability
←
→
Page content transcription
If your browser does not render page correctly, please read the page content below
Cornwall Local Plan: Housing Evidence Base

House Prices & Affordability
Housing Evidence Base Briefing Note 14:

National Policy Context
DCLG current Strategic Housing Market Assessment Guidancei states that
‘understanding house price change is key to understanding the housing market’, and
that it ‘represents a direct indicator in relation to the supply and demand balance. For
example, at a basic level, where demand is lower than supply the price will fall; where
demand is higher than supply, the price will rise. While this formula is overly simplistic
and in reality house price levels are influenced by a complexity of factors, the
economic downturn has illustrated the vulnerability of the dynamics of the market to
external factors, including the availability of mortgage finance and the attitudes of
lenders’.

Draft National Planning Practice Guidance is clear in its ‘Assessment of Housing and
Economic Development Needsii that ‘the housing need number suggested by
household projections (the starting point) should be adjusted to reflect appropriate
market signals, as well as other market indicators of the balance between the demand
for and supply of dwellings. Prices or rents rising faster than the national/local
average may well indicate particular market undersupply relative to demand. Relevant
signals may include the following…..Mix adjusted house prices (adjusted to allow for
the different types of houses sold in each period) measure inflation in house prices.
Longer term changes may indicate an imbalance between the demand for and the
supply of housing…..Assessing affordability involves comparing house costs against
the ability to pay. The ratio between lower quartile house prices and the lower quartile
income or earnings can be used to assess the relative affordability of housing…’

Definition
Access to a good quality home at an affordable price is a basic human need. Housing
covers all types of housing related development required to meet the needs of the
current and future population. Housing ranges from open market housing for those
who can afford to purchase one or more properties to affordable housing which can
either be rented or partly owned. It includes specialist housing such as sheltered
accommodation for elderly or vulnerable people with specific needs. Housing also
takes account of the needs of migrant workers and includes residential and transit
sites for gypsies, travellers and travelling show people.

In defining the affordability of housing, the question of how much a household should
expect to spend on housing has no straightforward answer, as there is a degree of
personal choice involved. In choosing where one wants to live one person may choose
to have lower housing costs and spend more on commuting, while another may
choose the opposite. Households might also be willing to incur higher housing costs to
own a property rather than to rent because of the opportunity to accumulate an
investment – although rentingBN16 can be more expensive that owning. However, it is
also clear that, as the single largest expense for most households, high housing costs
can easily squeeze out other essentials for low to middle income families or force
families to live in overcrowded, poor quality conditions. There are a wide variety of
measures of affordability that are used which vary by tenure and what is considered
unaffordable fluctuates by area and over time depending on the state of the housing
market. For example, for home ownership, the ratio of the median house price to
annual gross median household income is a common measure, with prices three times
income or less being considered affordable. In the context of renting, rent as a
proportion of disposable income - household income after taxes and benefits - is

Version 1: November 2013                                                                1
Cornwall Local Plan: Housing Evidence Base

frequently used and can be used for all tenure types to assess on-going housing costs.
Thirty five per cent of disposable income spent on rent or other housing costs has
traditionally been seen as the upper limit of affordability in the UK. However, now that
the costs of housing are rising in some parts of the country and median household
incomes have been falling, the cost to income ratio that is considered affordable is
also starting to drift upwards. Several London housing organisations, for example, are
using 40 or 45 per cent cost to income ratio as affordableiii.

Affordability: there are a number of different indicators of housing affordability, and
the ratio of house prices to income is a key indicator of the relative affordability of
owner-occupation.

Affordability Ratio: the ratio of house prices to earnings is one measure of how
affordable it is to buy a property. The higher the ratio, the less affordable it is for
households to get onto the property ladder.

Note of Caution 1: It should be borne in mind that a significant proportion of households contain more
than one earner and consequently ratios based solely on individual earnings may overstate the extent of
affordability difficulties.

Overview
House prices changes over time are an indicator of the availability of housing –
generally a long term trend in house price increases indicates a shortage in housing
supply whereas a long term decrease in house prices indicates an over supply of
housing. Assessing affordability involves comparing house costs to the ability to pay
fro them. The ratio between lower quartile house prices and lower quartile
incomes/earnings is used to assess the relative affordabilityBN10 of housing and DCLGiv
provides this information.

High house prices and the difficulties of being able to afford a home in the private
sector (to buy or rent) have been an issue in Cornwall for some time. The cost of
housing has increased significantly but average earningsBN17 have remained fairly
stable.

Context
There are considerable negative implicationsBN6 of not providing enough housing
within a housing market area. These include amongst others house price rises and an
increase in unaffordability, and will also impact on the economy in terms of lack of
available housing supply constraining the ability of employers to attract the employees
they require.

This is not a new issue. Kate Barkerv in 2004 reported that the UK had experienced a
long-term upward trend in real house prices of around 2.4% per annum over the last
30 years. This created problems of affordability for some home buyers. In addition,
the volatility of the housing market has exacerbated problems of macroeconomic
instability which has had an adverse effect on economic growth. To improve
macroeconomic stability and deliver greater affordability a lower trend in house price
rise was considered necessary. It was recommended that a trend in real house prices
of 1.8% was more affordable but would require an additional 70,000 houses to be
delivered each year in England. The National Housing & Planning Advisory Unit
(NHPAU) was established in response to the pressing issue of housing affordability
highlighted by Kate Barker's Review. The NHPAU produced a figure for the South
West, and by applying the same proportion to Cornwall as for the Regional Spatial

Version 1: November 2013                                                                              2
Cornwall Local Plan: Housing Evidence Base

Strategy (RSS), the figure for Cornwall suggests a need for between 69,920 and
79,360 new dwellings over twenty years.

The National Housing & Planning Advisory Unit makes it very clear that the current
recession will have little impact on the number of homes required over the next
twenty years. ‘Recessions do not have a big impact on household growth but they do
cause a dip in house building. Homes ‘lost’ in that dip will need to be made good later
in the period.’

Given the fluidity of definitions of affordability, it is helpful to take a step back and
consider what affordability would look like using a measure that more directly
addresses the implications of housing costs for living standards. Do families have
enough income to pay for their housing costs as well as other essentials, such as
transport and food? Are housing costs eating up such a large proportion of income that
households have to cut back on other things that can be considered necessary as part
of achieving a basic standard of living? The cost of meeting a basic living standard is
calculated by the Minimum Income Standardvi (MIS). The MISBN17 quantifies the cost of
essentials that families themselves deem necessary to participate in society, including
food, drink, clothing, transport and healthcare but does not include luxuries. The table
below indicates what the average family type spends on housing as a proportion of
their income in England. This table particularly highlights the higher proportion of
income required to rent privatelyBN16 when compared to other tenures.

Housing cost to income ratios by family type and housing tenure for low to middle income
households
              Couple with    Couple with   Couple with       Couple with   Single with    Single with
              no children    1 child       2 children        3+ children   no children    children
Social
                   21%          21%               17%            16%           29%            22%
renter
Private
                   33%          28%               27%            26%           38%            32%
renter
Owns with
                   22%          23%               25%            22%           31%            24%
mortgage
Notes: Excludes those who own outright; Source:   Authors' analysis of DWP, Family Resources Survey
2010/11

Past House Prices & Affordability
Average house pricesvii in Cornwall became higher than the average for the South
West around 2004 and despite a drop in prices between 2007 and 2008 following the
onset of the recession they have remained at a high level as illustrated in the graph
below:

Version 1: November 2013                                                                                3
Cornwall Local Plan: Housing Evidence Base
Average House Price 1995 - 2013 (June)
£210,000
Cornwall
£190,000
South West
£170,000
£150,000
£130,000
£110,000
£90,000
£70,000
£50,000
1995 1996 1997 1998 1999 2000 2001 2002 2003 2004 2005 2006 2007 2008 2009 2010 2011 2012 2013
The ability to purchase housing by first time buyers has been monitored by the
Department for Communities & Local Governmentviii using Annual Survey of Hours and
EarningsBN17 data and Land Registry House Price data. The following graph clearly
shows the difficulty in purchasing an entry level house in Cornwall compared to the
average across the South West and England.
Ratio of Lower Quartile House Prices to Lower Quartile
Earnings
11
Cornwall
10
South West
9
England
Affordability ratio
8
7
6
5
4
3
2
P
7
98
99
0
01
02
03
4
05
06
07
8
09
10
R
9
0
0
0
2
1
9
9
9
0
0
0
0
0
0
0
0
0
0
0
1
1
1
1
1
2
2
2
2
2
2
2
2
2
2
2
0
0
2
2
Some information is available on private rentalBN16 costs and on average rents in
Cornwall are higher than the rents on average for England.
Version 1: November 2013 4Cornwall Local Plan: Housing Evidence Base
Current Levels of House Prices & Affordability
The latest average house priceix in Cornwall (June 2013) was £180,795 compared to
an average of £172,152 for the South West and £162,621 for England.
A fairly recent report ‘Home Truths South West’x stated that the average house price
in the South West in 2011 was £223,870, 11.5 times the average (median) regional
income of £19,484. House prices in the South West have increased three times faster
than incomes over the past 10 years. The average home in rural parts of the region
now costs nearly 13 times the average local income, compared to nearly 11 times in
more urban areas.
The recent SHMNABN2 for Cornwall was clear that affordability issues had not eased
across the local authorities due to the ongoing resilience in house prices, even at the
most affordable entry level (i.e. lower quartile) end of the property market. As a
result, in 2011 in Cornwall, a lower quartile house will cost circa 9.1 times the income
of a household earning the lower quartile salary, and this significantly exceeds the
national benchmark at a ratio of 6.5xi. The result is that many lower income
households will be priced out of entering the private housing market, unless they save
considerable deposits.
House price and rental data was used to undertake a benchmarking exercise to
understand the levels of income required for entry to different tenures in Cornwall,
and this analysis produced the following results. It is clear that with an average gross
annual income of around £22,000 many residents in Cornwall will struggle to access
anything other than social rented properties without considerable deposits.
Affordability Benchmarks – Annual Income Required
To purchase Private Private Social Social
LQ house Rented LQ 2 Rented 3 Rented 2 Rented 3
(3.5 times Bed Bed Bed Bed
income - Dwelling Dwelling Dwelling Dwelling
10% (25% (25% (25% (25%
deposit) income) income) income) income)
Cornwall £37,273 £25,680 £30,000 £15,451 £16,959
A new report, Home Truthsxii, is the first to give a comprehensive assessment of
where less affluent families can reasonably afford to live, revealing that even a very
modest rented home is beyond the reach of low income households in 33 per cent of
all local authority areas. This analysis for Cornwall does suggest that a couple with
one child on an income of £22,000 per year would have to spend:
• Between 25 and 35% of their income to afford a mortgage on a lower quartile 2
bed property;
• Between 25 and 35% of their income to privately rent a lower quartile 2 bed
property;
• Between 15 and 25% of their income to socially rent a lower quartile 2 bed
property.
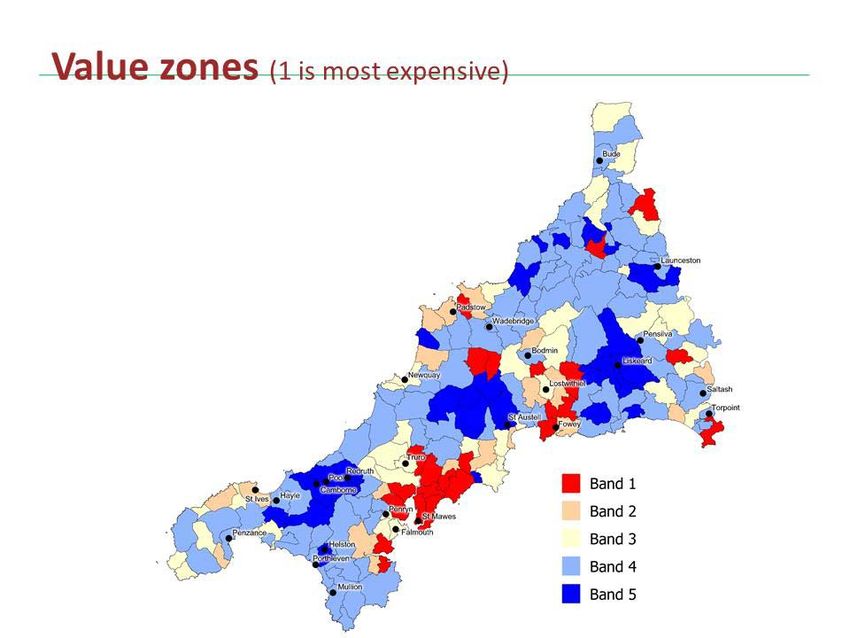
Workxiii undertaken for Cornwall Council on the viability of housing development
looked at a range of house price and build costs to assess different areas in Cornwall,
and this study divided Cornwall into the following ‘value zones’:
Version 1: November 2013 5Cornwall Local Plan: Housing Evidence Base Future House Prices & Affordability The current housing market is experiencing issues around supply as there are fewer homes for sale than at any time in the last five years. Low levels of new build and reluctance by existing homeowners to move is limiting availability while increased demand is taking up what stock there is to buyxiv. Further growth in demand, with no commensurate increase in supply, will simply push prices further ahead. A substantial supply response to reduce the pressure on prices looks unlikely at this time, and the shortage of housing for sale is most pronounced in London and parts of southern England where demand has improved the most. Neil McDonald is very clear in his presentation that if the supply of housing does not improve it is consideredxv likely that we will see more ‘boom and bust’ trends in the future if demand cannot be met. Cornwall has been deliveringBN8 a good supply of housing over the last few years and although the number of completions did dip due to the recession they have not fallen as significantly as elsewhere and a good supply of new homes is still being produced at this time. The Government’s ‘Help to Buy’xvi schemes offer financial help through a ‘Help to Buy’ home ownership scheme for those who live in England and can’t afford to buy a home and this is encouraging builders to use these types of schemes successfully on their developments. There are four types of help to buy schemes: • Help to Buy equity loans are open to both first-time buyers and home movers on new-build homes worth up to £600,000; • Shared ownership schemes are provided through housing associations – an owner would buy a share of their home (between 25% and 75% of the home’s value) and Version 1: November 2013 6
Cornwall Local Plan: Housing Evidence Base

  pay rent on the remaining share. The owner would need to take out a mortgage to
  pay for their share of the home’s purchase price and shared ownership properties
  are always leasehold;
• NewBuy lets potential home owners buy a newly built home with a deposit of only
  5% of the purchase price;
• Help to Buy mortgage guarantee helps you buy a home with a deposit of 5% of the
  purchase price and this guarantee is provided to the lender.

Risk Assessment
House prices and the affordability of housing is out of the control of planning in the
main as it is only ‘affordable’ housing for sale that is constrained in terms of pricing.
Planning can play a role in helping to keep house prices stable by ensuring that there
is a good supply of houses coming forward and by maximising the delivery of
affordable homes.

This analysis of house prices and affordability does not fully take into account the
impact of the Government’s programme of Welfare ReformsBN22 which may have a
knock on effect on many households’ abilities to access housing.

Examination Findings
No examination findings specifically relating to house prices and affordability have
been identified to date.

Use in Cornwall Local Plan
A number of studies have been used as the evidence base to support the development
of affordable housing policies in the Local Plan and these specifically use house prices
and affordability analysis including:
• The ‘Cornwall Strategic Housing Market Evidence Basexvii’ (2010) accompanied the
   Core Strategy Options Report and ‘Our Preferred Approach for a Core Strategy’ -
   http://www.cornwall.gov.uk/Default.aspx?page=17559
• Emerging work from the ‘Cornwall Strategic Housing Market Needs Assessment’
   (July 2013) which is part of the wider Plymouth City Council, South Hams District
   Council, West Devon Borough Council, Dartmoor National Park and Cornwall Council
   Strategic Housing Market Needs Assessment informed the Cornwall Local Plan
   Strategic Policies Pre Submission Version -
   http://www.cornwall.gov.uk/Default.aspx?page=33218

House prices and affordability are part of the context for housing and as such are
included in general housing papers including:
• Housing Topic Paper (February 2011) accompanied the Core Strategy Options
   Report - http://www.cornwall.gov.uk/Default.aspx?page=32790
• Housing Topic Paper (January 2012) accompanied ‘Our Preferred Approach for a
   Core Strategy’ - http://www.cornwall.gov.uk/Default.aspx?page=32791

Accompanying Briefing Notes:
BN2 – The Housing Market & Strategic Housing Market Needs Assessments
BN6 – Why do we need to build more houses? What are the consequences of building
too many or too few new homes?
BN8 – Deliverability & the Strategic Housing Land Availability Assessment
BN16 – Private Rented Sector
BN17 – Income & Earnings
BN22 – Welfare Reform

Version 1: November 2013                                                                    7
Cornwall Local Plan: Housing Evidence Base

Further Information
1. The Department for Communities and Local Government (DCLG) monitor a
   measure of affordability for people wanting to enter the housing market by
   comparing lower quartile house prices with lower quartile individual fulltime
   earnings (excl. bonuses).
   https://www.gov.uk/government/statistical-data-sets/live-tables-on-housing-
   market-and-house-prices
2. The Nationwide ratio of average house prices to first time buyers’ average
   individual earnings
   http://www.nationwide.co.uk/hpi/downloads/FTB_HPER.xls
3. The Halifax ratio of average house prices to all house buyers average individual
      earnings
   http://www.lloydsbankinggroup.com/media/excel/2012/HPI_Quarterly/Affordability
   Q12012.xls
4. Home Truths South West 2012: National Housing Federation - a report by the
   National Housing Federation is an analysis and forecast of South West’s housing
   market. Thousands of people across the South West could be left fighting for a
   home they can afford as the region faces a massive shortage of new housing.
   http://www.housing.org.uk/publications/find_a_publication/general/home_truths_
   2012_south_west.aspx
5. The Human Cost: Shelter - the high cost of housing is one of the most pressing
   issues facing Britain today. Spiralling house prices and a dysfunctional housing
   system has meant that for years, the amount that we have had to pay to meet our
   housing needs has escalated. As a result, for a growing number of people, finding
   a suitable home they can afford has become increasingly difficult.
   http://england.shelter.org.uk/professional_resources/policy_and_research/policy_li
   brary/policy_library_folder/the_human_cost_-
   _how_the_lack_of_affordable_housing_impacts_on_all_aspects_of_life

i
 DCLG (2007) Strategic Housing Market Assessments Practice Guidance -
https://www.gov.uk/government/publications/strategic-housing-market-assessments-practice-
guidance
ii
 DCLG (2013) Assessment of Housing and Economic Development Needs -
http://planningguidance.planningportal.gov.uk/blog/guidance/assessment-of-housing-and-
economic-development-needs/what-is-the-purpose-of-the-assessment-of-housing-and-
economic-development-needs-guidance/
iii
  Resolution Foundation (2013) Home Truths: how affordable is housing for Britain’s ordinary
working families - http://www.resolutionfoundation.org/publications/home-truths-how-
affordable-housing-britains-ordina/
iv
  DCLG (2013) Table 576: ratio of lower quartile house prices to lower quartile earnings by
district from 1997 - https://www.gov.uk/government/statistical-data-sets/live-tables-on-
housing-market-and-house-prices
v
  Kate Barker (2004) Delivering Stability: securing our future housing needs -
http://webarchive.nationalarchives.gov.uk/+/http:/www.hm-
treasury.gov.uk/barker_review_of_housing_supply_recommendations.htm
vi
  Resolution Foundation (2013) Home Truths: how affordable is housing for Britain’s ordinary
working families - http://www.resolutionfoundation.org/publications/home-truths-how-
affordable-housing-britains-ordina/

Version 1: November 2013                                                                       8
Cornwall Local Plan: Housing Evidence Base vii Land Registry (various) House Price Index - http://www.landregistry.gov.uk/public/house- prices-and-sales viii DCLG (2013) Table 576: ratio of lower quartile house prices to lower quartile earnings by district from 1997 - https://www.gov.uk/government/statistical-data-sets/live-tables-on- housing-market-and-house-prices ix Land Registry (2013) House Price Index - http://www.landregistry.gov.uk/public/house- prices-and-sales x National Housing Federation (2012) Home Truths South West - http://www.housing.org.uk/publications/find_a_publication/general/home_truths_2012_south _west.aspx xi GVA/Edge Analytics (2013) Strategic Housing Market Needs Assessment Main Report: Plymouth City Council, South Hams District Council, West Devon Borough Council, Cornwall Council and Dartmoor National Park xii Resolution Foundation (2013) Home Truths: how affordable is housing for Britain’s ordinary working families - http://www.resolutionfoundation.org/publications/home-truths-how- affordable-housing-britains-ordina/ xiii ORS/Three Dragons (2012) Housing Strategic Viability Assessment - http://www.cornwall.gov.uk/default.aspx?page=33997 xiv Hometrack (2013) Pressure on house prices set to remain in near future - http://www.hometrack.co.uk/our-insight/commentary-and-analysis/pressure-on-house-prices- set-to-remain-in-near-term xv Neil McDonald (2013) How do we get to 250,000 homes a year? – http://www.cih.org/resources/PDF/Marketing%20PDFs/Presentations/housing2013/Neil%20Mc Donald%20How%20do%20we%20get%20to%20250000%20homes.pdf xvi DCLG (2013) Help to Buy Home Ownership Schemes - https://www.gov.uk/affordable- home-ownership-schemes xvii Peter Smith Research & Consulting (2010) The Cornwall Housing Market Strategic Evidence Base - http://www.cornwall.gov.uk/Default.aspx?page=17559 Version 1: November 2013 9
You can also read