Investor Presentation - Second Quarter 2021

Page created by Anna Austin
 
CONTINUE READING
Investor Presentation - Second Quarter 2021
Investor Presentation
Second Quarter 2021
Investor Presentation - Second Quarter 2021
Q2 2021
         Highlights                                                                  Absorption Pace    Average Order Price

          •     Home closings gross margin improved 370 basis points to 19.1%,
                ahead of prior guidance due to strong pricing trends.
                                                                                     +23%               +32%
                                                                                     to 3.4             to $597,000
          •     Managed sales via pricing and limited releases to align with
                production capacity and maximize gross margin opportunity while
                delivering record backlog of sold homes amid supply constraints.
                                                                                     Backlog            Total Revenue
          •     Disciplined approach to managing sales, controlling costs and
                accelerating production is expected to drive significant growth in
                2H21 home closing deliveries and gross margin.                       +50%               +13%
          •     Based on strength of backlog and confidence in operational           to 10,228          to $1.7 Billion
                enhancements and synergies, home closings gross margin
                expected to improve to approximately 22 percent in 2022.

          •     Repurchased 3.8 million shares outstanding for $107 million,
                                                                                     Total Lot Supply   Diluted EPS
                bringing 1H21 total to $145 million.

          •     Remain on track to reduce net debt-to-capital ratio to the low-30
                percent range by year-end and lower in 2022.
                                                                                     +13%               +90%
                                                                                     to 76,000          to $0.95

2   Note: Comparisons to the prior-year quarter, unless noted.
Investor Presentation - Second Quarter 2021
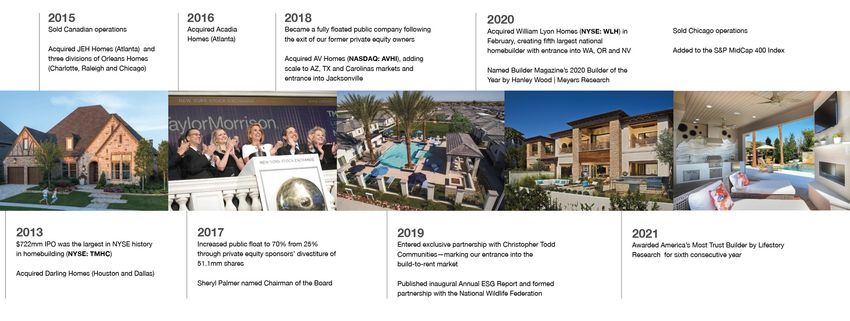
Management’s Outlook for Select Financial Metrics

                                        Third Quarter 2021   Full Year 2021

      Average Active Community Count    330 to 335           330 to 335

      Home Closings                     3,300 to 3,500       14,500 to 15,000

      GAAP Home Closings Gross Margin   About 20 Percent     High-19 to 20 Percent Range

      SG&A % of Home Closings Revenue   Not Provided         Mid-9 Percent Range

      Effective Tax Rate                ~23.5 Percent        ~23 Percent

      Diluted Share Count               ~128 Million         ~129 Million

      Land & Development Spend          Not Provided         ~$2 Billion

3
Investor Presentation - Second Quarter 2021
Strong Gross Margin and ROE Accretion Expected in 2022

         Home Closings Gross Margin                                                                                                 Return on Equity
                                                                                                          ~22%                                                                                                            Over 20%
                                                                                             High-19%
                                                                                              to 20%
                                                                19.1%
                                           18.3% 18.6%                                                                                                                                                            High-Teens
                                                                                                                                                                                                                    Range
                                17.2%
                                                                                     16.6%
           15.4% 15.4%

                                                                                                                                                                                        12.2%

                                                                                                                                                                              10.5%

                                                                                                                                                                    7.9%                                      7.9%
                                                                                                                                                          6.8%
                                                                                                                                     5.9%
                                                                                                                                               5.4%

            1Q20      2Q20       3Q20      4Q20       1Q21      2Q21                 2020       2021   2022                         1Q20       2Q20      3Q20       4Q20      1Q21       2Q21                 2020   2021   2022
                                                                                                Guidance                                                                                                               Guidance

    Note: (1) 2020 includes impact from acquisition of William Lyon Homes; (2) ROE calculated as trailing twelve-month net income divided by average stockholder’s equity in the current and prior-year period.
4
Investor Presentation - Second Quarter 2021
Focused on Leveraging Enhanced Scale to Create Value

    Balanced National
                              Critical Local      Gross Margin                  Asset                 Overhead
    Footprint in Strong
                             Operating Scale      Enhancement                 Efficiency              Leverage
     Housing Markets

        Deep and            Experienced Team                                                           Expanding
                                                  Balance Sheet           Return-Accretive
    Diversified Product       and Effective                                                           Build-to-Rent
                                                    Efficiency            Land Investments
    and Price Point Mix     Operating Structure                                                        Business

                 Platform Achieved                                Operational Excellence Strategies

5
Investor Presentation - Second Quarter 2021
Strategic Priorities Aligned to Enhance Results
    Operational Excellence                                                 Capital Efficiency

    Gross Margin Enhancement                                               Return-Accretive Land Investments
    •  Maximize Procurement with Natl. and Local Purchasing Capabilities   •  Expand Controlled Lot Share to at Least 40% by the End of 2021
    •  Streamline Operations with Plan and Option Rationalization          •  New Land Financing Vehicles Improve Efficiency and Reduce Risk
    •  Expand New Design Package Program (“Canvas”)                        •  Maintain Disciplined Underwriting
    •   Optimize Strategic Selling Practices to Balance Price and Pace     •   Enhance Existing Local Market Share

    Asset Efficiency                                                       Balance Sheet Efficiency
    •  Streamline Production Processes                                     •   Reduce Leverage Assumed in M&A
    •  Cycle Time Reduction and Controls                                   •   Pursue Asset-Light Investment Strategies
    •   Spec Home Inventory Management                                     •   Opportunistic Share Repurchases

    Overhead Leverage                                                      Strong Cash Flow Generation
    •  Scale Benefits                                                      •   Expect $600M+ Annual Operating Cash Flow, Driven by Earnings
    •  Consumer-Centric Technological Innovation                           •   Top Priority is Organic Reinvestment
    •  Updated Realtor Program                                             •   Allocate Capital to Drive Long-Term Value Creation
    •   Centralization of Key Functions

6
Investor Presentation - Second Quarter 2021
Our Unique Design
    Package Approach

    • Canvas packages are thoughtfully curated to offer
      homebuyers an improved, easier design experience
      than the traditional design center approach
    • Package collections—which are available at five budget
      levels—include features with the highest design appeal
      at a compelling value
    • By streamlining option offerings, Taylor Morrison is
      better able to manage supplier relationships to ensure
      timely product availability and cost leverage—driving
      expected gross margin and cycle time improvement
    • Now available in all markets, Canvas has recently
      become the template for all spec homes and most
      model homes going forward, and is expected to expand
      to our to-be-built homes, especially among entry-level
      and first move-up buyers

7
Investor Presentation - Second Quarter 2021
Healthy Demand Trends Driving Strong Pace and Price
     Monthly Absorption Pace per Community                                                                       Average Community Count

                             4.3
                                                                                                                          East           Central          West

                                                                                                                                                                                      411

                                                                                                                                                                                             393
                                                                                 3.8

                                                                                                                                                                               378
                                                                                                                                                   372

                                                                                                                                                                                                    368
                                                                                                                                       366

                                                                                                                                                          357

                                                                                                                                                                 346

                                                                                                                                                                                                           345
                                                            3.4

                                                                                                                                                                        333

                                                                                                                                                                                                                  332
                                                                                                      3.4
                      3.1

                                                                                                                         297
                                                                                                                  288

                                                                                                                                275
        2.8

                                                     2.8
                                       2.6

                                              2.6

                                                                                               2.6
                                                                          2.4
               2.3

                                                                   2.2

                                                                                        1.6

                                                                                                      4Q20
        1Q18

               1Q19

                      1Q20

                             1Q21

                                       2Q18

                                              2Q19

                                                     2Q20

                                                            2Q21

                                                                   3Q18

                                                                          3Q19

                                                                                 3Q20

                                                                                        4Q18

                                                                                               4Q19

                                                                                                                  1Q18

                                                                                                                                3Q18
                                                                                                                         2Q18

                                                                                                                                       4Q18

                                                                                                                                                   1Q19

                                                                                                                                                          2Q19

                                                                                                                                                                 3Q19

                                                                                                                                                                        4Q19

                                                                                                                                                                               1Q20

                                                                                                                                                                                      2Q20

                                                                                                                                                                                             3Q20

                                                                                                                                                                                                    4Q20

                                                                                                                                                                                                           1Q21

                                                                                                                                                                                                                  2Q21
                               Average Order Price                                                    Absorption Pace                                            Sold Homes in Backlog
                               +32% to $597,000                                                       +23% to 3.4                                                +50% to 10,228
8   Note: Comparisons to the prior-year quarter.
Investor Presentation - Second Quarter 2021
Diverse Product Portfolio Serves All Major Buyer Groups
    Net Sales Orders by Consumer Type in 2Q 2021

                                                     Entry Level
                      25%
                                     32%

                                                     Move Up

                                                     50-Plus Lifestyle
                            43%

    Average Net Sales Order Price (in Thousands)

                                                                   $597

                                                   $550
                                           $527

                              $490
        $467
                   $453

        1Q20       2Q20       3Q20         4Q20    1Q21         2Q21

9
Investor Presentation - Second Quarter 2021
Mix as of Q2 2021        West      Central      East
     Balanced Market Footprint   Closings                  38%        24%        38%
     Across 11 States
                                 Closings Revenue          43%        23%        34%

                                 Average Closing Price   $567,000   $484,000   $452,000

                                 Lot Supply                36%        32%        32%

10
Disciplined Approach                                                   Years of Homebuilding Lots Based on Trailing Twelve-Month Closings
     to Land Portfolio                                                                          Total                Owned
                                                                                                                                                6.0

     Management                                                                 5.2
                                                                                                                                       5.5

                                                                                                               5.0            4.9
                                                                                                4.7

                                                                                3.8                                                    3.8      3.9
                                                                                                               3.7            3.8

     Q2 2021 Highlights                                                                         3.2

     •   Recently finalized new land financing vehicles that will improve
         capital efficiency of land portfolio and help achieve targeted
                                                                                2016           2017           2018           2019     2020     2Q21
         controlled share of at least 40 percent in 2022

                                                                            Homebuilding Lots Owned and Controlled (Units in Thousands)
     •   Invested $451 million in land acquisition and development in 2Q;
         $1.0 billion in 1H21                                                                                                                  76,000
                                                                                       Owned            Controlled                    70,000
            •   Targeting $2.0 billion in 2021

     •   Approximately 76,000 total lots owned and controlled                                                 52,000
                                                                                                                             49,000
            •   6.0 years of total supply
            •   3.9 years of owned supply                                      38,300          38,000

     •   35 percent of total lots controlled
            •   Up from 28 percent a year ago

                                                                                2016           2017            2018          2019     2020     2Q21
11
Strong Cash Flow                                                        Net Debt-to-Capital Ratio Expected to Fall to Low-30% Range in 4Q21

     Expected to Drive                                                         46.8%       46.0%

     Further Deleveraging                                                                             41.6%
                                                                                                                   38.7%
                                                                                                                             40.1%         40.5%

                                                                                                                                                            Low-30%
                                                                                                                                                             Range

     Q2 2021 Highlights

     •   Net debt-to-capital ratio expected to decline to the low-30
         percent range by the end of 2021                                       1Q20        2Q20       3Q20        4Q20          1Q21      2Q21             4Q21E
            •   Further reduction anticipated in 2022
                                                                             Liquidity Summary as of June 30, 2021 (in Millions)
     •   5.8% average interest rate on $2.5 billion of senior notes
                                                                                       Revolving Credit Facility           Loans Payable            Senior Notes
     •   $1.1 billion total available liquidity                                $1,100
                                                                                                                       $800
            •   $366 million unrestricted cash
                                                                                                                                             $828
            •   $755 million undrawn credit facility

     •   Repurchased 3.8 million of shares outstanding for $107 million in                                    $461                                   $450
                                                                                                                                                              $500
         Q2, bringing 1H21 total to $145 million                                                                       $368

                                                                                          $132      $115
                                                                                                                                    $12

                                                                              Liquidity   2021      2022      2023        2024      2025     2027    2028     2030
12
Guided by a Balanced Capital Allocation Philosophy

                                                        Allocate Capital for Long-Term
                                                                Value Creation

                                                        We aim to enhance the long-term
                                                             value of our company by
                                                        allocating capital with a balanced
                                                            and disciplined approach

     Balance Sheet Stewardship          Reinvest in the Business                 Return Excess Cash to              Evaluate Growth
                                                                                     Shareholders                    Opportunities
      Manage balance sheet to           Disciplined due diligence for
     maintain strong liquidity and   investments in core homebuilding        Since 2015, spent nearly $795M         Increase scale and
     reduce leverage to targeted      operations and growing build-to-        to opportunistically repurchase     diversification through
                range                 rent business to drive profitable      33% of shares outstanding at an    accretive transactions and
                                       growth through a housing cycle         average price of approximately          organic growth
                                                                                          $20.50

13
A Snapshot of Capital Deployment Over the Last Three Years

$1.7B
  generated through
                                            $3.7B     invested
                                                                                                        $1.4B
                                                                                                        cash and equity invested
  operating cash flow                        in land and development                                            in M&A

$600M
reduction in senior notes and
                                         $600M
                                          spent on share repurchases
                                                                                                          27%
                                                                                                         of shares repurchased
   revolving credit facility

                                Note: Data reflects aggregate annual totals from 2018, 2019 and 2020.
Financial Services

     Q2 2021 Highlights

     Borrower Snapshot             Unit Product Mix             Suite of Services               Benefits

     • 750 Average FICO Score      • 80% Conventional           • Mortgage Lending              • Pre-Qualification of Nearly All Buyers
     • 80% Average LTV Ratio       • 19% Government             • Title Insurance               • Valuable Backlog Management
     • $390,000 Loan Amount        • 1% Jumbo                   • Homeowners’ Insurance         • Enhanced Customer Experience
     • 39% First-Time Homebuyers                                • Joint Venture Platform        • Servicing Platform Flexibility
                                                                                                • Positive Financial Contribution

     Capture Rate                  Financial Performance
                 85%     84%
                                   • $37 Million Revenue
        81%                                                                                     Borrower qualification-improvement
                                                                Integrated digital technology
                                   • $11 Million Gross Profit                                   program provides meaningful
                                                                simplifies the mortgage
                                   • 30.6% Gross Margin         process for borrowers and       improvement in credit worthiness
                                                                streamlines operations          and homebuyer education

        2Q20    1Q21     2Q21

15
Appendix
Who We Are

     Headquartered in Scottsdale, Arizona, Taylor Morrison is the
     nation’s fifth largest homebuilder and developer with operations in
     many of the highest-growth housing markets across 11 states.

     We serve a wide array of homebuyers with our diverse product
     portfolio, including first-time, move-up, luxury and 50-plus active
     lifestyle consumers.

     Our Financial Services segment provides mortgage financing, title
     services and homeowners’ insurance. We also operate a growing
     Build-to-Rent business in partnership with Christopher Todd
     Communities to develop innovative, luxury rental communities.

     From 2016-2021, Taylor Morrison has been recognized as
     America’s Most Trusted® Builder by Lifestory Research.

     Our strong commitment to sustainability, our communities and our
     team is highlighted in our latest annual Environmental, Social and
     Governance (ESG) Report.

17
Committed to Environmental, Social and Governance Values

     People First                        Building for the Future                            Transparency and Accountability
     2,700+                              100 percent                                        6 years
     team members                                                        ®
                                         homes now offer TM LiveWell upgraded products      America’s Most Trusted® Homebuilder award

     7 of 8                              3,700+                                             100 percent
     of team members are enthusiastic    acres of protected wildlife habitat certified by   of employees certified to our health and safety
     about working for Taylor Morrison   the National Wildlife Federation to date           standards

     46 percent                          30,400+                                            31,700+
     women team members                  ENERGY STAR ® certified appliances installed       hours of employee training

     44 percent                          63                                                 10
     women Board of Directors                             ®
                                         Average HERS energy efficiency index score         U.N. Sustainable Development Goals that align
                                                                                            with our impact

18      Note: Data as of 2020.
A Strategic Journey to Become a Leading Homebuilder

19
Significant Growth Evident Across Key Metrics
      Home Closings                                                      Total Revenue ($ in Billions)
                                                                12,524                                                        $6.1

                                                        9,964                                                          $4.8
                                                8,760                                                           $4.2
                                        8,032                                                            $3.9
                                7,369                                                             $3.6
                        6,311                                                              $3.0
                5,642                                                               $2.7
        4,716                                                               $2.3

         2013   2014    2015    2016    2017    2018    2019    2020        2013    2014   2015   2016   2017   2018   2019   2020

      Gross Profit ($ in Millions)                                       Stockholders’ Equity ($ in Billions)
                                                                $1,044                                                        $3.6

                                                         $824                                                          $2.5
                                         $739    $738                                                    $2.3   $2.4
                                 $680                                                             $2.2
                                                                                           $2.0
                                                                                    $1.8
                 $566    $568                                                $1.5

         $416

         2013    2014    2015    2016    2017    2018    2019    2020        2013   2014   2015   2016   2017   2018   2019   2020

20
Historical Operating Data by Region
                                           FY 2018   Q1 2019   Q2 2019   Q3 2019   Q4 2019   FY 2019   Q1 2020   Q2 2020   Q3 2020   Q4 2020   FY 2020   Q1 2021   Q2 2021
     Average Active Selling Communities
     East                                   134       173       161       153       152       159       144       153       145       139       145       129       126
     Central                                121       140       137       135       124       134       134       132       122       113       124       106       101
     West                                    52        59        59        58        57        58       100       126       126       116       117       110       105
     TMHC                                   307       372       357       346       333       351       378       411       393       368       386       345       332
     Net Sales Orders
     East                                  3,471     1,135     1,315     1,161     1,282      4,893    1,361     1,176     1,548     1,384      5,469    1,777     1,302
     Central                               2,697      801       820       759       639       3,019     906      1,003     1,133      824       3,866    1,072      850
     West                                  2,232      679       675       620       631       2,605    1,199     1,274     1,744     1,516      5,733    1,643     1,270
     TMHC                                  8,400     2,615     2,810     2,540     2,552     10,517    3,466     3,453     4,425     3,724     15,068    4,492     3,422
     Homes Closed
     East                                  4,061      854      1,180     1,029     1,652     4,715      985      1,097     1,216     1,152      4,450    1,052     1,245
     Central                               2,380      545       746       653       840      2,784      819      1,059      913       757       3,548     691       791
     West                                  2,319      539       668       614       644      2,465      957      1,056     1,340     1,173      4,526    1,078     1,232
     TMHC                                  8,760     1,938     2,594     2,296     3,136     9,964     2,761     3,212     3,469     3,082     12,524    2,821     3,268
     Home Closings Revenue (in Millions)
     East                                  $1,643     $348      $476      $434      $653     $1,912     $396      $467      $499      $494     $1,857     $446      $563
     Central                               $1,126     $253      $362      $310      $403     $1,327     $373      $474      $424      $349     $1,619     $320      $383
     West                                  $1,346     $299      $394      $329      $362     $1,384     $496      $530      $718      $644     $2,388     $597      $698
     TMHC                                  $4,115     $900     $1,232    $1,073    $1,418    $4,623    $1,265    $1,471    $1,641    $1,487    $5,864    $1,363    $1,644
     Home Closings Gross Margin
     East                                  17.0%     17.1%     16.0%     17.1%     16.0%     16.5%     15.6%     16.7%     17.8%     18.3%     17.2%     18.8%     20.6%
     Central                               14.0%     16.4%     17.1%     18.2%      6.4%     14.0%     17.1%     17.6%     20.4%     20.6%     18.9%     20.2%     18.5%
     West                                  19.9%     21.1%     21.4%     20.8%     19.6%     20.7%     13.9%     12.3%     14.9%     17.1%     14.7%     17.5%     18.1%
     TMHC                                  17.1%     18.2%     18.0%     18.5%     14.2%     17.0%     15.4%     15.4%     17.2%     18.3%     16.6%     18.6%     19.1%
     Sales Order Backlog
     East                                  1,638     1,919     2,054     2,186     1,816     1,816     2,193     2,271     2,603     2,835     2,835      3,560     3,617
     Central                               1,420     1,676     1,750     1,856     1,655     1,655     2,167     2,111     2,331     2,398     2,398      2,779     2,838
     West                                  1,100     1,240     1,247     1,253     1,240     1,240     2,205     2,423     2,827     3,170     3,170      3,735     3,773
     TMHC                                  4,158     4,835     5,051     5,295     4,711     4,711     6,565     6,805     7,761     8,403     8,403     10,074    10,228
     Backlog Value (in Millions)
     East                                   $725      $849      $907      $935      $791      $791      $957      $975     $1,158    $1,320    $1,320    $1,753    $1,903
     Central                                $732      $850      $886      $937      $839      $839     $1,042    $1,006    $1,120    $1,200    $1,200    $1,463    $1,582
     West                                   $623      $694      $660      $662      $644      $644     $1,132    $1,245    $1,474    $1,707    $1,707    $2,120    $2,251
     TMHC                                  $2,080    $2,392    $2,453    $2,535    $2,275    $2,275    $3,132    $3,226    $3,752    $4,227    $4,227    $5,337    $5,736

21
Reconciliation of Non-GAAP Measures
                                                                                                Net Homebuilding Debt to Capitalization Ratio Reconciliation
                                                                                                                          As of
     ($ in thousands)                                  June 30, 2021             March 31, 2021       December 31, 2020       September 30, 2020           June 30, 2020        March 31, 2020
     Total Debt                                      $       3,082,648       $          3,025,587     $        2,928,395      $          3,180,072      $        3,769,740    $        3,700,368
     Less amortized debt issuance premiums, net                   2,344                     2,354                  2,365                     2,526                   23,832               25,187
     Less mortgage warehouse borrowings                        215,230                    180,833                127,289                   109,593                 149,784               154,109
     Total homebuilding debt                         $       2,865,074       $          2,842,400     $        2,798,741      $          3,067,953      $        3,596,124    $        3,521,072
     Less cash and cash equivalents                            366,267                    392,500                532,843                   547,916                 674,685               507,761
     Net homebuilding debt                           $       2,498,807       $          2,449,900     $        2,265,898      $          2,520,037      $        2,921,439    $        3,013,311
     Total equity                                            3,668,849                  3,655,564              3,593,750                 3,542,135               3,424,740             3,423,041
     Total capitalization                            $       6,167,656       $          6,105,464     $        5,859,648      $          6,062,172      $        6,346,179    $        6,436,352

     Net homebuilding debt to capitalization ratio                40.5%                     40.1%                   38.7%                    41.6%                   46.0%                  46.8%

     In addition to the results reported in accordance with accounting principles generally accepted in the United States (“GAAP”), we have provided information in this Investor Presentation
     relating to net homebuilding debt to capitalization ratio. Net homebuilding debt to capitalization ratio is a non-GAAP financial measure we calculate by dividing (i) total debt, less unamortized
     debt issuance costs/premiums and mortgage warehouse borrowings, net of unrestricted cash and cash equivalents, by (ii) total capitalization (the sum of net homebuilding debt and total
     stockholders’ equity).

     Management uses non-GAAP financial measures to evaluate our performance on a consolidated basis, as well as the performance of our regions, and to set targets for performance-based
     compensation. We also use the ratio of net homebuilding debt to total capitalization as an indicator of overall leverage and to evaluate our performance against other companies in the
     homebuilding industry. A reconciliation of our forward-looking net homebuilding debt to capitalization ratio to the most directly comparable GAAP financial measure cannot be provided
     without unreasonable effort because of the inherent difficulty of accurately forecasting the occurrence and financial impact of the adjusting items necessary for such reconciliation that have
     not yet occurred, are out of our control, or cannot be reasonably predicted. In the future, we may include additional adjustments in the above-described non-GAAP financial measures to the
     extent we deem them appropriate and useful to management and investors.

     Because we use the ratio of net homebuilding debt to total capitalization to evaluate our performance against other companies in the homebuilding industry, we believe this measure is also
     relevant and useful to investors for that reason. These non-GAAP financial measures should be considered in addition to, rather than as a substitute for, the comparable U.S. GAAP financial
     measures of our operating performance or liquidity. Although other companies in the homebuilding industry may report similar information, their definitions may differ. We urge investors to
     understand the methods used by other companies to calculate similarly-titled non-GAAP financial measures before comparing their measures to ours.

22
Forward-Looking Statements
     This earnings summary includes “forward-looking statements.” These statements are subject to a number of risks, uncertainties and other factors that could cause our
     actual results, performance, prospects or opportunities, as well as those of the markets we serve or intend to serve, to differ materially from those expressed in, or
     implied by, these statements. You can identify these statements by the fact that they do not relate to matters of a strictly factual or historical nature and generally discuss
     or relate to forecasts, estimates or other expectations regarding future events. Generally, the words “believe,” “expect,” “intend,” “estimate,” “anticipate,” “project,” “may,”
     “can,” “could,” “might,” “will” and similar expressions identify forward-looking statements, including statements related to expected financial, operating and performance
     results, planned transactions, planned objectives of management, future developments or conditions in the industries in which we participate and other trends,
     developments and uncertainties that may affect our business in the future.

     Such risks, uncertainties and other factors include, among other things: the scale and scope of the recent COVID-19 (coronavirus) outbreak and resulting pandemic;
     changes in general and local economic conditions; slowdowns or severe downturns in the housing market; homebuyers’ ability to obtain suitable financing; increases in
     interest rates, taxes or government fees; shortages in, disruptions of and cost of labor; higher cancellation rates of existing agreements of sale; competition in our
     industry; any increase in unemployment or underemployment; inflation or deflation; the seasonality of our business; our ability to obtain additional performance, payment
     and completion surety bonds and letters of credit; significant home warranty and construction defect claims; our reliance on subcontractors; failure to manage land
     acquisitions, inventory and development and construction processes; availability of land and lots at competitive prices; decreases in the market value of our land
     inventory; new or changing government regulations and legal challenges; our compliance with environmental laws and regulations regarding climate change; our ability
     to sell mortgages we originate and claims on loans sold to third parties; governmental regulation applicable to our financial services and title services business; the loss
     of any of our important commercial lender relationships; our ability to use deferred tax assets; raw materials and building supply shortages and price fluctuations; our
     concentration of significant operations in certain geographic areas; risks associated with our unconsolidated joint venture arrangements; information technology failures
     and data security breaches; costs to engage in and the success of future growth or expansion of our operations or acquisitions or disposals of businesses; costs
     associated with our defined benefit and defined contribution pension schemes; damages associated with any major health and safety incident; our ownership, leasing or
     occupation of land and the use of hazardous materials; existing or future litigation, arbitration or other claims; negative publicity or poor relations with the residents of our
     communities; failure to recruit, retain and develop highly skilled, competent people; utility and resource shortages or rate fluctuations; constriction of the capital markets;
     risks related to our substantial debt and the agreements governing such debt, including restrictive covenants contained in such agreements; our ability to access the
     capital markets; the risks associated with maintaining effective internal controls over financial reporting; provisions in our charter and bylaws that may delay or prevent
     an acquisition by a third party; and our ability to effectively manage our expanded operations.

     In addition, other such risks and uncertainties may be found in our most recent annual report on Form 10-K and our quarterly reports on Form 10-Q filed with the
     Securities and Exchange Commission (SEC) as such factors may be updated from time to time in our periodic filings with the SEC. We undertake no duty to update any
     forward-looking statement, whether as a result of new information, future events or changes in our expectations, except as required by applicable law.

23
You can also read