Asia-Pacific Markets Monthly - S&P Global
←
→
Page content transcription
If your browser does not render page correctly, please read the page content below

August 2020

Asia-Pacific
Markets Monthly
Highlights and Insights from S&P Global Market Intelligence

                                                              Copyright © 2020 by S&P Global Market Intelligence, a division of S&P Global Inc. All rights reserved.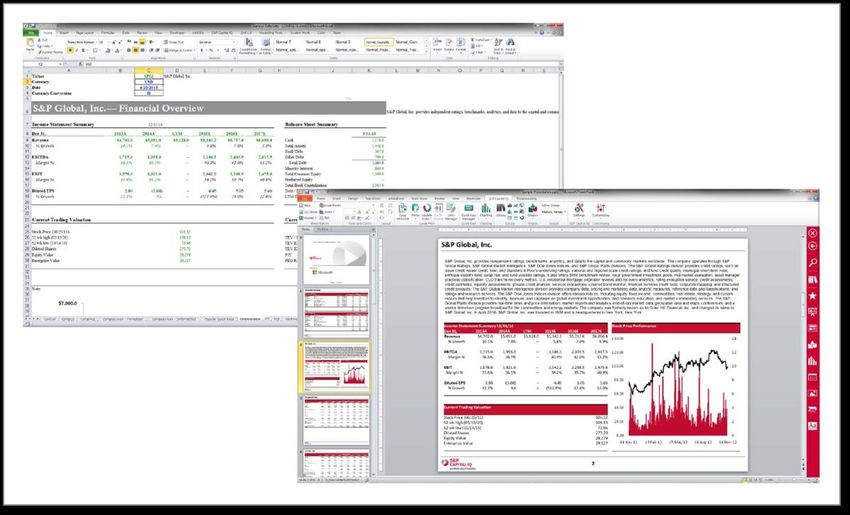
Table of Contents
    Content By S&P Global Market Intelligence:
               P.3        Greater China Q2 2020 M&A Summary
               P.4        Japan Q2 2020 M&A Summary
               P.5        Australia Q2 2020 M&A Summary
               P.6        China's Shadow Banking Likely To Stay In Contraction As Lenders Get Cautious
               P.7        COVID-19 Turns Indonesian Ore Export Ban Into Curse For Nickel Market
               P.8        China 2020 Survey Summary: COVID-19 Crisis Accelerated Media And Tech Trends
               P. 9-10    Credit Risk Trends For Asia
               P. 12-14 M&A Activity By Country, Sector
               P.15       Initial Public Offerings
               P.16       Private Equity Investments & Buyouts
               P.17       Venture Capital Investments

    Content By S&P Global Ratings:
               P.19       The ESG Pulse: Social Factors Could Drive More Rating Actions As Health And Inequality Remain In
                          Focus
               P.20       Recent S&P Global Credit Ratings Actions

    Content By S&P Dow Jones Indices:
               P.22-23 Market Attributes: Index Dashboard

To learn more about S&P Global Market Intelligence, please email us at SPGMIMarketingAPAC@spglobal.com     S&P Global Market Intelligence Asia-Pacific Markets Monthly – August 2020 | Page 2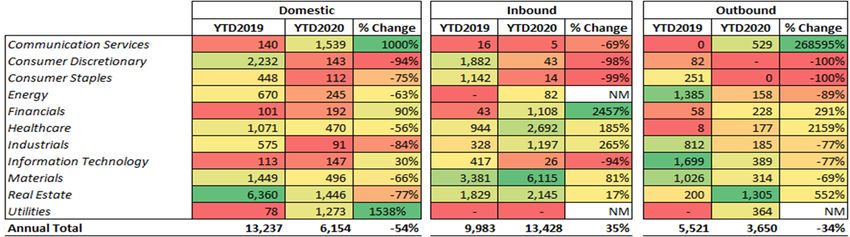
Greater China Q2 2020 M&A Summary
   •   Greater China witnessed 1430 M&A deals worth US$116.7bn in H1
       2020.
   •   Compared to YTD2019, YTD2020 saw a 5% decrease in aggregate
       transaction value, with outbound total transaction value decreased by
       67.7% while domestic & inbound transaction value increased by 6.8%.
   •   YTD2020, communication services and financials industry saw the
       largest growth in deal value in domestic and inbound market.
   •   In outbound market of YTD2020, consumer staples and utilities industry
       continue the trends of huge growth in deal value, while the remaining
       industries all saw decrease in deal value.
   •   Read More >

 Domestic & Inbound M&A Sector Breakdown                                                                                  Outbound M&A Sector Breakdown

Source: S&P Global Market Intelligence as of 30 June 2020. China, Hong Kong, Macau, and Taiwan are included in this study. Data sorted by transaction value from highest (green) to lowest (red).
To learn more about S&P Global Market Intelligence, please email us at SPGMIMarketingAPAC@spglobal.com                                   S&P Global Market Intelligence Asia-Pacific Markets Monthly – August 2020 | Page 3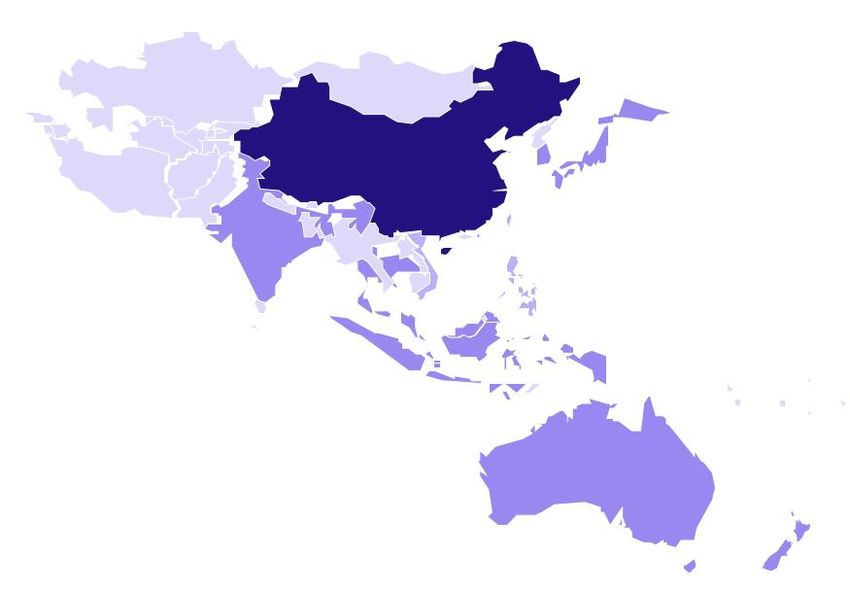
Japan Q2 2020 M&A Summary
  M&A Overview

 •    The COVID-19 pandemic sends business and consumer activity into a
      unprecedented stall, social-distancing and travel restrictions have
      slowed down the M&A activities in Q2 2020.

 •    Total deal value of 1H 2020 Japan domestic & inbound M&A increased
      by 22% to USD 28,450 million compared to the same period last year,
      largely contributed by the decent result in Q1 2020. On the other hand,
      total deal value of Japan outbound M&A dropped by 57% to USD 6,105
      million.
 •    Read More >

 Domestic & Inbound M&A Breakdown                                                                                                                           Outbound M&A Breakdown

Source for all 3 charts: S&P Global Market Intelligence as of 30 June 2020. *Data sorted by transaction value from highest (green) to lowest (red). Charts are for illustrative purposes only. Data sorted by transaction value from highest (green) to lowest (red).
To learn more about S&P Global Market Intelligence, please email us at SPGMIMarketingAPAC@spglobal.com                                                           S&P Global Market Intelligence Asia-Pacific Markets Monthly – August 2020 | Page 4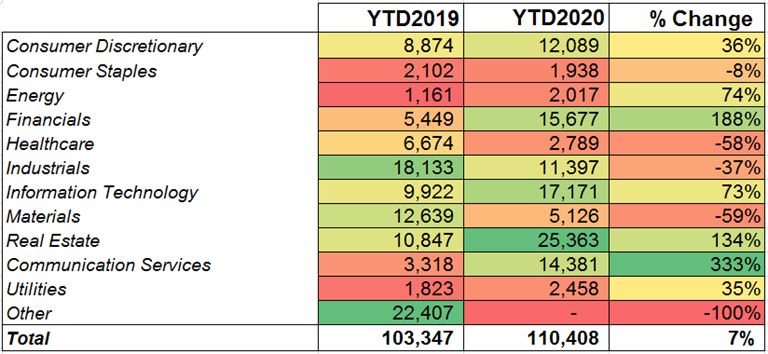
Australia Q2 2020 M&A Summary
  M&A Overview                                                                                                                                                    M&A Breakdown
  •     Australia witnessed 276 M&A deals worth US$13.6bn in Q2
        2020.
  •     Compared to Q2 2019, Q2 2020 saw a 16.7% decrease in
        aggregate transaction value. While the total transaction value
        dropped for domestic and outbound transactions, total inbound
        transaction value went up by 40.7%.
  •     In H1 2020, the utilities showed a large growth in deal value in
        domestic market, financials had a substantial increase in
        inbound market, and communication services saw a
        considerable growth in outbound market.
  •     Read More >

  Sectoral M&A Breakdown

Source: S&P Global Market Intelligence as of 30 June 2020. *Data sorted by transaction value from highest (green) to lowest (red) in USD Millions.
To learn more about S&P Global Market Intelligence, please email us at SPGMIMarketingAPAC@spglobal.com                                               S&P Global Market Intelligence Asia-Pacific Markets Monthly – August 2020 | Page 5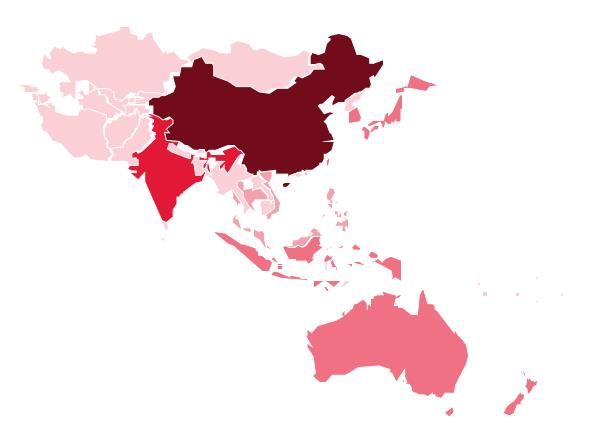
China's Shadow Banking Likely To Stay In Contraction
 As Lenders Get Cautious
 July 7, 2020 - China's shadow banking system, a key alternative funding source for companies with relatively weak               More Top Stories:
 credit profiles, will likely continue to shrink as even the nonbank lenders get cautious amid economic weakness and
                                                                                                                                 July 22, 2020 - Singapore banks to remain major trade
 ongoing trade tensions between Beijing and Washington, analysts say.
                                                                                                                                 financiers as global commerce returns

 Disruptions triggered by the novel coronavirus have raised the risk of default, especially by weaker companies, and             July 15, 2020 - Japanese banks' efficiency behind most
 the government has only slightly loosened its grip on shadow banks as they are still seen as a source of financial              Asia-Pacific lenders; Chinese lead
 risk that could have a systemic impact.
                                                                                                                                 July 1, 2020 - Japanese banks warned of COVID-19
 Read the full article >                                                                                                         impact on overseas CLO investments

                                                                                                                                 Real-Time Alerts
                                                                                                                                 Interested to see more?
                                                                                                                                 The combination of S&P Capital IQ platform's broad
                                                                                                                                 data and powerful analytics with the S&P Global Market
                                                                                                                                 Intelligence platform is designed to give you unrivalled
                                                                                                                                 insight into the markets and sectors you follow. Request
                                                                                                                                 a free trial to see how our coverage approach can
                                                                                                                                 enhance your analysis of global financial institutions.
                                                                                                                                 Already subscribed to the Market Intelligence
                                                                                                                                 platform?
                                                                                                                                 Click here to receive real-time alerts on emerging trends
                                                                                                                                 and topics of interest produced by our research analysts
                                                                                                                                 and news staffs.

To learn more about S&P Global Market Intelligence, please email us at SPGMIMarketingAPAC@spglobal.com   S&P Global Market Intelligence Asia-Pacific Markets Monthly – August 2020 | Page 6
COVID-19 Turns Indonesian Ore Export Ban Into
Curse For Nickel Market
July 21, 2020 - The Indonesian nickel ore export ban was originally expected to drive nickel prices higher in 2020
by the market. However, the demand destruction caused by the COVID-19 pandemic has lowered prices by 7%
More Top Stories:
since the start of the year. In addition, we expect Indonesia's primary nickel production to expand by 21% year July 28, 2020 - Massive floods in China weigh on
over year to 575,000 tonnes in 2020. The combination will drive the global primary nickel market to a 100,000- near-term domestic demand for steel, coal
tonne surplus this year — the market's first primary surplus since 2015 — from a 33,000-tonne deficit in 2019.
Average London Metal Exchange nickel prices will, therefore, drop by 7% year over year to US$12,990 per tonne July 28, 2020 - Path to net zero: Miners are starting
in 2020. to decarbonize as investor pressure mounts
Read the full article >
July 15, 2020 - Australians to ramp up European EV
partnerships as supply chain pressure builds
July 10, 2020 - Iron Ore CBS June 2020 — Iron Ore
Prices Hit 10-Month High
Upcoming Webinar: State of the Market: Mining
Q2-2020 | August 13
On-Demand Webinar: Outlooks for Lithium and
Cobalt
Power your mining industry analysis with
actionable insights.
Our interactive metals and mining service provides a
comprehensive view of global mining industry
activities. From worldwide exploration, development,
production, mine cost analysis, acquisitions activity,
commodity market forecasts, and credit risk
assessments—our unbiased insight can power your
mining analysis. Learn more >
Subscribe to our newsletter for more essential
insights on how COVID-19 affects the energy and
mining sector.
To learn more about S&P Global Market Intelligence, please email us at SPGMIMarketingAPAC@spglobal.com S&P Global Market Intelligence Asia-Pacific Markets Monthly – August 2020 | Page 7China 2020 Survey Summary: COVID-19 Crisis
Accelerated Media And Tech Trends
July 29, 2020 - China was the first country to be hit by the COVID-19 pandemic. The first cases were traced to the More Top Stories:
city of Wuhan, in Hubei province, in late December 2019, and the disease quickly spread through China as people
traveled to their hometowns ahead of the Chinese New Year holidays in January 2020. July 31, 2020 - As Nokia diversifies, Ericsson makes 5G
Lasting for more than two weeks, the Chinese New Year season is usually the busiest time of the year in China, but inroads in China
most festivities for this year were canceled due to the pandemic. China Central Television's New Year's Gala, the
most-watched TV program in terms of live viewers, remained in broadcast on Jan. 24 and attracted 1.23 billion July 29, 2020 - APAC ad spend to fall 8.5% YOY in
2020, social media to lead recovery
viewers, up by 59 million from the previous year.
Read the full article > July 13, 2020 - New: Global mobile index
July 08, 2020 - Chinese digital lenders transforming into
riskier business
Essential Tech, Media & Telecoms
(TMT) Intelligence
Our global TMT service offers a comprehensive source
to assess impact on your business, identify
opportunities, and manage risk on a platform with data
coverage, news, research, and forward-looking
projections.
About Our Global Tech, Media and Telecoms (TMT)
Solution / Request a Demo
TMT Industry News
To learn more about S&P Global Market Intelligence, please email us at SPGMIMarketingAPAC@spglobal.com S&P Global Market Intelligence Asia-Pacific Markets Monthly – August 2020 | Page 8Credit Risk Trends For Asia The Credit Landscape Using Probability of Default (PD) Fundamentals in Asia aaa to a- bbb+ to bbb- bb+ to bb- b+ to b- ccc+ and below Sector Australia China Hong Kong India Indonesia Japan Malaysia New Zealand Philippines Singapore South Korea Taiwan Thailand Asia Average Consumer Discretionary bbb- bb bbb- bb bb bbb bb bb+ bb- bb- bbb- bb bb- bb Consumer Staples bb bb+ bbb+ bb+ bbb- bbb bb+ bbb- bbb- bb+ bbb- bb+ bbb- Energy bbb- bbb+ a- bbb bb bb bb b b bbb- bb bbb+ bb- bb+ Financials bbb- bb+ bbb- bb- bb- bbb- bbb bbb- bb+ bbb- bb+ bb+ bb+ Healthcare bb bb+ bbb- bb bb bbb bbb- bbb- bb bb- bb- bb bb+ Industrials bb+ bbb- a- b+ bb- bbb bb+ bb bbb- bbb+ bb+ bb b bb Information Technology bb- bb bb+ bbb- b+ bbb- bb+ b b- bb bbb- bb+ bb- bb Materials bbb bb- bbb- bb+ b+ bbb- bb bb+ bb bb+ bb bb bb Telecommunication Services b+ bb+ bbb+ b+ bb bbb+ bb- bb bb+ bb+ bb+ bb bb- bbb+ Utilities bbb bb+ bbb+ bb bbb- bbb bbb bb+ bb+ bbb bbb bb bb bb+ Country Average bb+ bb+ bbb bb bb- bbb bb+ bb bb bb+ bb+ bb+ bb- bb+ Source: S&P Global Market Intelligence fundamental-based PD model, PD Model Fundamentals. Lowercase nomenclature is used to differentiate S&P Global Market Intelligence’s PD Model Fundamental scores from the credit ratings issued by S&P Global Ratings. Credit ratings are prepared by S&P Global Ratings, which is analytically and editorially independent from any other analytical group at S&P Global. Data as of 3 rd August 2020. Charts and graphs are for illustrative purposes only To learn more about S&P Global Market Intelligence, please email us at SPGMIMarketingAPAC@spglobal.com S&P Global Market Intelligence Asia-Pacific Markets Monthly – August 2020 | Page 9
Credit Risk Trends For Asia
 Market Signal Probability of Default Trends in Developed Asia
             7.00%

             6.00%                                                                                                                                                                                                                  Australia

             5.00%                                                                                                                                                                                                                  Hong Kong

             4.00%                                                                                                                                                                                                                  Japan
     Title

                                                                                                                                                                                                                                    South Korea
             3.00%
                                                                                                                                                                                                                                    New Zealand
             2.00%
                                                                                                                                                                                                                                    Singapore
             1.00%
                                                                                                                                                                                                                                    Asia Median
             0.00%
                     Aug-19         Sep-19           Oct-19          Nov-19           Dec-19          Jan-20           Feb-20          Mar-20           Apr-20          May-20    Jun-20        Jul-20      Aug-20

 Source: S&P Global Market Intelligence equity volatility-based PD Model Market Signals benchmarks as of 3rd August 2020. Charts and graphs are for illustrative purposes only

 Market Signal Probability of Default Trends in Developing Asia
             9.00%

             8.00%                                                                                                                                                                                                                  China

             7.00%                                                                                                                                                                                                                  India

             6.00%                                                                                                                                                                                                                  Indonesia

                                                                                                                                                                                                                                    Malaysia
             5.00%
     Title

                                                                                                                                                                                                                                    Philippines
             4.00%
                                                                                                                                                                                                                                    Taiwan
             3.00%
                                                                                                                                                                                                                                    Thailand
             2.00%
                                                                                                                                                                                                                                    Vietnam
             1.00%
                                                                                                                                                                                                                                    Asia Median
             0.00%
                     Aug-19         Sep-19           Oct-19          Nov-19           Dec-19           Jan-20          Feb-20          Mar-20           Apr-20          May-20     Jun-20       Jul-20       Aug-20

 Source: S&P Global Market Intelligence equity volatility-based PD Model Market Signals benchmarks as of 3rd August 2020. Charts and graphs are for illustrative purposes only

To learn more about S&P Global Market Intelligence, please email us at SPGMIMarketingAPAC@spglobal.com                                                     S&P Global Market Intelligence Asia-Pacific Markets Monthly – August 2020 | Page 10
Transaction Activity By Sector, Country S&P Global Market Intelligence provides detailed information on M&A and financing transactions covering the most active markets in the world. We track all publicly announced mergers, acquisitions, private placements, public offerings, shelf registrations, equity buybacks, and bankruptcies. Transaction data is updated daily from various sources such as regulatory filings, company websites, newsletters, trade publications, and press releases. Our Transaction Data: S&P Global Market Intelligence covers 1,300,000+ transactions globally. All transaction information, including M&A activity, is seamlessly integrated in the S&P Capital IQ platform and S&P Global Market Intelligence Excel Plug-In, and can be viewed alongside company fundamentals. To learn more about our transaction coverage, history, and collection process, please contact SPGMIMarketingAPAC@spglobal.com In This Report: Transaction activities are based on data in selected countries in APAC - Australia, China, Hong Kong, India, Indonesia, Japan, Malaysia, New Zealand, Philippines, Singapore, South Korea, Taiwan, Thailand and Vietnam. To learn more about S&P Global Market Intelligence, please email us at SPGMIMarketingAPAC@spglobal.com S&P Global Market Intelligence Asia-Pacific Markets Monthly – August 2020 | Page 11
M&A Activity In Asia Pacific: Strategic vs. Financial Buyers
 Compared to last month, there was a subtle change in M&A deals volume in the Asia-Pacific region. There were 486 strategic deals and 36
 financial deals announced in July 2020.

                     600

                     500

                     400
      No. of Deals

                     300

                     200

                     100

                       0
                           Feb'20               Mar'20                Apr'20                May'20                 Jun'20                Jul'20

                                                    Financial Deals                       Strategic Deals

 Source: S&P Global Market Intelligence as of August 1, 2020. Figures are based on M&A announcement dates. Includes both closed and pending transactions as well as those without transaction values.
 Charts are provided for illustrative purposes.
To learn more about S&P Global Market Intelligence, please email us at SPGMIMarketingAPAC@spglobal.com                                                 S&P Global Market Intelligence Asia-Pacific Markets Monthly – August 2020 | Page 12
M&A Activity In Asia Pacific: Selected Sectors
Utilities remained as one of the most active sectors, showing a 26% YTD increase in deals volume and a 42% YTD increase in the value of
deals. This month, the telecommunication services sector also experienced a 62% YoY growth for deals value.
No. of Deals YTD Activity (20’ vs. 19’) Value of Deals (USDmm) YTD Activity (20’ vs. 19’)
'20 YTD '19 YTD YoY Growth '20 YTD '19 YTD YoY Growth
Sector Sector YoY Comparison
YoY Comparison Through
Jan 1, 2020 - Jan 1, 2019 - Through
Jan 1, 2020 - Jan 1, 2019 -
Jul 31, 2020 Jul 31, 2019 Jul 31, 2020 Jul 31, 2020 Jul 31, 2019 Jul 31, 2020
Industrials 902 862 5% Real Estate 57,683 53,111 9%
IT 638 621 3% Industrials 33,803 47,054 -28%
Discretionary 595 630 -6% Discretionary 30,685 21,375 44%
Real Estate 444 490 -9% IT 28,089 17,877 57%
Materials 422 382 10% Financials 26,799 27,498 -3%
Teleco. Services 335 298 12% Teleco. Services 23,864 14,749 62%
Health Care 307 288 7% Materials 20,869 42,991 -51%
Financials 262 285 -8% Healthcare 10,975 13,774 -20%
Staples 258 268 -4% Staples 10,891 28,378 -62%
Utilities 178 141 26% Utilities 8,583 6,059 42%
Energy 93 82 13% Energy 2,665 5,892 -55%
NSD 729 577 26% NSD 15,857 19,406 -18%
Total 5163 4924 5% Total 270,762 298,163 -9%
Source: S&P Global Market Intelligence as of August 1, 2020. Figures are based on M&A announcement dates. Includes closed and pending transactions as well as those without transaction values. NSD – No Sector Disclosed. Tables are provided for
illustrative purposes. Transaction value and % change are color coded with highest value in green to lowest in red.
To learn more about S&P Global Market Intelligence, please email us at SPGMIMarketingAPAC@spglobal.com S&P Global Market Intelligence Asia-Pacific Markets Monthly – August 2020 | Page 13M&A Activity In Asia Pacific: Selected Countries
In July 2020, there was a total of 806 deals in the region and China remained the most active market for M&As. Compared to the same period last year, both the
number of deals and the total value of deals shrunk by 15% and 12% respectively. Philippines experienced a 982% elevation in the total deals value, followed by
Taiwan who had a 292% increase.
No. of Deals and Value by Country/Region (Jul’20)
Country/Region No. of Deals Value of Deals ($USDmm)
China 285 20,097.2
Australia 131 2,660.5
Japan 91 9,097.7
South Korea 60 2,143.0
India 57 1,184.6
Vietnam 38 229.9
Singapore 34 1,230.4
Hong Kong 31 7,591.1
Malaysia 29 57.3
Thailand 14 97.0
New Zealand 13 1,084.9 Key Threshold (No. of Deals)
Taiwan 12 1,550.0 0 - 12
Indonesia 7 22.1 >12 - 57
Philippines 4 1 >57 - 114
No. of Deals and Value YTD Activity (20’ vs. 19’) >114 - 171
>171 - 228
No. of Deals Value of Deals ($USDmm) >228 - 285
20 YTD 19 YTD YoY Growth 20 YTD 19 YTD YoY Growth
YoY Comparison YoY Comparison
Jan 1, 2020 - Jan 1, 2019 - Through Jan 1, 2020- Jan 1, 2019 - Through
Jul 31, 2020 Jul 31, 2019 Jul 31, 2020 Jul 31, 2020 Jul 31, 2019 Jul 31, 2020
China 1,709 1,997 -14% 134,588 145,019 -7%
Australia 730 805 -9% 22,115 30,313 -27%
Japan 811 873 -7% 38,256 29,860 28%
South Korea 372 441 -16% 16,786 22,285 -25%
India 403 604 -33% 12,949 27,033 -52%
Vietnam 215 210 2% 1,876 711 164%
Singapore 192 239 -20% 13,572 19,725 -31%
Hong Kong 204 233 -12% 18,296 11,961 53%
Malaysia 170 212 -20% 1,818 7,203 -75%
Thailand 117 140 -16% 2,272 8,084 -72%
New Zealand 96 114 -16% 2,664 1,713 56%
Taiwan 41 38 8% 2,599 664 292%
Source: S&P Global Market Intelligence as of August 1, 2020. Figures are based on M&A announcement dates.
Indonesia 62 104 -40% 774 3,013 -74%
Philippines 41 48 -15% 2,198 203 982%
Includes both closed and pending transactions as well as those without transaction values. Charts are provided
Total 5,163 6,058 -15% 270,762 307,788 -12% for illustrative purposes.
To learn more about S&P Global Market Intelligence, please email us at SPGMIMarketingAPAC@spglobal.com S&P Global Market Intelligence Asia-Pacific Markets Monthly – August 2020 | Page 14Initial Public Offerings By Country
There was a significant increase in both the IPOs number (137%) and total value (154%) for China this month. YTD 2020, the region had minimal changes in deal
volume but a 42% climb in the total value of IPOs, compared to the same period last year. New Zealand had a remarkable performance – it has doubled the number of
IPOs and increased the capital raised by 522% on a YoY basis
No. of IPOs and Value by Country/Region (Jul’20)
Country/Region No. of IPOs Value of IPOs ($USDmm)
China 83 12,190.2
South Korea 10 345.2
Japan 7 96.7
Malaysia 5 38.7
Hong Kong 3 441.3
India 3 68.0
Australia 2 7.0
Singapore 2 20.0
Thailand 2 484.4
Indonesia 1 2.8 Key Threshold (No. of IPOs)
New Zealand 1 32.0 0
Philippines 0 0.0 >0 - 17
Taiwan 0 0.0 >17 - 33
Vietnam 0 0.0 >33 - 50
No. of IPOs and Value YTD Activity (20’ vs. 19’) >50 - 66
>66 - 83
No. of Deals Value of IPOs ($USDmm)
20 YTD 19 YTD YoY Growth 20 YTD 19 YTD YoY Growth
YoY Comparison YoY Comparison
Jan 1, 2020 - Jan 1, 2019 - Through Jan 1, 2020 - Jan 1, 2019 - Through
Jul 31, 2020 Jul 31, 2019 Jul 31, 2020 Jul 31, 2020 Jul 31, 2019 Jul 31, 2020
China 260 170 53% 38,117 23,641 61%
South Korea 33 38 -13% 1,429 1,200 19%
Japan 41 44 -7% 662 1,093 -39%
Malaysia 18 23 -22% 184 436 -58%
Hong Kong 20 28 -29% 1,089 960 13%
India 19 44 -57% 1,474 1,695 -13%
Australia 14 23 -39% 76 412 -82%
Singapore 11 15 -27% 665 2,210 -70%
Thailand 5 15 -67% 2,768 476 482%
Indonesia 29 32 -9% 252 658 -62%
New Zealand 2 1 100% 41 7 522%
Philippines 1 - NA 32 - NA
Taiwan 1 5 -80% 2 78 -98% Source: S&P Global Market Intelligence as of August 1, 2020. Figures are based on public offerings
Vietnam 5 16 -69% 14 32 -55% offer date. Includes all closed transactions. Tables are provided for illustrative purposes.
Total 459 454 1% 46,806 32,897 42%
To learn more about S&P Global Market Intelligence, please email us at SPGMIMarketingAPAC@spglobal.com S&P Global Market Intelligence Asia-Pacific Markets Monthly – August 2020 | Page 15Private Equity Investments & Buyouts: Selected Countries
Compared to June, India has surpassed Japan and became the second most active player in the PE market. There was a further boost in both the deal volume (27%)
and the aggregated deal value (99%) within APAC. Indonesia had a 114% YoY growth in terms of the number of deals while Vietnam had an 1103% YoY growth for
the total value of deals.
No. of Deals and Value by Country/Region (Jul’20)
Country/Region No. of Deals Value of Deals ($USDmm)
China 93 5,103.4
India 22 1,966.3
Japan 18 828.7
South Korea 18 274.3
Australia 5 2.2
Singapore 5 1,261.2
Hong Kong 2 12.0
Indonesia 2 111.4
New Zealand 2 1,044.8
Taiwan 2 41.0
Malaysia 0 0.0 Key Threshold (No. of Deals)
Philippines 0 0.0 0
Thailand 0 0.0 >0 - 19
Vietnam 0 0.0 >19 - 37
No. of Deals and Value YTD Activity (20’ vs. 19’) >37 - 56
>56 - 74
No. of Deals Value of Deals ($USDmm) >74 - 93
20 YTD 19 YTD YoY Growth 20 YTD 19 YTD YoY Growth
YoY Comparison YoY Comparison
Jan 1, 2020 - Jan 1, 2019- Through Jan 1, 2020- Jan 1, 2019 - Through
Jul 31, 2020 Jul 31, 2019 Jul 31, 2020 Jul 31, 2020 Jul 31, 2019 Jul 31, 2020
China 519 389 33% 37,693 13,667 176%
India 133 159 -16% 9,449 9,041 5%
Japan 202 126 60% 8,355 1,828 357%
South Korea 110 94 17% 7,635 6,902 11%
Australia 63 42 50% 4,494 2,188 105%
Singapore 43 27 59% 1,565 1,705 -8%
Hong Kong 9 11 -18% 115 451 -75%
Indonesia 15 7 114% 1,828 405 351%
New Zealand 11 8 38% 1,051 183 473%
Taiwan 5 3 67% 66 77 -14%
Malaysia 4 11 -64% 47 349 -86%
Philippines 2 3 -33% 132 37 258% Source: S&P Global Market Intelligence as of August 1, 2020. Figures are based on M&A announcement
Thailand 4 - NA 121 - NA dates. Includes both closed and pending transactions as well as those without transaction values. Tables are
Vietnam 12 11 9% 832 69 1,103% provided for illustrative purposes.
Total 1,132 891 27% 73,386 36,904 99%
To learn more about S&P Global Market Intelligence, please email us at SPGMIMarketingAPAC@spglobal.com S&P Global Market Intelligence Asia-Pacific Markets Monthly – August 2020 | Page 16Venture Capital Investments: Non Buyouts By Country
In July 2020, China had the highest deal number and deal value. Similar to last month, the size of deals had a 52% YoY growth whereas the number of deals
remained the same compare to the same period last year.
No. of Deals and Value by Country/Region (Jul’20)
Country/Region No. of Deals Value of Deals ($USDmm)
China 123 5,049.6
Japan 47 804.0
India 35 1,626.9
South Korea 18 276.0
Singapore 17 1,270.9
Australia 8 26.7
Hong Kong 7 32.8
Indonesia 5 361.6
New Zealand 4 5.2
Taiwan 3 49.0 Key Threshold (No. of Deals)
Malaysia 1 0.1 0
Vietnam 1 0.0 >1 - 25
Philippines 0 0.0 >25 - 49
Thailand 0 0.0 >49 - 74
No. of Deals and Value YTD Activity (20’ vs. 19’) >74 - 98
>98 - 123
No. of Deals Value of Deals ($USDmm)
20 YTD 19 YTD YoY Growth 20 YTD 19 YTD YoY Growth
YoY Comparison YoY Comparison
Jan 1, 2020 - Jan 1, 2019 - Through Jan 1, 2020- Jan 1, 2019 - Through
Jul 31, 2020 Jul 31, 2019 Jul 31, 2020 Jul 31, 2020 Jul 31, 2019 Jul 31, 2020
China 755 737 2% 29,762 19,055 56%
Japan 329 318 3% 5,775 2,193 163%
India 280 318 -12% 8,900 8,110 10%
South Korea 98 102 -4% 3,183 2,701 18%
Singapore 105 116 -9% 2,724 1,354 101%
Australia 69 53 30% 2,617 2,133 23%
Hong Kong 26 19 37% 174 356 -51%
Indonesia 52 45 16% 2,202 489 350%
New Zealand 15 12 25% 53 59 -10%
Taiwan 9 6 50% 101 5 1,790%
Malaysia 9 14 -36% 41 88 -54%
Vietnam 21 22 -5% 835 385 117% Source: S&P Global Market Intelligence as of August 1, 2020. Figures are based on transaction
Philippines 2 7 -71% 125 285 -56% announcement dates. Includes both closed and pending transactions as well as those without transaction
Thailand 8 7 14% 123 54 127% values. Non-buyouts will include all features except for leverage buyouts ( LBO), management buyout or
Total 1,778 1,776 0% 56,616 37,269 52% secondary LBO. Tables are provided for illustrative purposes.
To learn more about S&P Global Market Intelligence, please email us at SPGMIMarketingAPAC@spglobal.com S&P Global Market Intelligence Asia-Pacific Markets Monthly – August 2020 | Page 17Credit Ratings, Research & Commentary S&P Global Ratings is the world’s leading provider of credit ratings. Our ratings are essential to driving growth, providing transparency and helping educate market participants so they can make decisions with confidence. With more than 1.1 million credit ratings outstanding, approximately 1,400 credit analysts and a presence in 28 countries, we offer a view of the market built on a unique combination of broad perspective and local insight. We provide our opinions and research about relative credit risk; market participants gain information to help support the growth of transparent, liquid debt markets worldwide. For more information, visit www.spglobal.com/ratings. Our Credit Ratings: S&P Global Ratings has more than 1 million credit ratings outstanding on government, corporate, financial sector and structured finance entities and securities. Our credit ratings are forward-looking opinions about creditworthiness — the ability and willingness of issuers, such as corporations or governments, to meet their financial obligations in full and on time. To learn more about how you can benefit from a credit rating from S&P Global Ratings, please contact anthony.foo@spglobal.com To learn more about S&P Global Market Intelligence, please email us at SPGMIMarketingAPAC@spglobal.com S&P Global Market Intelligence Asia-Pacific Markets Monthly – August 2020 | Page 18
The ESG Pulse: Social Factors Could Drive More Rating
 Actions As Health And Inequality Remain In Focus
 July 16, 2020
                                                                                                                                   More Top Stories:
 •   Of the close to 1,200 ESG-related rating actions during April and May, 98% were triggered by the COVID-19
     pandemic. The pandemic has highlighted the importance of social factors, which could drive more rating actions                July 28, 2020 - Global Financing Conditions: Bond
     given the increased awareness and credit relevance of health issues, diversity, inequality, and social unrest.                Issuance Is Expected To Finish 2020 Up 6% After A
 •   We classify the pandemic as a health and safety-related social factor in our rating actions, if we believe health             Strong Second Quarter
     concerns and social distancing measures directly affect the entity. Put differently, for the purpose of classifying
     ESG impacts, we excluded rating activity in sectors indirectly affected by the pandemic, i.e. they were more                  July 21, 2020 - China's Deflating Recovery Still Needs
     affected by the broader consequences of the recession than by health and safety (e.g. financial institutions, ABS             Stimulus
     or RMBS, and various corporate sectors like media, consumer products, and oil and gas). Consequently, ESG
                                                                                                                                   July 10, 2020 - Potential Downgrades Reach Another
     factors directly accounted for only 40% of COVID-19-related downgrades in the corporate sector in April and
                                                                                                                                   Record High Amid COVID-19 Stress
     May.

 Read the full article >                                                                                                           Credit Update
                                                                                                                                   Click here to subscribe* to CreditMatters Asia-Pacific, a
                                                                                                                                   weekly newsletter that is designed to offer the latest
                                                                                                                                   credit market insights.

                                                                                                                                   Credit Spotlight
                                                                                                                                   China Credit Spotlight: flagship series of China research
                                                                                                                                   designed to bring together views on China’s economic
                                                                                                                                   and credit trends.
                                                                                                                                   ASEAN Credit Spotlight: showcases insights into
                                                                                                                                   ASEAN macroeconomic developments and key credit
                                                                                                                                   trends affecting governments, corporates and financial
                                                                                                                                   services.

                                                                                                                                             * Subscription to the S&P Capital IQ platform is required

To learn more about S&P Global Market Intelligence, please email us at SPGMIMarketingAPAC@spglobal.com   S&P Global Market Intelligence Asia-Pacific Markets Monthly – August 2020 | Page 19
Recent S&P Global Credit Ratings Actions Company Name Rating Action Rating Date PriorRating Current Rating Geographic Locations AMP Group Holdings Limited Downgrade Jul-13-2020 BBB+ BBB Australia (Primary) AMP Limited (ASX:AMP) Downgrade Jul-13-2020 BBB+ BBB Australia (Primary) Avation PLC (LSE:AVAP) Downgrade Jul-09-2020 B CCC Singapore (Primary) Central Japan Railway Company (TSE:9022) Downgrade Jul-03-2020 AA- A+ Japan (Primary) Coronado Global Resources Inc. (ASX:CRN) Downgrade Jul-07-2020 B+ B Australia (Primary) Delhi International Airport Limited Downgrade Jul-06-2020 BB- B+ India (Primary) GMR Hyderabad International Airport Limited Downgrade Jul-24-2020 BB BB- India (Primary) Mulhacen Pte. Ltd. Downgrade Jul-14-2020 B- CCC+ Singapore (Primary) Nissan Financial Services Australia Pty Ltd Downgrade Jul-03-2020 BBB BBB- Australia (Primary) Nissan Motor Co., Ltd. (TSE:7201) Downgrade Jul-03-2020 BBB BBB- Japan (Primary) PT Modernland Realty Tbk (IDX:MDLN) Downgrade Jul-08-2020 CCC- SD Indonesia (Primary) Sunshine 100 China Holdings Ltd (SEHK:2608) Downgrade Jul-03-2020 CCC CCC- China (Primary) YanAn Bicon Pharmaceutical Listed Company (SZSE:002411) Downgrade Jul-31-2020 CCC+ CCC- China (Primary) Zijin Mining Group Company Limited (SEHK:2899) Downgrade Jul-14-2020 BBB- BB+ China (Primary) Source: S&P Global Ratings, as of August 1, 2020. Credit ratings are prepared by S&P Global Ratings, which is analytically and editorially independent from any other analytical group at S&P Global. Tables are for illustrative purposes only. S&P Global Ratings Australia Pty Ltd holds Australian financial services license number 337565 under the Corporations Act 2001. Credit Ratings issued by S&P Global Ratings (Australia) and related research are not intended for and must not be distributed to any person in Australia other than a wholesale client (as defined in Chapter 7 of the Corporations Act). To learn more about S&P Global Market Intelligence, please email us at SPGMIMarketingAPAC@spglobal.com S&P Global Market Intelligence Asia-Pacific Markets Monthly – August 2020 | Page 20
Research, Education, and Market Commentary
 S&P Dow Jones Indices is the largest global resource for essential index-based concepts, data and research, which provides essential intelligence for individuals,
 companies, and governments to make decisions with confidence. Whether you’re looking to track a market’s performance, evaluate your portfolio, or invest in index-linked
 investment products, indices are indispensable financial tools. We carry out extensive interactions with clients to create cutting-edge quantitative solutions, with an award-
 winning research team that specifically covers multiple asset classes. Our indexology blog (www.indexologyblog.com) features posts, reports, performance, and
 discussions from knowledgeable industry contributors to provide insightful research and newest innovations, market, political and economic events through the lens of our
 index data.

 Our Indices:
 As the world's largest resource for index-based innovation, data and research our mission is to bring independent, transparent and cost effective solutions to the global
 investment community. S&P Dow Jones Indices is at the forefront of index change and innovation. Our goal is to continue to anticipate and respond to how our clients see
 global investment opportunities.

 Home to iconic financial market indicators, such as the S&P 500 ® and the Dow Jones Industrial Average®. More assets are invested in products based on our indices
 than based on any other provider in the world. With over 1,000,000 indices and more than 120 years of experience constructing innovative and transparent solutions, S&P
 Dow Jones Indices defines the way investors measure and trade the markets. For more information, visit www.spdji.com or contact index_services@spglobal.com.

 In this Report:
 Monthly market performance that highlight developments in the Asia Pacific equity, commodities, fixed income, and niche-themed markets.

To learn more about S&P Global Market Intelligence, please email us at SPGMIMarketingAPAC@spglobal.com   S&P Global Market Intelligence Asia-Pacific Markets Monthly – August 2020 | Page 21
Market Attributes: Index Dashboard
Summary S&P Pan Asia BMI Country Contribution
July 2020
Asian equities rallied in July, with the S&P Pan Asia BMI up 4%. Except for Japan,
all single-country indices posted gains. S&P Pan Asia BMI: 4.04%
China 2.08%
Momentum and Quality were the leading factors, whilst Information Technology and
Energy were the top performing sectors. Taiwan 0.89%
South Korea 0.64%
With the exception of the S&P/ASX 200 VIX, volatility continued to decline across
Asia. India 0.53%
Commodities rallied, with Silver as the leader, up an impressive 30% in July. Australia 0.43%
Malaysia 0.11%
With the exception of China, performance for Asian fixed income indices was
positive. Singapore 0.05%
Indonesia 0.04%
Hong Kong 0.03%
New Zealand 0.03%
Pakistan 0.01%
Philippines -0.02%
Thailand -0.03%
Japan -0.75%
Source: S&P Dow Jones Indices LLC and/or its affiliates. Data as of July 30, 2020. Index performance based on total return. Numbers in brackets are closing price levels for the corresponding indices. Returns for single country indices and single country strategies are
in local currency, otherwise USD. Sector contributions to the S&P Pan Asia BMI are calculated over the prior month. Charts and graphs are provided for illustrative purposes. Past performance is no guarantee of future results. For more information, please visit our
website at www.spdji.com
To learn more about S&P Global Market Intelligence, please email us at SPGMIMarketingAPAC@spglobal.com S&P Global Market Intelligence Asia-Pacific Markets Monthly – August 2020 | Page 22Market Attributes: Index Dashboard
Index Investment Strategy
Index 1M 3M YTD Index 1M 3M YTD Index 1M 3M YTD
Pan Asia Equity Single-Country Equity Single-Country Fixed Income Yield
S&P Asia-Pacific BMI 0.70% 8.21% -7.63% S&P Taiwan BMI 11.30% 19.35% 9.39% S&P BSE India Government Bond 5.56% 1.44% 3.83% 9.33%
S&P Pan Asia BMI 4.04% 12.25% -2.48% S&P/NZX NZ Government Bond 0.60% 0.60% 0.14% 6.43%
S&P Korea BMI 7.74% 18.08% 5.26%
S&P Pan Asia SmallCap 4.50% 15.17% -2.51% S&P Singapore Government Bond 0.57% 0.76% 1.12% 4.66%
S&P BSE SENSEX 8.14% 12.16% -8.05% S&P Korea Government Bond 1.02% 0.76% 1.71% 2.97%
S&P Pan Asia MidCap 2.99% 11.33% -5.54%
S&P/ASX 200 0.50% 7.62% -9.97% S&P Taiwan Government Bond 0.40% 0.32% 0.71% 2.33%
S&P Emerging Asia-Pacific BMI 9.24% 18.63% 6.09%
S&P Asia 50 7.81% 16.69% 6.90% S&P Singapore BMI 1.21% 7.93% -10.04% S&P Hong Kong Government
0.10% 0.12% 0.25% 1.47%
S&P Southeast Asia 40 0.53% 7.80% -18.31% S&P/NZX 50 Portfolio 2.54% 9.21% -5.46% Bond
S&P China 500 9.81% 19.45% 15.79% S&P/ASX Australian Government
S&P Pan Asia BMI Smart Beta 0.68% 0.11% 0.30% 4.21%
Bond
S&P Pan Asia Momentum S&P/TOPIX 150 -3.43% 3.18% -10.79%
8.53% 21.13% 5.36% S&P Japan Government Bond 0.06% 0.25% -0.56% -0.67%
LargeMidCap S&P Hong Kong BMI 0.73% 3.46% -8.41%
S&P China Government Bond 2.93% -0.34% -2.32% 1.94%
S&P Pan Asia Quality LargeMidCap 5.97% 15.09% 4.53%
Single-Country Strategy Contributi
S&P Pan Asia Growth 5.61% 16.35% 5.41% S&P New China Sectors (USD) 10.40% 25.76% 23.87% S&P Pan Asia BMI Sectors on~
S&P Pan Asia Low Beta 3.32% 9.54% -5.21% Information Technology 1.63% 11.07% 22.50% 11.00%
S&P Korea Dividend Opportunities 3.85% 5.17% -13.29%
S&P Pan Asia Value 2.04% 7.31% -11.18% Energy 0.14% 6.23% 12.47% -16.10%
S&P Korea Low Volatility 5.45% 6.10% -11.46%
S&P Pan Asia Intrinsic Value Weighted 1.70% 6.42% -10.54% Communication Services 0.58% 5.96% 18.96% 17.96%
JPX/S&P CAPEX & Human Capital -4.13% 2.71% -8.25%
S&P Pan Asia Ethical Select Dividend Materials 0.37% 5.61% 14.68% -3.57%
1.56% 2.73% -18.08% S&P/JPX Dividend Arisocrats -6.78% -4.28% -21.44%
Opportunities Consumer Discretionary 0.83% 5.28% 16.69% 1.17%
S&P Pan Asia GIVI 1.35% 4.43% -11.50% S&P GIVI Japan -6.03% -2.54% -18.14% Health Care 0.26% 3.19% 16.79% 16.78%
S&P Pan Asia Low Volatility 1.27% -0.40% -16.17% Volatility Consumer Staples 0.21% 3.03% 9.16% 2.62%
S&P Pan Asia Dividend Aristocrats® 0.77% 3.31% -13.97% HSI Volatility Index (23.74) -10.21% -11.15% 52.08% Financials 0.21% 1.30% 5.16% -17.04%
S&P Pan Asia Enhanced Value Real Estate 0.03% 0.49% 2.48% -18.08%
-0.55% -0.33% -19.52% CBOE Volatility Index (VIX® index level:
LargeMidCap -19.62% -28.37% 67.08% Utilities -0.02% -0.72% -1.09% -10.03%
24.46)
Commodities Industrials -0.19% -1.50% 4.38% -13.18%
S&P 500® VIX Mid-Term Futures -1.69% 1.31% 87.69%
Dow Jones Commodity Index (DJCI) 4.74% 21.43% -17.68%
S&P/ASX 200 VIX (index level: 21.22) 6.80% -18.40% 70.01%
S&P GSCI 3.80% 26.94% -33.89%
S&P GSCI Silver 29.95% 60.10% 32.38% S&P 500® VIX Short-Term Futures -16.16% -25.30% 91.65%
S&P GSCI Gold 8.55% 14.63% 27.14% S&P/JPX JGB VIX (index level: 1.65) -10.33% -51.47% -28.26%
S&P GSCI Copper 6.69% 23.53% 3.62%
S&P GSCI Aluminum 5.06% 12.51% -8.94%
S&P GSCI Crude Oil 2.03% 73.29% -65.92%
S&P Dow Jones Indices LLC. Data as of June 30, 2020. Index performance based on total return. Returns for single country indices and single country strategies are in local currency, otherwise USD. Charts and graphs are provided for illustrative purposes. Past
performance is not an indication or guarantee of future results. These charts and graphs may reflect hypothetical historical performance. Please see the Performance Disclosure (https://us.spindices.com/regulatory-affairs-disclaimers/) for more information regarding
the inherent limitations associated with back-tested performance.
To learn more about S&P Global Market Intelligence, please email us at SPGMIMarketingAPAC@spglobal.com S&P Global Market Intelligence Asia-Pacific Markets Monthly – August 2020 | Page 23Market Observations – Make Your Own If you are interested in building your own report similar to this issue of Market Observations or any prior report, please contact us. Our team can assist you with helping to build a screen, linkage from Excel to PowerPoint, and customized templates and models for your future use. For illustrative purposes only. To learn more about S&P Global Market Intelligence, please email us at SPGMIMarketingAPAC@spglobal.com S&P Global Market Intelligence Asia-Pacific Markets Monthly – August 2020 | Page 24
Contact Us
 About S&P Global Market Intelligence Asia-Pacific Markets Monthly
 Asia-Pacific Markets Monthly is a complimentary report that provides timely insights and data on the CDS, Indexes, M&A, IPO, Private Equity
 and Venture Capital Investment markets.
 At S&P Global Market Intelligence, we integrate financial and industry data, research and news into tools that is designed to help track
 performance, generate alpha, identify investment ideas, understand competitive and industry dynamics, perform valuation and assess credit
 risk. Investment professionals, government agencies, corporations and universities globally can gain the intelligence essential to making
 business and financial decisions with conviction.
 S&P Global Market Intelligence is a division of S&P Global (NYSE: SPGI). For more information, visit www.spglobal.com/marketintelligence.

 How to Subscribe to Asia-Pacific Markets Monthly
 Asia-Pacific Markets Monthly is published for Media, S&P Global Market Intelligence clients and select finance professionals. To receive a
 copy, please register online here.

 Submit Feedback/Media Enquiries
 Please contact us at SPGMIMarketingAPAC@spglobal.com

To learn more about S&P Global Market Intelligence, please email us at SPGMIMarketingAPAC@spglobal.com   S&P Global Market Intelligence Asia-Pacific Markets Monthly – August 2020 | Page 25
Disclosures
 Copyright © 2020 by S&P Global Market Intelligence, a division of S&P Global Inc. All rights reserved.

 These materials have been prepared solely for information purposes based upon information generally available to the public and from sources believed to be reliable. No
 content (including index data, ratings, credit-related analyses and data, research, model, software or other application or output therefrom) or any part thereof (Content)
 may be modified, reverse engineered, reproduced or distributed in any form by any means, or stored in a database or retrieval system, without the prior written permission
 of S&P Global Market Intelligence or its affiliates (collectively, S&P Global). The Content shall not be used for any unlawful or unauthorized purposes. S&P Global and any
 third-party providers, (collectively S&P Global Parties) do not guarantee the accuracy, completeness, timeliness or availability of the Content. S&P Global Parties are not
 responsible for any errors or omissions, regardless of the cause, for the results obtained from the use of the Content. THE CONTENT IS PROVIDED ON “AS IS” BASIS.
 S&P GLOBAL PARTIES DISCLAIM ANY AND ALL EXPRESS OR IMPLIED WARRANTIES, INCLUDING, BUT NOT LIMITED TO, ANY WARRANTIES OF
 MERCHANTABILITY OR FITNESS FOR A PARTICULAR PURPOSE OR USE, FREEDOM FROM BUGS, SOFTWARE ERRORS OR DEFECTS, THAT THE
 CONTENT’S FUNCTIONING WILL BE UNINTERRUPTED OR THAT THE CONTENT WILL OPERATE WITH ANY SOFTWARE OR HARDWARE CONFIGURATION. In
 no event shall S&P Global Parties be liable to any party for any direct, indirect, incidental, exemplary, compensatory, punitive, special or consequential damages, costs,
 expenses, legal fees, or losses (including, without limitation, lost income or lost profits and opportunity costs or losses caused by negligence) in connection with any use of
 the Content even if advised of the possibility of such damages.

 S&P Global Market Intelligence’s opinions, quotes and credit-related and other analyses are statements of opinion as of the date they are expressed and not statements
 of fact or recommendations to purchase, hold, or sell any securities or to make any investment decisions, and do not address the suitability of any security. S&P Global
 Market Intelligence may provide index data. Direct investment in an index is not possible. Exposure to an asset class represented by an index is available through
 investable instruments based on that index. S&P Global Market Intelligence assumes no obligation to update the Content following publication in any form or format. The
 Content should not be relied on and is not a substitute for the skill, judgment and experience of the user, its management, employees, advisors and/or clients when making
 investment and other business decisions. S&P Global keeps certain activities of its divisions separate from each other in order to preserve the independence and
 objectivity of their respective activities. As a result, certain divisions of S&P Global may have information that is not available to other S&P Global divisions. S&P Global
 has established policies and procedures to maintain the confidentiality of certain non-public information received in connection with each analytical process.

 S&P Global may receive compensation for its ratings and certain analyses, normally from issuers or underwriters of securities or from obligors. S&P Global reserves the
 right to disseminate its opinions and analyses. S&P Global's public ratings and analyses are made available on its Web sites, www.standardandpoors.com (free of charge)
 and www.ratingsdirect.com (subscription), and may be distributed through other means, including via S&P Global publications and third-party redistributors. Additional
 information about our ratings fees is available at www.standardandpoors.com/usratingsfees.

To learn more about S&P Global Market Intelligence, please email us at SPGMIMarketingAPAC@spglobal.com   S&P Global Market Intelligence Asia-Pacific Markets Monthly – August 2020 | Page 26
You can also read