New Zealand Asian Responsible Gambling Report 2021
←
→
Page content transcription
If your browser does not render page correctly, please read the page content below

New Zealand Asian
                                                                  Responsible Gambling Report 2021
                                                                                                                                               May 2021

                                                                                                      Confidential - Do not duplicate or distribute in any form of
                                                                                                               communication without written permission from
                                                                                                                      Asian Family Services & Trace Research Ltd

                                                                                            Prepared by Dr Andrew Zhu | Director of Trace Research
Copyright © 2011- 2021 Trace Research Ltd. All Rights Reserved.                   Prepared for Kelly Feng | National Director of Asian Family Services
Gambling activities in the Distribution of Problem Gamblers Asians perceive that Asian Expressions of Self-Stigma about
(13.8%) by Ethnicity (>3%) Gambling by Asian Gamblers
last 12 months (76.5%) or Maori/Pacific
Bought lotto or instant scratch
67.8% Indian 54.4% Island (74.1%) gamblers are Disappointed in yourself 35.5%
tickets
stigmatised by society to a
Private games with friends for money 27.7%
Played gaming machines, or pokies 27.6%
Chinese 15.5% slightly greater level Guilty 27.8%
compared to a European That you lack
Played Casino table games 25.2% Filipino 8.7% gambler (65.7%). willpower/self-control
27.0%
Placed a bet with the TAB 23.9%
Online gambling and gaming 19.7% Ashamed 26.2%
According to New Zealand’s “The
Gambling Act 2003”, lotteries, prize
competitions and instant games are also
New Zealand Asian
Responsible Gambling
2021 Weak 21.3%
classified as parts of gambling. Are you
aware of this classification? Survey Top 3 Channels for Seeking
Gambling Support
Yes 53.5% No 46.5%
Problem Gambling Severity Top 5 Perceived Factors for Expressions of Public Stigma about From family or friends 51.3%
Classification within NZ’s Asian Developing Gambling Addiction Gamblers with Addiction
Through self-help
Population 34.9%
Lack of financial
58.6% Agree strategies
Approximately 71,736 NZ budgeting/plan
Asians are problem gamblers From a face-to-face
Have unrealistic beliefs 27.8%
65.9% support group
about winning at gambling
Loneliness 49.9%
Moderate-risk
gambler, 7.3%
Problem
Have an addictive
gambler, 61.4% Top 3 Help Seeking Barriers
13.8% personality
Low-risk Job-related stress 48.0% Are irresponsible with money
gambler, 57.9% Lack of awareness
49.3%
5.8% Non- regarding the severity of
gambler,
Certain personality Are always in debt problems
25.3% 51.8%
characteristics: being
competitive, or impulsive,
47.8% Limited knowledge of
or over-confident Are in denial about having a available services 46.7%
51.7%
Non-problem gambler, gambling problem
47.9% Environmental factors, Harmful gambling is
such as family or friend 47.3% hidden due to shame, 45.5%
influence pride and loss of face
Sample Size = 705 Asians in New Zealand ( +/-3.7%), including 527 gamblers Copyright © 2021 AFS & Trace Research Ltd. All rights reserved.
Executive Summary

Key Findings
Asian Gambling Behaviour - General Gambling Activities
   In total, 74.7% of Asians engaged in some forms of gambling activity in the last 12 months (a significant increase since 2020 – 66%). The most common
   activity is buying lotto or instant scratch tickets (67.8%). Other gambling activities occur significantly less often, with under a third taking part in these
   activities;
          Those aged 50+, and those earning $100K or more, are more likely to have never bought lotto or instant scratch tickets in the last 12 months. In contrast, those
          who are buying most regularly (i.e., at least twice a month) are Indians, those aged 30-49 years, and those earning $50-$100K incomes. Interestingly, there is a
          divide amongst Koreans as they over-index on never buying in the last 12 months, but also over-index on buying regularly (i.e., 5 or more times a week);
          Chinese and Filipinos, those aged 50+, and those earning $100K or more, are more likely to never have engaged in private games with friends for money, gaming
          machines or pokies, or Casino table games. In contrast, Indians, those aged 18-29 years, and those earning $50-$70K have engaged in all these gambling activities
          most regularly (i.e., at least twice a month);
          Chinese, those aged 50+, and those earning $100K or more, are more likely to have never placed a bet on any sports event with the NZ TAB in the last 12 months.
          In contrast, those who have done so regularly (i.e., at least twice a month) are more likely to be Indian, aged under 50 years, and earning $50-$100K incomes;
          Chinese and Korean, those aged 50+, and those earning $100K or more, are more likely to never have engaged with online gambling and gaming in the last 12
          months. In contrast, those who have done so regularly (i.e., at least twice a month) are more likely to be Indian or Filipino, aged 18-29 years, and earning $50-
          $100K incomes.

   Overall, 53.5% of Asians are aware of the Gambling Act’s classification of gambling for lotteries, prize competitions and instant games. Across ethnicity,
   Filipinos over-indexed (64.3%) on awareness of this classification whilst Chinese under-indexed (44.9%);
          It is quite concerning that there is still 55% of Chinese don’t know lotteries, prize competitions and instant games are also classified as a type of gambling activity;
          Across age, those who are younger (specifically 18-29 years) are more likely to be aware of the Gambling Act’s classification of gambling. And across income groups,
          those who earn up to $50K are less likely to be aware of the Gambling Act’s classification of gambling compared to other higher income groups;

                                                                                                                                                                                     3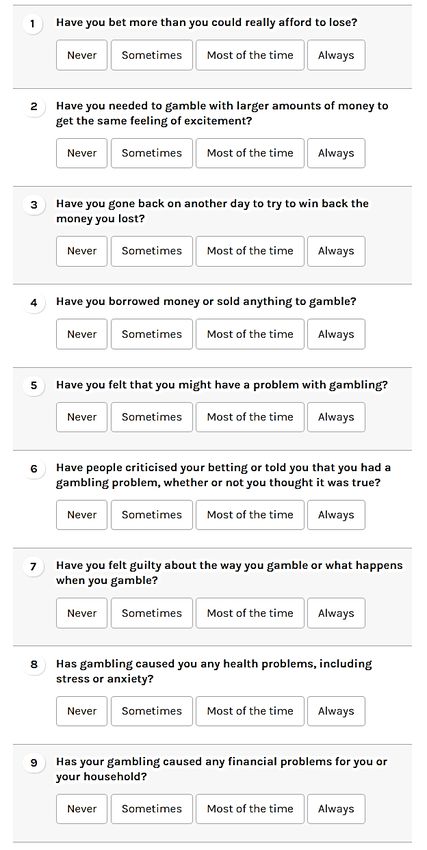
Executive Summary
Key Findings
Problem Gambling Severity Categorisation within the NZ Asian Population
   Among the gambling population, Problem gamblers make up 18.4%. However when assessing amongst all Asians in New Zealand, Problem gamblers make up 13.8%, and of this,
   54.4% come from the Indian community (see gamblers’ profiling slide 27-29);
           Chinese are more likely to be Non-gamblers or a Non-problem gambler whilst Indians are more likely to be Problem gamblers. Interestingly, Filipinos are divided in that they are both more
           likely to be Non-gamblers as well as a Moderate-risk gambler. Koreans are also divided where they are more likely to be Non-gamblers as well as a Low-risk gambler;
           Overall, Problem gamblers are more likely to be Indian, Male, aged under 50 years, and earning $50-$70K. Moderate-risk gamblers are more likely to be Filipino, 30-49 years, and
           earning $70-$100K. Low-risk gamblers are more likely to be Korean, and earning $50-$70K;
           Problem gamblers are more likely to engage in all 6 forms of gambling activity regularly (i.e., at least twice a month). Non-problem gamblers are more likely than all others to engage in
           buying lotto or instant scratch tickets less frequently (i.e., monthly or less). Low and Moderate-risk gamblers are more likely to engage in playing gaming machines or pokies 2-4 times a
           month;

Perceived Risk Factors for Developing an Addiction to Gambling
   On average, Asians believe that there are 4-5 perceived risk factors for developing an addiction to gambling. The top 3 are (1) lack of financial budgeting or planning, 58.6% (2)
   loneliness, 49.9%, and (3) job-related stress, 48%;
           Problem gamblers are more likely to think that the use of certain medications and ethnicity are risk factors for developing an addiction to gambling. Non-gamblers however, are more
           likely to think it is the presence of other addictions, and Low-risk gamblers are more likely to think it is certain personality characteristics;
           On average, Koreans perceive a higher number of risk factors for developing an addiction to gambling compared to other ethnicities;
           On average, those aged 65+ tend to perceive a higher number of risk factors for developing an addiction to gambling;

Asians’ Perceptions of Gambling Stigmatisation Amongst the General Public
   Asians perceive that society has much stronger levels of stigmatisation towards excessive gambling (78.7%) than recreational gambling (52.3%). They also perceive that Asian
   (76.5%) or Maori/Pacific Island (74.1%) gamblers are stigmatised by society to a greater level compared to a European gambler (65.7%);
           Among Problem gamblers, perceived societal stigmatisation towards excessive gambling is much higher than recreational gambling. There is however, little difference in perceived
           stigmatisation of the gambler’s ethnicity (i.e., all are stigmatised to a high degree);

   The top 3 expressions of public stigma about gamblers with addiction are (1) having unrealistic expectations about winning at gambling (65.9%), (2) having an addictive
   personality (61.4%), and (3) are irresponsible with money (57.9%). The weakest expression however, is that gamblers are likely to be of low socio-economic status (39.8%).

                                                                                                                                                                                                   4
Executive Summary
Key Findings
Self-Stigmatisation of Gambling
   78.9% of gamblers experience some form of self-stigmatisation. The top 3 that are experienced is feeling (1) disappointed in yourself, 35.5% (2) guilty, 27.8%, and (3) that you
   lack willpower/self-control, 27%;
           On average, Problem gamblers experience more self-stigmatisation, followed by Moderate-risk gamblers. Problem gamblers are more likely to feel ashamed, that they lack willpower/self-
           control, a loss of identity or feel like a different person, undeserving of good things, and socially unacceptable/an outcast;
           On average, Indian and Filipinos are likely to experience more self-stigmatisation. Indians are more likely to feel socially unacceptable/an outcast, whilst Filipinos are more likely to feel
           guilt and embarrassment. Koreans are more likely to feel weak, disappointed in oneself, and ashamed;
           On average, those who are younger (18-29 years) tend to experience more self-stigmatisation compared to those who are older (65+ years);

Channels for Seeking Gambling Support
   When it comes to seeking help for gambling problems, the top 3 sources Asians turn to are (1) family or friends, 51.3% (2) self-help strategies, 34.9%, and (3) face-to-face support
   groups, 27.8%. The traditional channels offered by Asian Family Services ranks 4th and 5th respectively, sitting at just under 30%;
           On average, Indians would use slightly more channels to deal with gambling problems. Specifically, they are more likely to opt for face-to-face support groups, or a residential
           treatment program. In contrast, Chinese are more likely to opt for self-help strategies and Koreans are more likely to opt for a gambling telephone line;
           On average, those aged 65+ are likely to use the most channels. In particular, they are more likely to opt for family or friends, a face-to-face specialist gambling counsellor, and a
           residential treatment program;

Perceived Barriers for Seeking Gambling Support
   As a whole, stigma-related barriers make up two-thirds (67.3%) of all barriers to seeking gambling support. At an individual level also, stigma-related barriers all fall within the
   top 7 barriers, which again points to its significance in preventing people from seeking help;
           Overall, Problem gamblers have the lowest proportion of stigma association. Interestingly however, they are more likely to say “insufficient social and financial resource to support
           treatment entry” is the key barrier to seeking gambling support. This highlights the significant role Asian Family Services can play in supporting Problem gamblers (i.e., services are free to
           those who have been affected by gambling harm). Moderate-risk gamblers are more likely to have “lack of awareness regarding the severity of problems” as a barrier, whilst Low-risk
           gamblers are more likely to excuse themselves from “the problem has not triggered health concerns.”
           Across the different ethnic groups, Indians are more likely to have insufficient social and financial resources to support treatment entry as a key barrier to seeking support. With Asian
           Family Services’ free services, the organisation is well placed to offer support. In contrast, the barriers for Koreans are more likely to be around awareness/knowledge of services, and
           feelings of shame, pride or loss of face;
           Across age, those 65+ have more barriers for seeking gambling support.

                                                                                                                                                                                                        5
Content

Section 1 Introduction & Methodology                                                                             7-10

Section 2 Asian Gambling Behaviour Activities | Problem Gambling Severity Categorisation | Addiction             11-35

Section 3 Perceived Stigmatisation of Gambling Public Stigmatisation |Self-Stigmatisation                        36-51

Section 4 Tackling Gambling Harm Channels for Seeking Gambling Support| Perceived Barriers for Seeking Support   52-64

                                                                                                                         6
Section 1
Introduction & Methodology
7Introduction – Research Background & Purpose
Asian Family Services (AFS) has deployed their first-year funding to generate public health and gambling addiction-related articles and
posters that tap into gambling harm and address equity issues for Asians in NZ. Building on the progress of their first year, AFS’s main
purpose for the second year is to 1) plan further engagement with gambling harm messaging by continuing to use evidence-based
approaches to measure AFS’s marketing efforts in gambling harm minimisation, and plan ahead, and 2) increase Asian gambling insights by
a) expanding their research scope into causes of gambling harm, cultural stigma issues, and online gambling/gaming among Asians, and b)
collect opinions from gamblers, and affected others around gambling harm and help-seeking barriers;
In order to develop valid and actionable media strategies to increase the public’s awareness of Asian Family Services (AFS) and to tailor
future services that meet the needs (i.e., gambling supports) of NZ’s Asian community, the New Zealand Asian Responsible Gambling
Survey was launched; AFS’s 2021-2022 media strategies will be developed based on research findings from this survey. Although “Asian” is
a term used to cover a homogeneous group of people, each ethnic group exhibits different habits hence AFS’s media strategy will prioritise
service delivery (i.e., minimising gambling harm campaigns) for each ethnic group differently.
8Methodology
In 2019, Trace Research Ltd conducted a telecommunication study (New Zealand broadband and online video streaming survey 2019),
which showcased that a large proportion of people (62% of Asians, and 76% of Chinese specifically) can no longer be reached by
landline. Thus, the representativeness of telephone surveys that are only based on a random sample of households with landline
service, has come under increased scrutiny;
The same telecommunication study also found that over 96.8% of Asians had access to both home broadband and 4G/5G data loaded
mobile phones in New Zealand, which was the highest level of ownership. An online survey is therefore the most appropriate and
effective method to reach the population of interest;
The questionnaire used in this research was collectively and specifically developed by Trace Research and problem gambling counsellors
from Asian Family Services. All scales adopted were empirically validated by academic studies. The study adhered to the guidelines of
the New Zealand Ethics Committee and was judged to be low risk therefore was approved for field study by Asian Family Services.
Participants gave written informed consent to participate electronically prior to the online survey;
Data for this report was independently collected by Trace Research Ltd, between 14th April and 28th April 2021;
The results of this study are based on an online survey distributed to a nationally representative group of Asians who live in New
Zealand. The ethnic Chinese sample was collected through Trace Research’s Chinese Immigrants Research Panel (by email invitation). All
other Asian ethnic samples were collected from Trace’s partner online panel. Quota sampling was used (according to the 2018 NZ Census, Asian
Adult population distribution) to ensure representativeness of all Asian ethnic groups;
The total sample size of this study is 705 (Asians who currently live in NZ). They are spread across 18 regions in New Zealand and originally
come from more than 14 Asian countries. The margin of error of this study is ±3.68% at the 95% confidence interval. A full sample
composition breakdown is provided in the following slide.
9Sample Composition
Gender % Count Location % Count Job Status % Count
Male 49.3% 348 Northland Region 1.1% 7
Female 50.7% 357 Retired 6.8% 48
Auckland Region 65.0% 458
Total 100.0% 705 Student 10.1% 71
Waikato Region - Hamilton 3.7% 26
Ethnicity1 % Count Waikato Region - other 1.5% 11 Unemployed 4.4% 31
Chinese 34.7% 244 Bay of Plenty Region 2.9% 20 Homemaker 6.4% 45
Indian 33.5% 236
Gisborne Region 0.1% 1
Filipino 10.2% 72 Self-employed 10.6% 75
Hawke's Bay Region 0.7% 5
Korean 5.0% 35 Full-time employed 52.6% 371
Taranaki Region 0.4% 3
Japanese 2.5% 18
Manawatu-Wanganui Region 2.3% 16 Part-time employed 9.1% 64
Sri Lankan 2.4% 17
Vietnamese 1.4% 10 Wellington Region 9.5% 67
Total 100.0% 705
Cambodian 1.4% 10 Tasman Region 0.3% 2
Asian other 9.1% 64 Marlborough Region 0.1% 1 Time Spent in NZ % Count
Total 100.0% 705 Canterbury Region - Christchurch 10.1% 71 Less than 1 year 1.0% 7
Canterbury Region - other 0.8% 6 1-5 years 17.4% 123
Age Groups % Count
Otago Region - Dunedin 0.9% 6
18-29 years 33.4% 235 6-10 years 21.5% 152
30-49 years 35.1% 248 Otago Region - Queenstown 0.1% 1
11-15 years 13.6% 96
50-64 years 23.4% 165 Otago Region - other 0.1% 1
Southland Region 0.5% 3 15 years or more 46.4% 327
65 years + 8.1% 57
Total 100.0% 705 Total 100.0% 705 Total 100.0% 705
Note: 1. Including 46 NZ born Asians (6.5% of total sample).
10Section 2
Asian Gambling Behaviour
11Section 2.1
Asian Gambling Behaviour
General Gambling Activities
12In total, 74.7% of Asians engaged in some form of gambling activity in the last 12 months. The most common activity is
buying lotto or instant scratch tickets. Other gambling activities occur significantly less often, with under a third taking
part in these activities.
Ranking of Gambling Activities in the Asian Community1
Bought lotto or instant scratch tickets #1 67.8%
Private games with friends for money (e.g., Cards & Mah-jong) 27.7%
In most Asian countries, the
lottery is promoted as a
Played gaming machines, or pokies 27.6% charitable act (as well as in
NZ). During an interview of
20 people in 2020, our study
found that no lotto player
Played Casino table games 25.2% perceived themselves as a
gambler. Instead they
perceived buying the lottery
as a way to give back to the
Placed a bet on any sports event with the New Zealand TAB 23.9% community, and further,
“not buying it” meant
missing the opportunity to
win a superior lifestyle.
Online gambling and gaming 19.7%
None of the above 25.3%
Note: 1. Q10. In the last 12 months, how often have you engaged in the following activities?
Base: Total sample
13Those aged 50+, and those earning $100K or more, are more likely to have never bought lotto or instant scratch tickets in
the last 12 months. In contrast, those who are buying most regularly (i.e., at least twice a month) are Indians, those aged
30-49 years, and those earning $50-$100K incomes. Interestingly, there is a divide amongst Koreans as they over-index
on never buying in the last 12 months, but also over-index on buying regularly.
In the last 12 months, how often have you engaged in the following activities?
Bought lotto or instant scratch tickets #1
By Major Asian Ethnic Groups* By Age By Income
100% 2.6% 0.7% 3.8% 3.8% 2.7% 0.6%
2.4% 3.2% 2.3% 2.4% 1.8%
4.2% 5.2%
8.0% 6.7%
8.7% 13.5% 9.0% 11.2%
90% 12.0%
18.0% 15.3% 14.4%
17.3% 21.6%
11.8%
22.3% 7.7% 17.0%
80% 20.1%
20.7% 18.4%
67.8% bought
11.6%
70% 22.7% lotto or instant
scratch tickets in
39.5%
60% the last 12
50.5% 39.6% 35.3%
21.2% 46.3% 46.9% months
39.5% 42.3%
50% 39.0% 40.1%
41.9%
29.6%
40%
30%
45.9% 43.8%
20% 39.3% 40.3%
33.2% 33.0% 33.2% 32.1% 32.2%
29.7% 29.1% 28.0%
24.7%
10%
0%
Chinese Indian Filipino Korean 18-29 years 30-49 years 50-64 years 65 years+ $50,000 and $50,001 to $70,001 to $100,001+ Total
under p.a. $70,000 p.a. $100,000 p.a. p.a.
Never Monthly or less 2-4 times a month 2-4 times a week 5 or more times a week
Note: 1. Q10. In the last 12 months, how often have you engaged in the following activities?
Base: Total sample *Other ethnicities excluded due to low base sizes
14Chinese and Filipinos, those aged 50+, and those earning $100K or more, are more likely to never have engaged in
private games with friends for money. In contrast, Indians, those aged 18-29 years, and those earning $50-$70K have
engaged in private games with friends for money most regularly (i.e., at least twice a month).
In the last 12 months, how often have you engaged in the following activities?
Private games with friends for money (e.g., Cards & Mah-jong) #2
By Major Asian Ethnic Groups* By Age By Income
100% 0.5%
0.2% 2.8% 2.9% 0.4%
3.3% 1.2% 0.6% 1.9% 1.1%
4.8% 4.6% 6.1% 3.5% 4.3% 5.1% 3.2%
5.9% 12.6% 5.2% 6.5% 5.0% 27.7% engage in
7.2% 10.7% 7.7%
90% 8.3% 7.7%
11.9% 10.0% private games
10.9% 11.4% 9.4%
9.9% 34.8% with friends for
80% 17.9% 15.8% 12.3% 15.7%
19.7% money
15.4%
70% 18.1% 20.0%
60%
50%
85.9% 83.9%
40% 82.6%
77.5% 74.8%
71.9% 72.9% 72.3%
65.2% 65.9% 67.7%
30% 62.3% 60.4%
20%
10%
0%
Chinese Indian Filipino Korean 18-29 years 30-49 years 50-64 years 65 years+ $50,000 and $50,001 to $70,001 to $100,001+ Total
under p.a. $70,000 p.a. $100,000 p.a. p.a.
Never Monthly or less 2-4 times a month 2-4 times a week 5 or more times a week
Note: 1. Q10. In the last 12 months, how often have you engaged in the following activities?
Base: Total sample *Other ethnicities excluded due to low base sizes
15Chinese and Filipinos, those aged 50+, and those earning $100K or more, are more likely to have never played gaming
machines or pokies in the last 12 months. In contrast, Indians, those aged 18-29 years, and those earning $50-$70K, are
playing gaming machines or pokies most regularly (i.e., at least twice a month).
In the last 12 months, how often have you engaged in the following activities?
Played gaming machines, or pokies #3
By Major Asian Ethnic Groups* By Age By Income
100% 0.2%
0.9% 2.2% 2.8% 1.6% 1.7% 0.8%
1.2% 1.8% 1.4% 3.3% 3.2% 2.1% 1.1%
2.6% 1.3% 3.7% 3.3% 3.7% 3.5%
5.4% 5.5% 6.2% 5.2% 4.9% 27.6% played
7.1% 13.3% 5.3% 5.3% 7.0% 6.2%
90% gaming
15.9% 8.5% 11.3% 13.1% 8.6% 11.6%
7.8% machines or
80% 18.8% 16.4% 16.9% pokies in the
23.8%
18.7% 16.6% last 12 months
26.8%
70% 23.2%
60%
50%
91.9%
40% 80.4% 81.0% 81.8% 81.3%
70.4% 73.2% 72.4%
65.2% 66.4% 66.1%
30% 60.0% 58.4%
20%
10%
0%
Chinese Indian Filipino Korean 18-29 years 30-49 years 50-64 years 65 years+ $50,000 and $50,001 to $70,001 to $100,001+ Total
under p.a. $70,000 p.a. $100,000 p.a. p.a.
Never Monthly or less 2-4 times a month 2-4 times a week 5 or more times a week
Note: 1. Q10. In the last 12 months, how often have you engaged in the following activities?
Base: Total sample *Other ethnicities excluded due to low base sizes
16Chinese and Filipinos, those aged 50+, and those earning $100K or more, are more likely to have never played Casino
table games in the last 12 months. In contrast, those who have played Casino table games most regularly (i.e., at least
twice a month) are more likely to be Indian, aged 18-29 years, and earning $50-$70K.
In the last 12 months, how often have you engaged in the following activities?
Played Casino table games #4
By Major Asian Ethnic Groups* By Age By Income
100% 2.0% 2.4% 2.6% 1.7% 0.7%
2.4% 0.8%
2.0% 1.8% 0.4%
2.4% 3.2% 2.8% 3.0% 0.8%
2.8%
4.1% 5.2% 2.2% 4.7% 3.8%
8.1% 6.4% 5.3% 5.3% 4.8% 25.2% have played
90% 13.5% 5.6% 16.4%
8.0% 5.8% Casino table games
14.5% in the last 12
19.5% 16.9%
80% 42.5%
20.0%
13.7% 26.1% months
20.3% 24.0%
70%
60%
50%
95.0%
89.4%
84.5% 81.8%
40% 78.7%
73.0% 72.0% 74.8%
70.5%
65.1% 63.5% 65.8%
30% 57.5%
20%
10%
0%
Chinese Indian Filipino Korean 18-29 years 30-49 years 50-64 years 65 years+ $50,000 and $50,001 to $70,001 to $100,001+ Total
under p.a. $70,000 p.a. $100,000 p.a. p.a.
Never Monthly or less 2-4 times a month 2-4 times a week 5 or more times a week
Note: 1. Q10. In the last 12 months, how often have you engaged in the following activities?
Base: Total sample *Other ethnicities excluded due to low base sizes
17Chinese, those aged 50+, and those earning $100K or more, are more likely to have never placed a bet on any sports
event with the NZ TAB in the last 12 months. In contrast, those who have done so regularly (i.e., at least twice a month)
are more likely to be Indian, aged under 50 years, and earning $50-$100K incomes.
In the last 12 months, how often have you engaged in the following activities?
Placed a bet on any sports event with the New Zealand TAB #5
By Major Asian Ethnic Groups* By Age By Income
100% 0.6% 3.1% 2.5% 0.9% 2.4% 1.6% 4.2% 2.1% 1.7%
2.0% 6.0% 2.2% 0.9%
0.9% 1.0% 2.1%
3.5% 3.3% 5.0% 3.6% 7.9% 23.9% have
7.2% 6.6% 5.4% 5.1%
10.8% 7.1% 16.5% 5.4% placed a bet on
90% 9.7% 23.4% 6.1%
16.4% 16.3% 14.0% any sports event
15.0%
80% 16.6% 18.6% with the NZ TAB
14.0% 22.7%
18.3%
70%
60%
50%
89.3%
86.0% 83.5%
40% 77.5% 76.6% 76.1% 78.1% 76.1%
70.5% 71.0% 70.4%
65.4% 66.2%
30%
20%
10%
0%
Chinese Indian Filipino Korean 18-29 years 30-49 years 50-64 years 65 years+ $50,000 and $50,001 to $70,001 to $100,001+ Total
under p.a. $70,000 p.a. $100,000 p.a. p.a.
Never Monthly or less 2-4 times a month 2-4 times a week 5 or more times a week
Note: 1. Q10. In the last 12 months, how often have you engaged in the following activities?
Base: Total sample *Other ethnicities excluded due to low base sizes
18Chinese and Korean, those aged 50+, and those earning $100K or more, are more likely to never have engaged with
online gambling and gaming in the last 12 months. In contrast, those who have done so regularly (i.e., at least twice a
month) are more likely to be Indian or Filipino, aged 18-29 years, and earning $50-$100K incomes.
In the last 12 months, how often have you engaged in the following activities?
Online gambling and gaming #6
By Major Asian Ethnic Groups* By Age By Income
100% 0.5% 1.0% 2.5% 2.0% 0.8% 1.7% 1.6% 19.7% have
2.8% 3.1% 3.8% 3.8% 3.6% 0.6% 3.0% 0.9% 2.2% 2.0%
5.8% 7.3% 2.2% engaged with
5.5% 3.3% 2.3% 2.3% 3.9% 3.1%
5.1% 6.8%
7.3% 12.9% online
90% 8.7% 9.0% 7.7%
11.0% 9.3%
7.8% gambling and
13.3% 9.3%
7.0% 12.1% 7.6% gaming
80% 11.1%
14.4% 12.8%
70%
60%
50% 97.0%
91.2% 92.7%
86.5%
83.2%
40% 77.9% 76.0% 78.6% 77.8% 80.3%
70.4% 73.5%
70.1%
30%
20%
10%
0%
Chinese Indian Filipino Korean 18-29 years 30-49 years 50-64 years 65 years+ $50,000 and $50,001 to $70,001 to $100,001+ Total
under p.a. $70,000 p.a. $100,000 p.a. p.a.
Never Monthly or less 2-4 times a month 2-4 times a week 5 or more times a week
Note: 1. Q10. In the last 12 months, how often have you engaged in the following activities?
Base: Total sample *Other ethnicities excluded due to low base sizes
19Overall, 53.5% of Asians are aware of the Gambling Act’s classification of gambling (i.e., lotteries). Across ethnicity,
Filipinos over-indexed on awareness of this classification whilst Chinese under-indexed. However, it is quite concerning
that there is still 55% of Chinese don’t know lotteries, prize competitions and instant games are also part of gambling.
Gambling ACT 2003 - Awareness1 by Major Asian Ethnic Group*
Lotteries (e.g., Lotto, Powerball), prize competitions and instant games (e.g., Instant Kiwi) are also classified as parts of gambling.
Are you aware of this classification?
100%
90%
35.7%
80%
45.0% 46.6% 46.5%
55.1%
70%
60%
50%
40%
64.3%
30%
55.0% 53.4% 53.5%
44.9%
20%
10%
0%
Chinese Indian Filipino Korean Total
Yes No
Note 1: Q11. According to New Zealand’s “The Gambling Act 2003”, lotteries (e.g., Lotto, Powerball), prize competitions and instant games (e.g., Instant Kiwi) are also
classified as parts of gambling. Are you aware of this classification? 20
Base: Total sample *Other ethnicities excluded due to low base sizesAcross age, those who are younger (specifically 18-29 years) are more likely to be aware of the Gambling Act’s
classification of gambling. And across income groups, those who earn up to $50K are less likely to be aware of the
Gambling Act’s classification of gambling compared to other income groups.
Gambling ACT 2003 - Awareness1
Lotteries (e.g., Lotto, Powerball), prize competitions and instant games (e.g., Instant Kiwi) are also classified as parts of gambling.
Are you aware of this classification?
By Age By Income
100%
90%
80% 37.7%
42.7% 41.4%
46.8% 49.1% 45.8%
50.0% 50.2%
70%
60%
Total level
50% 53.5%
40%
30% 62.3%
57.3% 58.6%
53.2% 50.9% 54.2%
50.0% 49.8%
20%
10%
0%
18-29 years 30-49 years 50-64 years 65 years + $50,000 and $50,001 to $70,001 to $100,001+ p.a.
under p.a. $70,000 p.a. $100,000 p.a.
Yes No
Note 1: Q11. According to New Zealand’s “The Gambling Act 2003”, lotteries (e.g., Lotto, Powerball), prize competitions and instant games (e.g., Instant Kiwi) are also
classified as parts of gambling. Are you aware of this classification? 21
Base: Total sampleSection 2.2
Asian Gambling Behaviour
Problem Gambling Severity Categorisation within the NZ Asian Population
22The Problem Gambling Severity Index (PGSI) 1
This study adopted the Problem Gambling Severity Index to assess Asian gamblers’
mental status and to inform AFS of the categorisation and quantification of
different types of Asian gamblers in New Zealand;
The Problem Gambling Severity Index (PGSI) is the standardised measure of at risk
behaviour in problem gambling. It is a tool based on research on the common
signs and consequences of problematic gambling. The PGSI asked participants
(n=527 gamblers) to self-assess their gambling behaviour over the past 12 months
by scoring themselves against nine questions. The response options comprised of
the following scores: never (score: 0); sometimes (score: 1); most of the time
(score: 2); always (score: 3);
Based on the analysis, gamblers were categorised into 4 groups: 1) non-problem
gambler; 2) low-risk gambler; 3) moderate-risk gambler; and 4) problem gambler.
It is important to note that categorisation through the PGSI is not the same as a
clinical diagnosis, as this requires an assessment by a clinician.
Note: 1. Q12. Please rate on each of the following items based on your personal experience. There is no right or wrong answer, and it is completely anonymous; Q13. Please rate each of
the following items relating to gambling harm based on your personal experience. There is no right or wrong answer, and it is completely anonymous.
Base: Q12. Q10 = engage in activity regularly (codes 3-5); Q13. Q12 = not never (codes 2-4) 23
Total Gamblers = 527Among the gambling population, Problem gamblers make up 18.4%. However when assessing amongst all Asians in New
Zealand, Problem gamblers make up 13.8%, and of this, 54.4% come from the Indian community.
NZ Asian Gambler Categories What do the categories mean2?
Including non-gambler to show the overall pattern
Non-problem gambler - Score: 0
• Non-problem gamblers gamble with no negative consequences.
Low-risk gambler - Score: 1–2
• Low-risk gamblers experience a low level of problems with few or no
identified negative consequences. For example, they may only
25.3% occasionally spend over their limit or feel guilty about their gambling.
47.9% Moderate-risk gambler - Score: 3–7
• Moderate-risk gamblers experience a moderate level of problems
leading to some negative consequences. For example, they may
sometimes spend more than they can afford, lose track of time or feel
guilty about their gambling.
13.8% Problem gambler - Score: 8 or above
• Problem gamblers gamble with negative consequences and a
Approximately 71,736 NZ possible loss of control. For example, they may often spend over their
Asians are problem gamblers
54.4% of them are from the 7.3% 5.8% limit, gamble to win back money, and feel stressed about their
Indian community gambling. Distribution within Gambler Population
Non-gambler Non-problem gambler Low-risk gambler Moderate-risk gambler Problem gambler
Note: 1. Q12. Please rate on each of the following items based on your personal experience. There is no right or wrong answer, and it is completely anonymous; Q13. Please rate each of
the following items relating to gambling harm based on your personal experience. There is no right or wrong answer, and it is completely anonymous.
Note: 2. Source – Victorian Responsible Gambling Foundation - https://responsiblegambling.vic.gov.au/for-professionals/health-and-community-professionals/problem-gambling-severity-
index-pgsi/#:~:text=The%20Problem%20Gambling%20Severity%20Index,on%20how%20to%20assist%20them.
Base: Q12. Q10 = engage in activity regularly (codes 3-5); Q13. Q12 = not never (codes 2-4) 24
Total Gamblers = 527Chinese are more likely to be Non-gamblers or a Non-problem gambler whilst Indians are more likely to be Problem
gamblers. Interestingly, Filipinos are divided in that they are both more likely to be Non-gamblers as well as a Moderate-
risk gambler. Koreans are also divided where they are more likely to be Non-gamblers as well as a Low-risk gambler.
NZ Asian Gambler Categories1 – by Major Asian Ethnic Groups*
100%
6.2% 7.7%
11.8% 13.8%
90% 6.0% 19.1% 22.4% 7.7%
26.9%
6.9% 31.2% 33.3% 34.5% 7.3%
80% 18.5%
5.1% 19.1% 5.8%
70% 3.7%
3.0%
60%
53.7%
50% 35.1% 32.9% 47.9%
47.8%
40%
30%
20%
31.7% 32.6%
27.2% 25.3%
10% 20.9%
0%
Chinese Indian Filipino Korean Total
Non-gambler Non-problem gambler Low-risk gambler Moderate-risk gambler Problem gambler
Note 1: Q12. Please rate on each of the following items based on your personal experience. There is no right or wrong answer, and it is completely anonymous; Q13. Please rate each of
the following items relating to gambling harm based on your personal experience. There is no right or wrong answer, and it is completely anonymous.
Base: Q12. Q10 = engage in activity regularly (codes 3-5); Q13. Q12 = not never (codes 2-4)
Total Gamblers = 527 *Other ethnicities excluded due to low base sizes 25Those aged 50+ and those earning $100K or more, are more likely to be Non-gamblers. Younger Asians (under 50 years),
and those earning $50-$100K are more likely to be gamblers who carry some form of risk (i.e., low/moderate risk or
problem gambler).
NZ Asian Gambler Categories1
By Age By Income
100% 1.5%
0.0%
4.2%
5.8% 7.3%
5.9% 11.9% 15.2% 14.3% 13.8%
90% 19.0% 18.0% 18.6% 20%
21.9% 22.7%
28.3% 8.5% 26.9%
6.7% 31.5% 2.0%
35.5% 3.7% 7.3%
80% 3.3% 41.4%
6.8% 10.4% 14.7% 5.8%
2.5% 7.1%
70% 1.6%
7.1%
58.3% 11.6%
60%
48.2% 44.4%
52.3%
50% 47.9%
48.3% 44.5%
44.8%
40% 36.8%
30%
20%
33.3% 34.3% 35.5%
23.3% 25.8% 24.0% 25.3%
10% 19.7% 21.7%
0%
18-29 years 30-49 years 50-64 years 65 years + $50,000 and under $50,001 to $70,001 to $100,001+ p.a. Total
p.a. $70,000 p.a. $100,000 p.a.
Non-gambler Non-problem gambler Low-risk gambler Moderate-risk gambler Problem gambler
Note 1: Q12. Please rate on each of the following items based on your personal experience. There is no right or wrong answer, and it is completely anonymous; Q13. Please rate each of the
following items relating to gambling harm based on your personal experience. There is no right or wrong answer, and it is completely anonymous.
Base: Q12. Q10 = engage in activity regularly (codes 3-5); Q13. Q12 = not never (codes 2-4)
Gamblers = 527 26Overall, Problem gamblers are more likely to be Indian, Male, aged under 50 years, and earning $50-$70K. Moderate-risk
gamblers are more likely to be Filipino, 30-49 years, and earning $70-$100K. Low-risk gamblers are more likely to be
Korean, and earning $50-$70K.
NZ Asian Gambler Profiling - 1
Including non-gambler to show the overall pattern
Non-gambler Non-problem gambler Low-risk gambler Moderate-risk gambler Problem gambler
Ethnicity Chinese 37.3% 38.9% 41.5% 28.6% 15.5%
Indian 27.7% 33.4% 21.7% 23.1% 54.4%
Filipino 12.7% 7.5% 5.2% 25.7% 8.7%
Korean 6.4% 3.4% 16.5% 5.3% 2.8%
Gender Male 42.8% 46.2% 48.0% 65.0% 64.1%
Female 57.2% 53.8% 52.0% 35.0% 35.9%
Age 18-29 years 30.8% 33.7% 14.4% 31.3% 46.1%
30-49 years 27.4% 32.9% 43.1% 50.0% 45.9%
50-64 years 30.9% 23.6% 34.3% 18.8% 7.1%
Income $50,000 and under p.a. 29.1% 31.1% 16.4% 26.2% 24.6%
$50,001 to $70,000 p.a. 18.8% 16.9% 44.2% 21.4% 36.1%
$70,001 to $100,000 p.a. 16.0% 15.6% 4.6% 33.8% 18.6%
$100,001+ p.a. 20.8% 13.7% 9.5% 4.1% 15.4%
Prefer not to say 15.3% 22.7% 25.3% 14.6% 5.3%
Significantly higher than all other groups
Significantly lower than all other groups
Note: column % comparisons
27Both Moderate-risk gamblers and Problem gamblers are more likely to be aware of Lotteries, prize competitions and
instant games being classified as parts of gambling. However only problem gamblers are more likely to be aware of Asian
Family Services.
NZ Asian Gambler Profiling -2
Including non-gambler to show the overall pattern
Non-gambler Non-problem gambler Low-risk gambler Moderate-risk gambler Problem gambler
Classifications - Frequency Recreational Gambler - Lite 84.0%
Recreational Gambler - Frequent 16.0% 100% 100%
Problem Gambler - Frequent 100%
Classifications - Type Lotto only player 44.6% 32.5%
Multi-games gambler 55.4% 67.5% 100% 100%
Asian Family Services Yes 21.6% 26.7% 31.7% 32.0% 57.3%
Brand Awareness
No 78.4% 73.3% 68.3% 68.0% 42.7%
Lotteries, prize competitions Yes 40.3% 53.0% 39.9% 71.1% 76.2%
and instant games are also
classified as parts of
gambling. Are you aware of
this classification? No 59.7% 47.0% 60.1% 28.9% 23.8%
Significantly higher than all other groups
Significantly lower than all other groups
Note: column % comparisons
28Problem gamblers are more likely to engage in all 6 forms of gambling activity regularly (i.e., at least twice a month). Non-
problem gamblers are more likely than all others to engage in buying lotto or instant scratch tickets less frequently (i.e., monthly
or less). Low and Moderate-risk gamblers are more likely to engage in playing gaming machines or pokies 2-4 times a month.
NZ Asian Gambler Profiling-3 Ranking of Games
that Problem
Gamblers
Non-problem gambler Low-risk gambler Moderate-risk gambler Problem gambler Frequently play
Placed a bet on any sports event with the New Zealand TAB Never 82.2% 79.1% 66.4% 18.9%
Monthly or less 17.2% 14.7% 19.7% 28.9% #5
2-4 times a month 0.5% 0.0% 3.8% 33.2%
2-4 times a week 0.0% 0.0% 1.6% 14.1%
5 or more times a week 0.1% 6.3% 8.5% 4.9%
Bought lotto or instant scratch tickets Never 8.5% 11.4% 13.6% 8.9%
#1
Monthly or less 76.9% 2.5% 22.0% 27.0%
2-4 times a month 10.3% 75.0% 47.9% 30.7%
2-4 times a week 2.6% 11.1% 11.2% 29.1%
5 or more times a week 1.7% 0.0% 5.3% 4.4%
Played Casino table games Never 78.5% 78.1% 66.0% 19.1%
#4
Monthly or less 20.5% 18.3% 26.8% 29.4%
2-4 times a month 0.5% 0.9% 3.5% 30.4%
2-4 times a week 0.5% 2.7% 3.8% 15.1%
5 or more times a week 0.0% 0.0% 0.0% 5.9%
Played gaming machines, or pokies Never 75.3% 74.1% 60.2% 17.2%
#2
Monthly or less 23.5% 6.4% 21.4% 26.7%
2-4 times a month 0.9% 19.5% 12.8% 27.0%
2-4 times a week 0.3% 0.0% 5.6% 21.0%
5 or more times a week 0.0% 0.0% 0.0% 8.1%
Private games with friends for money (e.g., Cards & Mah-jong) Never 78.0% 68.6% 48.8% 15.6%
Monthly or less 20.8% 17.4% 28.7% 19.5% #3
2-4 times a month 1.2% 9.4% 20.9% 36.6%
2-4 times a week 0.0% 4.6% 1.6% 20.2%
5 or more times a week 0.0% 0.0% 0.0% 8.1%
Online gambling and gaming Never 87.8% 94.4% 73.1% 16.1%
Monthly or less 11.4% 4.7% 4.4% 23.3% #6
2-4 times a month 0.6% 0.9% 9.6% 41.9%
2-4 times a week 0.2% 0.0% 9.2% 9.0%
5 or more times a week 0.0% 0.0% 3.8% 9.7%
Significantly higher than all other groups
Note: column % comparisons
Significantly lower than all other groups
29Section 2.3
Asian Gambling Behaviour
Perceived Risk Factors for Developing an Addiction to Gambling
30On average, Asians believe that there are 4-5 perceived risk factors for developing an addiction to gambling. The top 3
are (1) lack of financial budgeting or planning, (2) loneliness, and (3) job-related stress.
Ranking of Perceived Risk Factors for Developing an Addiction to Gambling1
#1 Lack of financial budgeting/plan 58.6%
#2 Loneliness 49.9%
#3 Job-related stress 48.0%
Certain personality characteristics: being competitive, or impulsive, or risk-taking,… 47.8%
Environmental factors, such as family or friend influence 47.3%
The presence of other addictions, such as alcohol or drugs 42.0%
Emotional upheaval, such as feeling in a low mood or anxious 40.4%
Mental health disorders, such as anxiety, depression or bipolar 34.1%
Age, such as younger/older people may have a much higher participation rate 24.9%
Traumatic circumstances 24.4%
Retirement 15.1%
Gender, such as a certain sex group is more likely to become problem gamblers 14.4%
Ethnicity 13.6%
The use of certain medications (e.g., medicines used to treat Parkinson's disease… 12.8%
Menopause 4.6%
Other 1.5%
Note: 1. Q14. Excessive Gambling is harmful to psychological and physical health. People who live with this addiction may experience depression, migraine, distress, intestinal disorders,
and other anxiety-related problems. In general, which of the following items do you think increases the risk of developing an addiction to gambling? Please select all that apply.
Base: Total sample
31Problem gamblers are more likely to think that the use of certain medications and ethnicity are risk factors for developing
an addiction to gambling than other groups. Non-gamblers however, are more likely to think it is the presence of other
addictions, and Low risk-gamblers are more likely to think it is certain personality characteristics.
Perceived Risk Factors for Developing an Addiction to Gambling1
80% by Type of Gambler Legend ranked by total risk factors
68.4% Lack of financial budgeting/plan
70% 64.5% 68.7%
Loneliness
58.4% 66.0%
60% 57.3% Job-related stress
52.5% 54.0% 57.3% Certain personality characteristics: being competitive, or impulsive, or risk-taking, or over-
53.7% confident
53.3%
50% 51.1% 51.0% 50.5% Environmental factors, such as family or friend influence
49.8%
43.3%46.7% The presence of other addictions, such as alcohol or drugs
47.7% 43.3% 51.9%
42.9%
41.6% 41.0% 36.7% Emotional upheaval, such as feeling in a low mood or anxious
40% 39.3% 40.0%
34.9% Mental health disorders, such as anxiety, depression or bipolar
35.7% 36.2%
34.8%
30.1% Age, such as younger/older people may have a much higher participation rate
30%
27.4% Traumatic circumstances
25.1%
25.3% Retirement
20% 25.0%
22.6% Gender, such as a certain sex group is more likely to become problem gamblers
Ethnicity
10% 9.3% 9.2% 9.6% The use of certain medications (e.g., medicines used to treat Parkinson's disease and restless leg
6.0% syndrome have been associated with the development of this disorder)
Menopause
0%
Other
Non-gambler Non-problem gambler Low-risk gambler Moderate-risk gambler Problem gambler
Average number of risk
4.9 5.1 4.4 4.8 3.7
factors selected
Note: 1. Q14. Excessive Gambling is harmful to psychological and physical health. People who live with this addiction may experience depression, migraine, distress, intestinal disorders,
and other anxiety-related problems. In general, which of the following items do you think increases the risk of developing an addiction to gambling? Please select all that apply.
Base: Total sample
32On average, Koreans perceive a higher number of risk factors for developing an addiction to gambling compared to other
ethnicities. In particular, they are more likely to perceive a lack of financial budgeting/planning, job-related stress, the
presence of other addictions, and age as risk factors for developing an addiction to gambling. While majority of Chinese
believe that environmental factors, such as family or friend influence is the key driving factor.
Perceived Risk Factors for Developing an Addiction to Gambling1
90% by Major Asian Ethnic Groups*
Legend ranked by total risk factors
80% 80.2%
Lack of financial budgeting/plan
Loneliness
70%
Job-related stress
60.0% 60.1%
60% 58.4% 57.5% Certain personality characteristics: being competitive, or impulsive, or risk-taking, or
59.4% over-confident
Environmental factors, such as family or friend influence
54.1% 54.0%
50% 52.4% 47.2% The presence of other addictions, such as alcohol or drugs
51.2% 43.6% 46.7%
46.4% 46.4% 46.6%
Emotional upheaval, such as feeling in a low mood or anxious
40% 40.5% 42.6% 38.7% Mental health disorders, such as anxiety, depression or bipolar
32.8% Age, such as younger/older people may have a much higher participation rate
30%
Traumatic circumstances
Retirement
20%
Gender, such as a certain sex group is more likely to become problem gamblers
Ethnicity
10%
The use of certain medications (e.g., medicines used to treat Parkinson's disease and
restless leg syndrome have been associated with the development of this disorder)
Menopause
0%
Chinese Indian Filipino Korean Other
Average number of
4.8 4.7 4.9 5.1
risk factors selected
Note: 1. Q14. Excessive Gambling is harmful to psychological and physical health. People who live with this addiction may experience depression, migraine, distress, intestinal disorders,
and other anxiety-related problems. In general, which of the following items do you think increases the risk of developing an addiction to gambling? Please select all that apply.
Base: Total sample *Other ethnicities excluded due to low base sizes
33On average, those aged 65+ tend to perceive a higher number of risk factors for developing an addiction to gambling. In
particular, they are more likely than other age groups to perceive environmental factors, mental health disorders,
retirement, gender, and menopause as risk factors for developing an addiction to gambling. In contrast, 18-29 year old’s
are more likely to think job-related stress and lack of financial budgeting/plan are key risk factors.
Perceived Risk Factors for Developing an Addiction to Gambling1
70% by Age 63.5% Legend ranked by total risk factors
60.7% 63.6% Lack of financial budgeting/plan
60% 60.0% 57.4% 62.0%
56.6% Loneliness
56.6%
55.1%
53.0% Job-related stress
50% 48.1% Certain personality characteristics: being competitive, or impulsive, or risk-taking, or
45.7% 47.2% over-confident
45.9% 46.5%
45.4% 45.4% 45.5% Environmental factors, such as family or friend influence
43.0%
42.1% 43.1%
43.5% 41.6%
40% 39.9% The presence of other addictions, such alcohol or drugs
Emotional upheaval, such as feeling in a low mood or anxious
Mental health disorders, such as anxiety, depression or bipolar
30%
Age, such as younger/older people may have a much higher participation rate
Traumatic circumstances
20%
Retirement
Gender, such as a certain sex group is more likely to become problem gamblers
10% Ethnicity
The use of certain medications (e.g., medicines used to treat Parkinson's disease and
restless leg syndrome have been associated with the development of this disorder)
Menopause
0%
18-29 years 30-49 years 50-64 years 65 years + Other
Average number of
4.9 4.4 4.8 6.0
risk factors selected
Note: 1. Q14. Excessive Gambling is harmful to psychological and physical health. People who live with this addiction may experience depression, migraine, distress, intestinal disorders,
and other anxiety-related problems. In general, which of the following items do you think increases the risk of developing an addiction to gambling? Please select all that apply.
Base: Total sample
34Those earning more than $70K are more likely to perceive a lack of financial budgeting/planning as a risk factor for
developing an addiction to gambling. In contrast, those earning $70K or less are more likely to perceive loneliness as a
risk factor.
Perceived Risk Factors for Developing an Addiction to Gambling1
70% by Income
62.7% Legend ranked by total risk factors
62.2%
60% Lack of financial budgeting/plan
54.7% 54.0% 54.0% 57.0%
54.1% 53.4% Loneliness
52.0% 51.5% Job-related stress
50%
Certain personality characteristics: being competitive, or impulsive, or risk-taking, or over-
44.1% 46.5% confident
42.3%
43.4% Environmental factors, such as family or friend influence
40% 40.7% The presence of other addictions, such as alcohol or drugs
35.7% Emotional upheaval, such as feeling in a low mood or anxious
30% Mental health disorders, such as anxiety, depression or bipolar
Age, such as younger/older people may have a much higher participation rate
Traumatic circumstances
20%
Retirement
Gender, such as a certain sex group is more likely to become problem gamblers
10% Ethnicity
The use of certain medications (e.g., medicines used to treat Parkinson's disease and restless
leg syndrome have been associated with the development of this disorder)
Menopause
0%
$50,000 and under p.a. $50,001 to $70,000 p.a. $70,001 to $100,000 p.a. $100,001+ p.a. Other
Average number of
5.0 4.5 4.7 4.8
risk factors selected
Note: 1. Q14. Excessive Gambling is harmful to psychological and physical health. People who live with this addiction may experience depression, migraine, distress, intestinal disorders,
and other anxiety-related problems. In general, which of the following items do you think increases the risk of developing an addiction to gambling? Please select all that apply.
Base: Total sample
35Section 3
Perceived Stigmatisation of Gambling
36Section 3.1
Perceived Stigmatisation of Gambling
Asians’ Perceptions of Gambling Stigmatisation Amongst the General Public
37Asians perceive that society has much stronger levels of stigmatisation towards excessive gambling than recreational
gambling. They also perceive that Asian or Maori/Pacific Island gamblers are stigmatised by society to a slightly greater
level compared to a European gambler.
Asian Perceptions of Gambling Stigmatisation1
5 conditions were tested - How much stigma do you think society attach to each of the following conditions in New Zealand?
100%
9.9%
90% 18.0%
28.2% 30.0%
80% 40.6%
52.3%
70% 42.4% 65.7%
74.1% 76.5%
60% 78.7%
47.7%
50% 45.9% 46.5%
40% 38.1%
30%
47.6%
20%
34.3%
25.9% 23.6%
10% 21.3%
0%
Recreational gambling Excessive gambling A European gambler A Maori/Pacific Island An Asian gambler
gambler
No stigma Some stigma A lot of stigma
Note: 1. Q15. Stigma means that people are judged negatively by society because of a characteristic or condition that they have. How much stigma do you think society attach to each of
the following conditions in New Zealand? Note that this question refers to your perception of other people’s views, not your own views.
Base: Total sample
38Indian perceptions of societal stigmatisation towards gambling follows a similar trend to all Asians, however levels of
perceived stigmatisation is heightened to an even greater extent.
Asian Perceptions of Gambling Stigmatisation1 Amongst Indian Community
5 conditions were tested - How much stigma do you think society attach to each of the following conditions in New Zealand?
100%
90% 15.8%
26.2%
35.1% 37.9%
80%
48.0%
70% 62.8%
73.5%
60% 47.0% 81.0% 81.9%
88.6%
50% 47.3%
40% 45.9% 44.0%
30% 40.6%
20% 37.2%
26.5%
10% 18.9% 18.2%
11.5%
0%
Recreational gambling Excessive gambling A European gambler A Maori/Pacific Island An Asian gambler
gambler
No stigma Some stigma A lot of stigma
Note: 1. Q15. Stigma means that people are judged negatively by society because of a characteristic or condition that they have. How much stigma do you think society attach to each of
the following conditions in New Zealand? Note that this question refers to your perception of other people’s views, not your own views.
Base: Total sample
39Among Problem gamblers, perceived societal stigmatisation towards excessive gambling is much higher than recreational
gambling. There is however, little difference in perceived stigmatisation of the gambler’s ethnicity (i.e., all are stigmatised
to a high degree).
Asian Perceptions of Gambling Stigmatisation1 Amongst Problem Gamblers
5 conditions were tested - How much stigma do you think society attach to each of the following conditions in New Zealand?
100%
14.8%
90% 23.0%
28.3%
34.5% 35.5%
80%
70%
67.0%
60% 52.2% 81.6% 79.5%
83.6%
85.0%
50% 56.5%
55.3%
40% 50.5% 46.1%
30%
20%
33.0%
10% 18.4% 20.5% 16.4%
15.0%
0%
Recreational gambling Excessive gambling A European gambler A Maori/Pacific Island An Asian gambler
gambler
No stigma Some stigma A lot of stigma
Note: 1. Q15. Stigma means that people are judged negatively by society because of a characteristic or condition that they have. How much stigma do you think society attach to each of
the following conditions in New Zealand? Note that this question refers to your perception of other people’s views, not your own views.
Base: Total sample
40The top 3 expressions of public stigma about gamblers with addiction are (1) having unrealistic expectations about
winning at gambling, (2) having an addictive personality, and (3) are irresponsible with money. The weakest expression
however, is that gamblers are likely to be of low socio-economic status.
Ranking of Asian Perceptions of Gambling Stigmatisation Amongst the General Public1
Proportion of Agreement with the statement Mean (out of 5)
#1 Have unrealistic beliefs about winning at gambling 65.9% 3.8
#2 Have an addictive personality 61.4% 3.6
#3 Are irresponsible with money 57.9% 3.5
Are always in debt 51.8% 3.4
Are in denial about having a gambling problem 51.7% 3.4
Feel no guilt about how much they lose at gambling 43.3% 3.2
Have no concern for their families 41.5% 3.2
Are likely to be of low socio-economic status 39.8% 3.2
Note: 1. Q16. How strongly do you agree or disagree that most people believe the following statements about gamblers with addictions? Note that this question refers to your perception
of other people’s views, not your own views. 1 = Strongly Disagree, and 5 = Strongly Agree
Base: Total sample
41Across the different types of gamblers, Non-gamblers’ expressions of public stigma about gamblers with addiction tends
to be higher and Problem gamblers lower. The greatest difference in expressions between Non-gamblers and Problem
gamblers lies with ‘having unrealistic beliefs about winning at gambling’ and ‘are irresponsible with money.’
Asian Perceptions of Gambling Stigmatisation Amongst the General Public1
4.5 It is very obvious that non-gamblers tend to
agree more on statements that stigmatise
by Type of Gambler
gamblers, hence a quarter of Asians strongly Legend ranked by total mean scores
discriminate against gamblers with addictions
Have unrealistic beliefs about winning at gambling
4.1
4.0 3.9 Have an addictive personality
3.9
3.8 Are irresponsible with money
3.6 3.6 3.7
3.6
Are always in debt
3.6
3.5
3.5 3.5 3.5 3.5
Are in denial about having a gambling problem
3.4 3.4 3.4
3.3
3.3 3.3 3.3 3.3 3.3
Feel no guilt about how much they lose at gambling
3.2 3.2 3.2 3.2
3.1
3.1 3.1 3.1 3.1
Have no concern for their families
3.0 3.0 3.0
2.9 Are likely to be of low socio-economic status
2.5
Non-gambler Non-problem gambler Low-risk gambler Moderate-risk gambler Problem gambler
Note: 1. Q16. How strongly do you agree or disagree that most people believe the following statements about gamblers with addictions? Note that this question refers to your perception
of other people’s views, not your own views. 1 = Strongly Disagree, and 5 = Strongly Agree
Base: Total sample
42On average, Filipinos’ expressions of public stigma about gamblers with addiction tend to be the highest. Across the
statements, they have the highest ratings for the statements except for ‘having unrealistic beliefs about winning at
gambling,’ where Chinese have a higher rating.
Asian Perceptions of Gambling Stigmatisation Amongst the General Public1
4.5 by Major Asian Ethnic Groups*
Legend ranked by total mean scores
Have unrealistic beliefs about winning at gambling
4.1
4.0 3.9 Have an addictive personality
3.8 3.9
Are irresponsible with money
3.7 3.6 3.8 3.7
3.5 3.6 Are always in debt
3.5
3.5 3.5 3.5 3.5
3.4 3.4 3.4 3.4 Are in denial about having a gambling problem
3.3 3.3 3.3
3.2 Feel no guilt about how much they lose at gambling
3.2 3.2 3.2
3.1 3.1 3.1
Have no concern for their families
3.0 3.0 3.0
Are likely to be of low socio-economic status
2.5
Chinese Indian Filipino Korean
Note: 1. Q16. How strongly do you agree or disagree that most people believe the following statements about gamblers with addictions? Note that this question refers to your perception
of other people’s views, not your own views. 1 = Strongly Disagree, and 5 = Strongly Agree
Base: Total sample *Other ethnicities excluded due to low base sizes
43Older peoples’ (i.e., aged 50 or more) expressions of public stigma about gamblers with addiction, tend to be higher than
those who are younger. The greatest gaps in expressions of public stigma is linked to (1) are always in debt, (2) are
irresponsible with money, and (3) are in denial about having a gambling problem.
Asian Perceptions of Gambling Stigmatisation Amongst the General Public1
4.5 by Age
Legend ranked by total mean scores
Have unrealistic beliefs about winning at gambling
4.0
4.0 Have an addictive personality
3.8 3.9
3.8 3.8 Are irresponsible with money
3.7
3.7 3.7 3.7
3.6
3.6 3.5 3.6 Are always in debt
3.5 3.5 3.5
Are in denial about having a gambling problem
3.3 3.4 3.4
3.3 3.3 3.3
Feel no guilt about how much they lose at gambling
3.2 3.2 3.2
3.1 3.1 Have no concern for their families
3.0 3.0
Are likely to be of low socio-economic status
2.5
18-29 years 30-49 years 50-64 years 65 years +
Note: 1. Q16. How strongly do you agree or disagree that most people believe the following statements about gamblers with addictions? Note that this question refers to your perception
of other people’s views, not your own views. 1 = Strongly Disagree, and 5 = Strongly Agree
Base: Total sample
44You can also read