FY2021 Half year results presentation - JAPARA HEALTHCARE - AFR
←
→
Page content transcription
If your browser does not render page correctly, please read the page content below
JAPARA HEALTHCARE
FY2021
Half year results presentation

24 February 2021

Contents

01 Overview                            3

02 Financial and operational summary   7

03 Real estate activity                13

04 Industry commentary                 18

05 Summary and outlook                 20

06 Appendices                          22
01

Overview
Half year overview                                                                                                                                                                                   4

Resident and staff care and wellbeing has been
paramount during a COVID-19 affected period
Summary                                                                                                                                       Key metrics
• Japara’s focus on care and resident and staff wellbeing underpinned                                                               STATUTORY REVENUE                NET RAD / ILU INFLOWS
  our approach during a challenging six months
• The impact of COVID-19 was extreme throughout the industry and on
                                                                                                                                    $ 220.3m                         $ 2.4m
  the business                                                                                                                      Up 3.6% on 1H FY2020 primarily   $15.7m RAD uplift from new
                                                                                                                                    due to increased Government      developments with mature home
• The business invested significant funds, resources and time in                                                                    payments                         outflows of $11.3m
  preparing for, and managing, COVID-19 outbreaks
• In the short term, occupancy reduced and the cost of operating
                                                                                                                                    RECURRING EBITDA1                AVERAGE OCCUPANCY2
  increased, with both now stabilising
• Notwithstanding tough conditions, ongoing growth activities provided                                                              $ 15.0m                          89.2%
  incremental earnings and improved living environments for residents
                                                                                                                                    Down 29% on 1H FY2020 due to     1H FY2021 occupancy2 weaker
                                                                                                                                    lower occupancy and ‘negative    primarily due to COVID-19.
• Lenders remain supportive with balance sheet strength and liquidity                                                               jaws’                            Currently 87.3%3
  maintained
• Company focus is now on occupancy recovery and continuing to
  embed learnings into ongoing care practices                                                                                       STATUTORY NET LOSS4              NET DEBT

• In light of the financial results, no interim dividend has been determined                                                        $ 9.5m                           $ 208.0m
                                                                                                                                    Lower earnings combined with     $48.0m core debt at 31
                                                                                                                                    higher depreciation, interest    December 2020 with $137.0m of
                                                                                                                                    expense and tax provision        available cash and debt

1. Recurring EBITDA is a measure consisting of earnings before interest, tax, depreciation and amortisation and net non-recurring
   items as set out on page 8
2. Average occupancy adjusts for places ramping up at new developments and places offline for refurbishment
3. As at 19 February 2021
4. Loss attributable to members of the Group
COVID-19 summary                                                                                                                                    5

Early preparation and investment, a focus on resident connection and support and continuous
improvement underpinned our response to the Victorian ‘second wave’

                     Summary    •   Japara has 33 Homes in Victoria including 21 within greater metropolitan Melbourne and six in Geelong and
                                    the surrounding area
                                •   During the period of high COVID-19 community transmission in Victoria from July to October 2020,
                                    Japara’s residents, staff and business were impacted despite tight biosecurity measures in place
                                •   Outbreaks affected five Homes: Sunbury, Doncaster East, Brighton, Mount Waverley and Windsor
                                •   The business witnessed a decline in occupancy until early October 2020, along with increased expenditure
                                    on additional staff to bolster rosters, training and infection control
                                     ‒ Staff required to isolate impacted rostering and increased agency usage
                                     ‒ Primary worksite restrictions also impacted rostering
                                     ‒ Infection control protocols, including personal protective equipment requirements, increased costs

                                •   Key measures implemented from March 2020 positioned the business to respond to the Victorian ‘second
                     Approach       wave’
                                •   Decisions to limit infection risk were required including restrictions on visitation and implementing single site
                                    working arrangements
                                •   Significant investment in infection control and prevention assisted in minimising outbreaks and containing
                                    them when they occurred. Detailed outbreak management plans were also put into practice
                                •   Programs to ensure ongoing resident connection with families and community groups were implemented,
                                    and lifestyle and wellbeing programs changed, to meet the new environment
                                •   Improvements in our clinical approach were implemented as the year progressed and the industry and
                                    company learned
                                •   Our clinical governance framework has been refined
                                •   Ongoing vigilance is required as the business and industry commence the COVID-19 vaccine rollout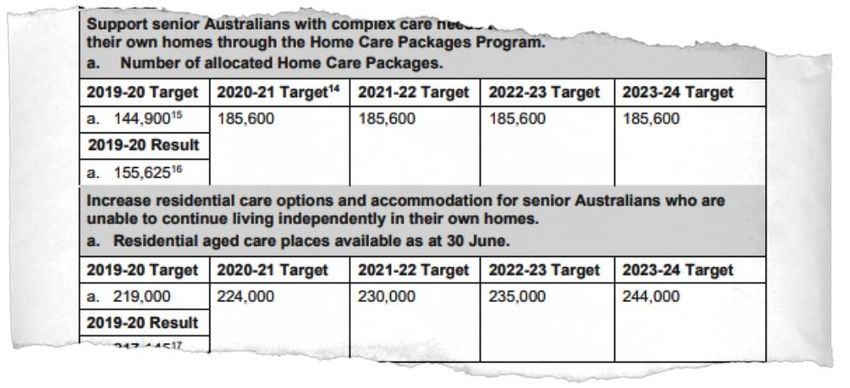
COVID-19 impact                                                                                                                                                  6

Lower occupancy and higher COVID-19 costs had a material affect on financial performance
with costs now normalising and occupancy stabilised

                                      Business    •   COVID-19 has led to lower occupancy, higher costs and lower earnings and cash flow than expected
                                        impact    •   Occupancy was affected by limitations on tours, fewer referrals from the hospital system and reduced
                                                      consumer preference for residential aged care, partly due to isolation requirements on admission
                                                  •   The decline in occupancy occurred during August and September, with total resident numbers remaining
                                                      flat since early October 2020 and falling by 202 places over the half year with a spot occupancy rate of
                                                      87.1% at 31 December 2020
                                                  •   RAD inflows have reduced due to the lower occupancy

                                     Revenues     •   Lower occupancy reduced EBITDA by ~$7.4m compared to the prior corresponding period
                                     and costs
                                                  •   Incremental funding of $5.1m was received from the COVID-19 Support Payment and the Temporary
                                                      Additional ACFI1 subsidy increase of 1.23% in 1H FY2021 to assist with general COVID-19 related costs
                                                      across Homes not impacted by outbreaks. These costs have reduced in 2H FY2021
                                                  •   Direct costs of ~$7.0m were incurred in relation to COVID-19 outbreaks in 1H FY2021
                                                  •   Government grants allow Japara to claim certain qualifying expenses
                                                        ‒ ~$7.0m claimed under the Federal Government Aged Care Support Program for outbreak expenses in
                                                           1H FY2021 with ~$1.6m recognised in 1H FY2021 and the balance to be recognised upon receipt
                                                        ‒ Application for reimbursement under the Support for Aged Care Workers in COVID-19 program to be
                                                           made with ~$1.3m recognised in 1H FY2021 compared to expenses of ~$1.7m with the balance to be
                                                           recognised upon receipt

                                  Cash flow and   •   Operating cash flow of $24.7m, including RAD / ILU net inflow of $2.4m, was impacted by lower occupancy
                                  balance sheet   •   All banking covenants were met for the period
                                                  •   The lender syndicate remains supportive with a comprehensive understanding of COVID-19 impacts
                                                  •   The business has $137.0m in liquidity and expects RAD inflows to improve as occupancy increases and
                                                      new developments are opened

1. Aged Care Funding Instrument
02

Financial and operational
summary
1H FY2021 earnings                                                                                                                                                                  8

1H FY2021 earnings impacted by COVID-19 related occupancy pressure. Revenue indexation was
below wage inflation. Non-recurring COVID-19 outbreak expenses subject to claim for reimbursement
1H FY2021 EBITDA bridge ($m)
                                                                                                       2.1          3.4
                            3.2                                                     1.4
                                                                  1.5

                                                                                                                                 7.4

         24.3                                                                                                                              0.3
                                              21.1
                                                                                                                                                                 7.0
                                                                                                                                                    15.0

                                                                                                                                                                            8.0
      H1 FY20            Net non-           H1 FY20        Developments            Acuity            COPO 2      EBA wage     Occupancy   Other   H1 FY21     Net non-    H1 FY21
      EBITDA             recurring          recurring                                                             inflation                       recurring   recurring   EBITDA
                           items1            EBITDA                                                                                                EBITDA       items1

Summary
•     New developments and refurbished Homes continue to make an incremental positive contribution despite the impact of COVID-19
•     Increased resident acuity is attracting higher funding
•     Government funding growth via COPO indexation (of 1.6%) exceeded by wage rate increases (of ~2.5%)
•     Average 1H FY2021 occupancy of 89.2%3 significantly impacted by COVID-19 and below 1H FY2020 average occupancy of 92.6%3
•     Other net EBITDA movement attributable to:
      – General COVID-19 costs offset by Government funding from the COVID-19 Support Payment and the Temporary Additional ACFI4 subsidy increase
      – Expense inflation offset by reduced support office costs
•     ~$7.0m of non-recurring COVID-19 outbreak specific expenses incurred in 1H FY2021 at COVID-19 outbreak Homes partially offset with ~$1.6m recognised for
      Government Grant reimbursement
      – Grant applications lodged to be reimbursed ~$7.0m in outbreak expenses incurred in 1H FY2021

1.   Refer to Appendices for a reconciliation of net non-recurring items
2.   Commonwealth Own Purpose Outlays indexation
3.   Average occupancy adjusted for places ramping up at new developments and places offline for refurbishment
4.   Aged Care Funding Instrument
1H FY2021 financial result and position                                                                                                                                               9

Investment in business growth and improvement continues underpinned by strong support
from lenders and notwithstanding impact of COVID-19 on the financial results
Summary
•   1H FY2021 statutory net loss1 of $9.5m (1H FY2020 profit of $5.4m)
•   Financial result impacted by lower operational earnings and increased depreciation and interest costs from developments
•   Tax expense impacted by provision of $2.7m to address franking account deficit created by prior year tax losses
•   Cash from operating activities includes $24.1m of January 2021 Government Funding received in advance in December 2020
•   ~$41m capital invested in new Homes, Home extensions and refurbishments and general portfolio improvement
•   $345m loan facilities drawn to a net $208m
    – Core net debt of $48m (1.6x annualised 1H FY2021 recurring EBITDA)
    – Available liquidity of $137m
                                                                                                                                                                   Development debt
                                                                                                                                                                   Core net debt
1H FY2021 net bank debt movement ($m)
                                                                                                                                                                          208
              191
                                                                                                                                                    1
                                                                     2                          1                         41
                                               22

                                                                                                                                                                          160
              155

                                                                                                                                        Development debt largely
                                                                                                                               attributable to The Regent, Trugo
                                                                                                                                      Place, Corymbia, Kingston
                                                                                                                                      Gardens and land holdings
               36                                                                                                                                                         48

     Net bank debt as at             Cash from operating   Net RAD / ILU inflows   Net land & asset purchases /   Capital expenditure        Lease payments          Net debt as at
       30 June 2020                       activities                                           sales                                                               31 December 2020

1. Loss attributable to members of the Group
Key operational metrics                                                                                                                                                                                      10

Key operational metrics reflect impact of COVID-19 and measures to ensure the
optimal care for residents and safety of staff
 Summary                                                                                                             Operational place movement
•    Average 1H FY2021 occupancy of                89.2%1
                                                  below FY2020 average
                                                                                                                                                                                        50
     ‒ Occupancy at 31 December 2020 was 87.1%1 and at 19 February                                                                                                             125
                                                                                                                                                                                              42
        2021 was 87.3%1
                                                                                                                                              22         21                                        50
        ▪ Victorian Homes occupancy at 19 February 2021 was 85.5%1 with
                                                                                                                                   110
             remaining portfolio occupancy 90.9%
•    Cost to revenue ratios impacted by lower revenues from lower occupancy
     and higher COVID-19 related costs offset by Government support
•    Net RAD cash inflows in 1H FY2021 reduced by COVID-19 related
     occupancy declines but still positive                                                                              4,385                                    4,496                                    4,479
•    Place numbers reduced by closure of Japara Wyong (50 places),
     significant refurbishment activity (42 places) and conversion of some                                             Dec 19        Sig Refurb                 Jun 20       Conversions         Wyong   Dec 20
     double rooms to single occupancy (50 places)                                                                           Developments        Wyong                Developments     Sig Refurb

    Operational metrics                                                                                 1H FY2021                          2H FY2020                       1H FY2020               2H FY2019
    Number of homes                                                                                                50                                  51                                50                  49
    Operational places (end of period)                                                                          4,479                               4,496                             4,385               4,235
    Average occupancy1                                                                                         89.2%                               91.9%                             92.6%               92.2%
    Average revenue Per Operating Bed Day2                                                                     $303.6                              $291.9                            $284.4              $279.6
    Average Government revenue Per Operating Bed Day2                                                          $216.7                              $212.1                            $206.3              $201.1
    Staff cost to revenue2                                                                                     75.6%                               74.2%                             72.4%               72.6%
    Non-wage costs to revenue2                                                                                 17.6%                               18.1%                             17.4%               17.6%
    Average concessional residents3                                                                            38.8%                               38.9%                             38.4%               38.5%
    Average incoming contract price (’000)                                                                     $413.3                              $408.4                            $382.7              $378.1
    Net RAD & ILU loan inflow (m)                                                                                $2.4                               $22.4                             $33.4               $15.8

1. Occupancy adjusts for places ramping up at new developments and places offline for refurbishment
2. Metrics shown exclude the impact of non recurring items, Government temporary subsidies and COVID-19 outbreak Grants, developments in ramp up and discontinued operations
3. Calculated as the number of concessional residents / operational places
Resident trends 11
Occupancy impacted by COVID-19 outbreaks in Victoria but has been stable since October
2020. Room price and resident payment trends continue
Summary Non-concessional portfolio mix (by number of residents)
• 3,900 residents as at 31 December 2020 with 3,911 residents as at 100%
19 February 2021 22.4% 24.2% 26.7% 26.2% 27.0% 26.5% 26.5% 29.3% 29.4% 30.5%
80%
– Resident numbers declined by 202 from June to December 2020
18.8% 18.2% 17.3% 17.3% 17.6% 18.9% 17.7%
– Noticeable drop in residents from August 2020 due to COVID-19 60% 18.4% 19.0% 19.5%
outbreaks in Victoria
– Overall resident numbers have been stable since October 40%
58.8% 57.6%
• Continuing slow trend in non-concessional resident preference towards 56.0% 56.5% 55.4% 54.6% 55.8% 52.3% 51.6% 50.0%
20%
DAPs
• Average incoming place contract values increased mainly due to new 0%
premium rooms opening at new and redeveloped Homes Jun 16 Dec 16 Jun 17 Dec 17 Jun 18 Dec 18 Jun 19 Dec 19 Jun 20 Dec 20
RAD Combination DAP
Total resident count Monthly average incoming place contract price ($’000)
4,200 475
4,100 425
4,000 375
3,900 325
3,800 275
Jun 19 Sep 19 Dec 19 Mar 20 Jun 20 Sep 20 Dec 20 Dec 15 Dec 16 Dec 17 Dec 18 Dec 19 Dec 201H FY2021 RAD liability movement 12
RAD cash flow reduced by declining occupancy with newer Homes continuing to attract
strong net RAD inflows
RAD liability movement ($m) Probate liability
66.5
15.7 588.9
584.5
77.8
59.8m 70.2m
RADs/Bonds at Incoming RADs - RADs/Bonds Refunds and Net RADs Greenfield / RADs/Bonds at
start of period mature homes Deductions - mature homes Brownfield Homes end of period
Highlights
• Net RAD liability movement of $4.4m in 1H FY2021 (excludes $1.8m of net ILU liability movement)
– $11.3m net RAD outflows from mature homes
– $15.7m net RAD inflows from greenfield and brownfield developments ramping up
– Increase in probate liability of $10.4m
• Further ~$145m RAD uplift expected as new homes and extensions ramp up
– Robina Rise opened in July 2019, The Regent in April 2020, Trugo Place in February 2021 and Corymbia is expected to open in May 2021
– Brownfield extensions at Brighton-Le-Sands, Kingston Gardens and Albury & District are also ramping up03 Real estate activity
Development pipeline of 628 new places                                                                                                                                              14

Trugo Place opened in February 2021 and Corymbia will complete shortly with remaining
brownfield and greenfield pipeline timing deferred
Near-term development pipeline1 (net new places)

      Significant refurbishment (42)                  Greenfield (533 new places)
                                                                                                                                                               115
      Operational places (4,479)                      Brownfield (95 net new places)
                                                                                                                                                 90
                                                                                                      38                        106
                                                                         30               27

                                              102
        42                 120

      4,479                       FY21                  4,743                          FY22 / 23                  4,838                     Beyond FY23                     5,149
                               222 places                                              95 places                                             311 places
                            (in construction)                                      (not commenced)                                        (not commenced)

 December 2020         Trugo Place         Corymbia   June 2021     Lower Plenty       Kelaston   Brighton, SA   June 2022   Mitchelton      Lysterfield    Hope Island   Beyond 2022

1. Refer Appendix for development pipeline details
Recent real estate activity summary 15
Ongoing focus on real estate portfolio despite COVID-19 disruptions
Active real estate projects update
• Real estate developments are being advanced to pre-construction stage
with further progress planned when the outlook becomes more certain
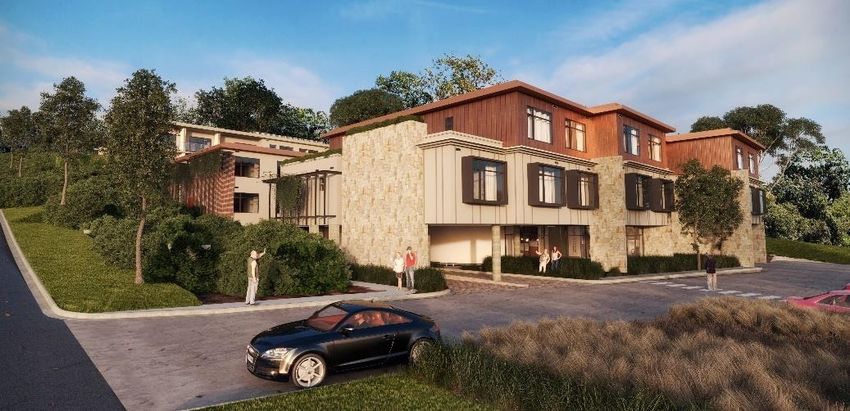
• Trugo Place, Newport, (Victoria)
– Construction complete - resident admission February 2021
• Corymbia, Belrose, (NSW)
– Construction on schedule - resident admission forecast for May 2021
• Lower Plenty Garden Views, Lower Plenty, (Victoria)
– Planning permit received for 30 place extension with licenses held
• 800 Plenty Road, Reservoir, (Victoria)
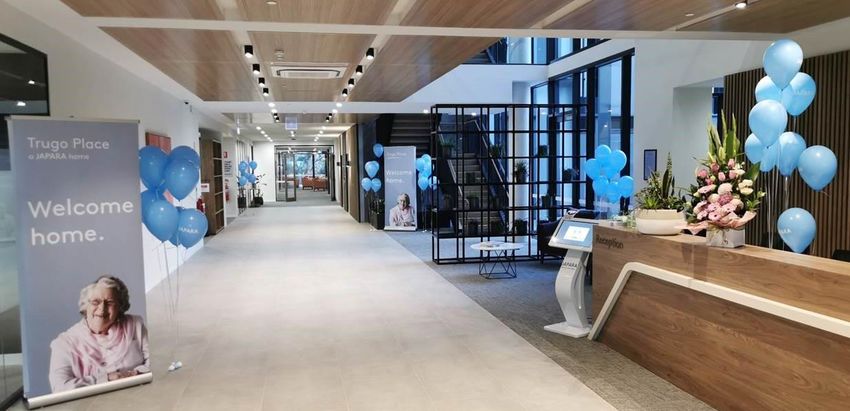
– Planning permit received for a six storey development comprising 90 Proposed Elanora redevelopment façade render
aged care suites and 74 assisted and independent living apartments
– Decision made to offer site for sale given large capital requirement
during development and significant market interest
• Elanora, Brighton, (Victoria)
– Development application lodged for a redevelopment comprising 150
aged care places and 95 assisted care apartments
• Japara Anglesea, Torquay and Balmoral Grove significant refurbishment
projects commenced with completion expected in H1 FY2022
• Japara Wyong
– Home closed in August 2020 and contracts exchanged in February
2021 for the sale of the vacant site for net proceeds of $1.6m
• Decision made to reconfigure 50 rooms from double to single occupancy
to meet market preference with 91% of rooms now single occupancy
• Additional potential sale and leaseback transactions are being
investigated following ongoing inbound expressions of interest Trugo Place receptionBelrose greenfield development case study 16
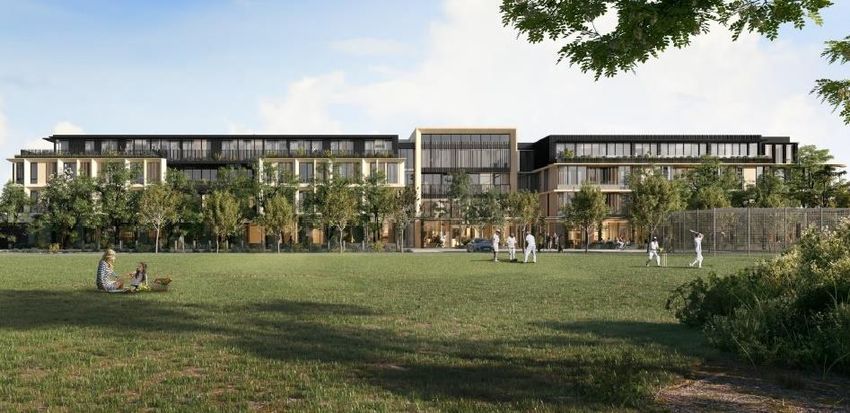
Corymbia in Belrose, NSW, is Japara’s next greenfield development and is due to
open in 2H FY2021 offering 102 new premium rooms
Corymbia, Belrose, NSW
• Located in the western part of Sydney’s Northern Beaches, this Home
will offer contemporary market accommodation to residents. Ocean
views are offered from the upper rooms
• Construction commenced on the vacant site in November 2019
• Total project costs including development costs and land of $42.3m are
expected
• The six level home includes premium quality, single bed with ensuite
rooms and a variety of amenities such as an in-house café & bar,
expansive terraces, a cinema, a beauty, hair and nail salon and a
gymnasium
Belrose balcony view
Belrose façade render Belrose bedroom suite renderDevelopment assets and funding 17
Japara has future committed construction capital expenditure of ~$12.3m, expected
RAD inflows from developments of $145m and $137m in cash and undrawn debt
Debt and development capital summary Debt facility summary Drawn Undrawn Total
• $345m in committed debt facilities with cash and undrawn debt of $137m General Purpose $95.0m $70.0m $165.0m
at 31 December 2020
Development $160.0m $5.0m $165.0m
• Japara was in full compliance with all lender covenants at 31 December
2020 Multi-Option $4.5m $10.5m $15.0m
– 31 December 2020 covenant debt / covenant EBITDA was 2.46x
– Development debt is excluded from debt covenant calculations Sub-Total $259.5m $85.5m $345.0m
• 663 new places are ramping up and/or completing with ~$12.3m in further
construction expenditure required to complete delivery Cash $(51.5)m $51.5m -
• $16.2m received from developments ramping up in 1H FY2021 with an
incremental ~$145m in RAD inflows1 expected from the 663 places Net debt / available $208.0m $137.0m $345.0m
Developments New Expected future Construction Land holdings Net new places Book value
ramping up / completing places RADs ($m)1 remaining ($m)
Mitchelton (QLD) 106 $7.3m
The Highbury (VIC) 60 - Lysterfield (VIC) 90 $5.8m
Brighton-Le-Sands (NSW) 85 - Reservoir (VIC) 90 $7.9m
Kingston Gardens (VIC) 60 - Hope Island (QLD) 115 $5.0m
Robina Rise (QLD) 106 - Kingston Way Estate (VIC) - $6.9m
The Regent (VIC) 105 - Brighton (VIC) - $9.2m
Oaklands (SA) - $1.0m
Albury & District (NSW) 25 -
Mt Eliza (VIC) - $2.2m
Trugo Place (VIC) 120 $2.5m
Wyong (NSW) - $1.2m
Corymbia (NSW) 102 $9.8m Glenning Valley (NSW) - $1.0m
Total 663 ~$145m $12.3m Total 401 $47.5m
1. Expected RAD inflows from the above 663 total places assume a ‘look through’ ~60% RAD preference for non-supported residents and a weighted average RAD to local house price
ratio of 58%04 Industry commentary
Industry commentary                                                                                                                                            19

Occupancy has declined and acuity is flat as the industry awaits the Government
response to the Aged Care Royal Commission Final Report due in late February

Industry commentary                                                                                 Mirus Australia monthly aged care occupancy
•     Occupancy continued to decline over 2020, with the impact of COVID-                           96%
      19 particularly evident from April onwards
•     Industry acuity has remained relatively static as reflected in the monthly                    94%
      average ACFI amounts reported by the Department of Health
                                                                                                    92%
•     The Royal Commission into Aged Care Quality and Safety Final Report
      is due by 26 February 2021
                                                                                                    90%
      ‒    Federal Government budget projections indicate an expectation of
           ongoing growth in the residential aged care sector                                       88%

                                                                                                    86%
                                                                                                       Dec 15           Dec 16   Dec 17   Dec 18   Dec 19   Dec 20

Sector monthly average ACFI rate ($ per resident per day)                                           Australian Government Aged Care Budget Projections
    $190                                                           COPO
                                                    COPO           Indexation
    $185                                            Indexation     (1.4%)
                    COPO                            (1.4%)
    $180            Indexation (1.5%)

    $175                                                                 COPO
                                                                         Indexation
    $170                                                                 (1.6%)
                      No COPO
    $165              Indexation
                                          National Projected       Actual National
    $160
       Jan-16         Jan-17            Jan-18        Jan-19         Jan-20

Source: Mirus Australia
        ACFI Monitoring Reports, Australian Government, Department of Health
        Australian Government Budget 2020–21: Department of Health Portfolio Budget Statement, October 2020, Page 124
05 Summary and outlook
1H FY2021 summary and outlook                                                                   21

1H FY2021 disrupted by COVID-19. Outlook unclear given
Royal Commission and ongoing COVID-19 uncertainties
1H FY2021 Summary
•   Japara’s focus during the last six months has been on resident and staff wellbeing as the
    COVID-19 pandemic significantly impacted operations
•   Occupancy reduced and the cost of operating increased
•   Recurring EBITDA of $15.0m was down by 29% on 1H FY2020 due to the lower occupancy
    and wage inflation greater than revenue escalation
•   Balance sheet strength was maintained with core net debt of $48 million, development debt
    of $160m and available liquidity of $137m
•   Attention is on occupancy recovery and embedding COVID-19 learnings into care practices

FY2021 Outlook
•   The FY2021 cost and revenue implications from COVID-19 remain uncertain
•   The funding environment is unclear and occupancy, although stabilising, remains weakened
•   In this environment it is difficult to provide reliable earnings guidance
•   Recently completed developments are expected to contribute to EBITDA with interest and
    depreciation expenses also increasing
•   RAD inflows are expected from new Homes ramping up and as occupancy recovers
    – Vaccine rollout expected to be a catalyst for improved operating conditions
•   Greenfield developments are expected to add ~220 new places during 2H FY2021
    – Decisions on future developments deferred until the COVID-19 pandemic and economic
      outlook are more certain
•   Japara looks forward to the Government response to the Final Report from the Royal
    Commission into Aged Care Quality and Safety expected in late February 2021
06 Appendices
Appendix 1: Japara portfolio overview                                                                                                          23

Japara’s portfolio comprises over 5,000 existing or to be constructed aged care places with
several co-located seniors living communities

Portfolio summary
•   Japara’s aged care portfolio comprises 50 homes across five states
    ‒   Two further greenfield developments are under construction
        (Newport in Victoria and Belrose in NSW)
    ‒  46 homes are owned freehold with the remaining four leased
•   Japara has a further greenfield development portfolio comprising:
    ‒   Four owned sites (three with Development Approval) offering the
        opportunity for new Home developments
    ‒  Two further regions where licenses are held and sites are being
                                                                                                                              Gympie
       sourced
•   Japara also has a number of brownfield development opportunities
                                                                                                                                  Noosa
•   Japara’s seniors living portfolio comprises a total of 180 independent
    living units and apartments co-located with five of our aged care homes                                                       Robina
    ‒   Three sites with land already owned are in planning for additional                                                     Coffs Harbour
        seniors living developments
                                                                                                                               South West Rocks

                                                                                                     5                4      Sydney
                                                                                      Adelaide                            Albury
                                                                                                          3
                                                                                                              21 3        Gippsland
                                                                              Victorian Goldfields        6
                                                                                                                Melbourne
                                                                                        Greater Geelong
                                                                                                                2
                                                                                                                     Launceston
Appendix 2: Detailed Profit and Loss 24
1H FY2021 1H FY2020 Change
$'000 $'000 % $'000
Revenue
Government care and accommodation funding 156,457 150,096 4.2% 6,361
Resident fees 56,230 56,940 (1.2)% (710)
Other income 7,613 5,564 36.8% 2,049
Total revenue & other income 220,300 212,600 3.6% 7,700
Expenses
Employee benefits expense (170,685) (150,792) 13.2% (19,893)
Resident costs (21,639) (18,584) 16.4% (3,055)
Other costs (19,955) (18,901) 5.6% (1,054)
Total expenses (212,279) (188,277) 12.7% (24,002)
EBITDA 8,021 24,323 (67.0)% (16,302)
Depreciation and amortisation (13,558) (12,711) 6.7% (847)
EBIT (5,537) 11,612 (147.7)% (17,149)
Net finance costs (4,062) (3,780) 7.5% (282)
Income tax expense 86 (2,408) NA 2,494
NPAT1 (9,513) 5,424 (275.4)% (14,937)
1. Profit attributable to members of the GroupAppendix 3: Detailed Cash Flow Statement 25
1H FY2021 1H FY2020
$'000 $'000
Cash flows from operating activities:
Receipts from customers 220,811 206,221
Government advance funding 24,112 24,354
Payments to suppliers and employees (219,252) (196,363)
Income taxes paid (793) (4,113)
Interest received - 166
Finance costs paid (2,606) (3,962)
Proceeds from RADs & ILU resident loans 95,045 120,895
Repayment of RADs/accommodation bonds & ILU resident loans (92,597) (87,491)
Net cash provided by operating activities 24,720 59,707
Cash flows from investing activities:
Purchase of land & buildings (436) (16,611)
Proceeds from sale of land & buildings 920 2,007
Purchase of plant and equipment (2,988) (4,008)
Capital works in progress (38,426) (37,034)
Net cash used in investing activities (40,930) (55,646)
Cash flows from financing activities:
Dividends paid - (8,952)
Net proceeds from bank borrowings 20,500 25,250
Repayment of lease liabilities (1,084) (1,339)
Net cash provided by financing activities 19,416 14,959
Net increase in cash and cash equivalents held 3,206 19,020
Cash and cash equivalents at beginning of the half year 48,286 31,472
Cash and cash equivalents at end of the half year 51,492 50,492Appendix 4: Balance Sheet 26
31 December 20 30 June 20
$'000 $'000
Assets
Current assets
Cash 51,492 48,286
Trade and other receivables 13,094 15,326
Non-current assets held for sale 2,512 2,261
Current tax receivable 2,263 1,860
Other assets 13,104 3,681
Total current assets 82,465 71,414
Non-current assets
Trade and other receivables 2,492 2,574
Property, plant and equipment 863,147 833,202
Right-of-use assets 28,741 30,140
Investment property 48,925 48,925
Intangible assets 265,761 265,761
Total non-current assets 1,209,066 1,180,602
Total assets 1,291,531 1,252,016
Liabilities
Current liabilities
Trade payables and other liabilities 35,142 34,104
Other deferred income 24,112 -
Loans and borrowings 57,500 58,250
Other financial liabilities 612,157 609,526
Employee provisions 44,378 42,954
Lease liabilities 2,502 2,338
Total current liabilities 775,791 747,172
Non-current liabilities
Loans and borrowings 202,000 180,750
Deferred tax liabilities 60,612 61,090
Employee provisions 6,129 5,608
Other financial liabilities 4,833 5,039
Lease liabilities 28,142 29,390
Total non-current liabilities 301,716 281,877
Total liabilities 1,077,507 1,029,049
Net assets 214,024 222,967
Equity
Issued capital 524,658 524,285
Share based payment reserve 28 304
Hedging reserve (4,566) (5,039)
Retained earnings (306,096) (296,583)
Total equity 214,024 222,967Appendix 5: Non-recurring earnings reconciliation 27
H1 FY21 H1 FY20
$m $m
Non recurring items
Profit on sale of surplus bed licences - 4.6
Profit on sale of land 0.1 0.7
Royal Commission costs (0.4) (1.1)
Greenfields start-up losses (0.9) (1.0)
Redundancies / restructuring (0.4) -
COVID-19 outbreak costs incurred (7.0) -
COVID-19 outbreak grants recognised 1.6 -
Total (7.0) 3.2Appendix 6: Portfolio Metrics 28
As at As at
Change
31 Dec 2020 31 Dec 2019
Resident mix
Concessional 1,718 44% 1,728 43% (0.6)%
RAD 1,004 26% 1,116 28% (10.1)%
DAP 613 16% 626 15% (2.1)%
Combination 392 10% 392 10% (0.1)%
Pre-reform high-care places 16 0% 20 0% (20.0)%
Respite 130 3% 155 4% (16.1)%
TCP / Other 27 1% 17 0% 58.8%
Total residents 3,900 100% 4,055 100% (3.8)%
Staffing
Number of staff (including part time and casuals) 5,705 5,869 (2.8)%
Places
Operational places 4,479 4,384 2.2%
Non-operational places 501 541 (7.4)%
Provisional ACAR allocations 725 780 (7.1)%
Total places 5,705 5,705 0.0%
Places (metro/major regional, regional split)
Metro/major regional 4,568 80% 4,548 80% 0.4%
Regional 1,137 20% 1,157 20% (0.4)%
Total places 5,705 100% 5,705 100% 0.0%
Geographic spread (operational places)
VIC 67% 65%
NSW 12% 14%
QLD 9% 9%
SA 7% 7%
TAS 5% 5%
Total 100% 100%
Funded bed days 719,674 728,723 (1.2)%Appendix 7: Developments update 29
Significant greenfield & brownfield aged care development program comprising 628 new places
and additional seniors living development opportunities
Estimated resident
Greenfield developments Program status Total new places Net new places
admission
Newport (Melbourne) Complete 120 120 2H FY2021
Belrose (Sydney) Construction 102 102 2H FY2021
Mitchelton (Brisbane) Tendered (on hold) 106 106 TBC
Lysterfield (Melbourne) Tendered (on hold) 90 90 TBC
Hope Island (Gold Coast) Town planning 115 115 TBC
Total 533 533
Estimated resident
Brownfield developments Program status Total new places Net new places
admission
Lower Plenty Gardens (Melbourne) Tender 50 30 FY2022 / 23
Kelaston (Ballarat) Tender 27 27 FY2022 / 23
Brighton (Adelaide) Tendered (on hold) 52 38 FY2022 / 23
Total 129 95
Seniors living / co-located care Total new Net new Estimated stage 1
Program status
developments units Aged Care places completion
Mt Eliza (Melbourne) Town planning 95 0 FY2022 / 23
Launceston Concept design 120 0 NA
Brighton (Melbourne) Town planning 95 8 NA
Total 310 8Disclaimer 30 This presentation was prepared by Japara Healthcare Limited (ABN 54 168 631 052) (“the Company”) and was authorised for release by the Board of the Company. Information contained in this presentation is current as at 24 February 2021. This presentation is provided for information purposes only and has been prepared without taking account of any particular reader’s financial situation, objectives or needs. Nothing contained in this presentation constitutes investment, legal, tax or other advice. Accordingly, readers should, before acting on any information in this presentation, consider its appropriateness, having regard to their objectives, financial situation and needs, and seek the assistance of their financial or other licensed professional adviser before making any investment decision. This presentation does not constitute an offer, invitation, solicitation or recommendation with respect to the subscription for, purchase or sale of any security, nor does it form the basis of any contract or commitment. Except as required by law, no representation or warranty, express or implied, is made as to the fairness, accuracy or completeness of the information, opinions and conclusions, or as to the reasonableness of any assumption, contained in this presentation. By reading this presentation and to the extent permitted by law, the reader releases the Company and its affiliates, and any of their respective directors, officers, employees, representatives or advisers from any liability (including, without limitation, in respect of direct, indirect or consequential loss or damage or loss or damage arising by negligence) arising in relation to any reader relying on anything contained in or omitted from this presentation. The forward looking statements included in this presentation involve subjective judgment and analysis and are subject to significant uncertainties, risks and contingencies, many of which are outside the control of, and are unknown to, the Company. In particular, they speak only as of the date of these materials, they assume the success of Japara Healthcare Limited’s business strategies, and they are subject to significant regulatory, business, competitive and economic uncertainties and risks. Actual future events may vary materially from forward looking statements and the assumptions on which those statements are based. Given these uncertainties, readers are cautioned not to place reliance on such forward looking statements. Past performance is not a reliable indicator of future performance.
You can also read