FY2021 Full year results presentation - JAPARA HEALTHCARE - AFR
←
→
Page content transcription
If your browser does not render page correctly, please read the page content below
JAPARA HEALTHCARE
FY2021
Full year results presentation

30 August 2021
Contents

01 Overview                        3

02 FY2021 Financial Summary        7

03 FY2021 Operational Summary      11

04 Trading Update and Priorities   16

05 Appendices                      18
01

Overview

FY2021 overview 4
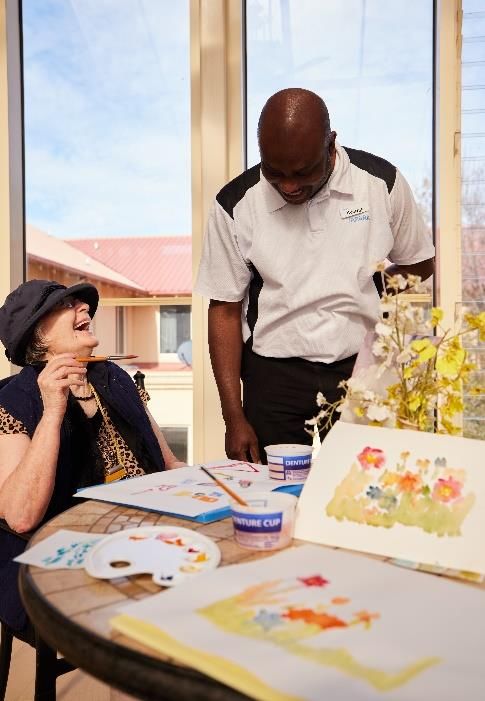
Japara’s priority has been to keep residents and
staff safe in a COVID-19 impacted year
Summary Key metrics
• The COVID-19 pandemic, the Aged Care Royal Commission and
the Federal Government’s response were key elements in a STATUTORY REVENUE NET RAD / ILU INFLOWS
challenging year
• Operating performance reflects these factors and measures
$ 438.8m $ 24.9m
undertaken to protect residents and staff Up 2.6% on FY2020 primarily $39.5m RAD uplift from new
due to COVID-19 related developments
• Earnings declined but net RAD inflows remained positive Government funding
• Federal Government responses to COVID-19 and the Royal
Commission provided additional financial support (no Jobkeeper
payments or rent relief received) EBITDA1 AVERAGE OCCUPANCY2
• Two new Homes and one Home extension were successfully
completed and opened $ 19.8m 88.6%
– Further development activity currently on hold Down 39.7% on FY2020 due to FY2021 occupancy2 weaker
lower occupancy and COVID-19 primarily due to COVID-19
• Improvements to key ICT systems were implemented to benefit related costs
residents, with further enhancements ongoing
• Debt levels increased marginally reflecting funds deployed in
growth and improvement initiatives STATUTORY NET LOSS3 NET DEBT
• No dividend has been declared $ 14.1m $ 212.2m
• Focus remains on positioning the business for long term
sustainable growth Lower earnings combined with $70.9m core debt at 30 June
higher depreciation and interest 2021 with $132.8m of available
expense cash and undrawn debt
1. EBITDA is a measure consisting of earnings before interest, tax, depreciation, amortisation and impairment
of non-current assets
2. Average occupancy adjusts for places ramping up at new developments and places offline for refurbishment
3. Loss attributable to members of the Group
FY2021 operating environment                                                                                                                                           5

Events in FY2021 signal future fundamental industry changes

                                                  Industry Changes
                                                  • FY2021 was a year of significant reform in the Residential Aged Care industry, with the events of the last 12
                                                    months fundamentally changing the approach to aged care in Australia
                                                  • The COVID-19 pandemic has been particularly challenging and we acknowledge the deeply concerning
                                                    outbreaks, the ongoing lockdowns and the tremendous impact these have had on residents, families and staff
                                                    – Our highest priority has been to keep our residents and our staff safe, supported and well
                                                  • Japara managed five Home outbreaks and through multiple lockdowns across the business during the year
                                                  • Infection control initiatives to combat COVID-19 look to be part of business as usual for the foreseeable future
                                                  • The Royal Commission into Aged Care Quality and Safety issued its final report in late February 2021 making
                                                    148 recommendations covering quality, funding and sustainability reforms
                                                  • The Federal Government responded in May 2021 with a five year reform plan to address services and
                                                    sustainability, quality and safety, workforce, governance and home care
                                                  • Key proposed changes include:
                                                    – a new basic daily fee supplement of $10 per resident from July 2021, subject to providers reporting on
                                                      certain daily living services to residents
                                                    – a new residential care funding model (AN-ACC1), to replace the current ACFI2 model, from October 2022
                                                    – measures to improve transparency, including star ratings for quality of aged care services, by the end of
                                                      2022
                                                    – a new, values based Aged Care Act by July 2023
                                                    – minimum average care time for residents by October 2023 (200 minutes per resident per day, including 40
                                                      minutes of registered nurse time)
                                                    – discontinuing the ACAR3 from July 2024, and abolishing current bed license arrangements
                                                    – alterations to the operation of the RAD funding scheme
                                                  • Japara supports aged care sector reforms that benefit the elderly and provide long-term financial sustainability
1. Australian National Aged Care Classification
2. Aged Care Funding Instrument
3. Aged Care Approvals Round
FY2021 business focus 6
Home developments, extension and refurbishments completed. Acquisition
approaches received and progressed
Business Growth and Improvement
• Japara completed and opened two new Homes during the year; Trugo Place in Newport, Victoria in February
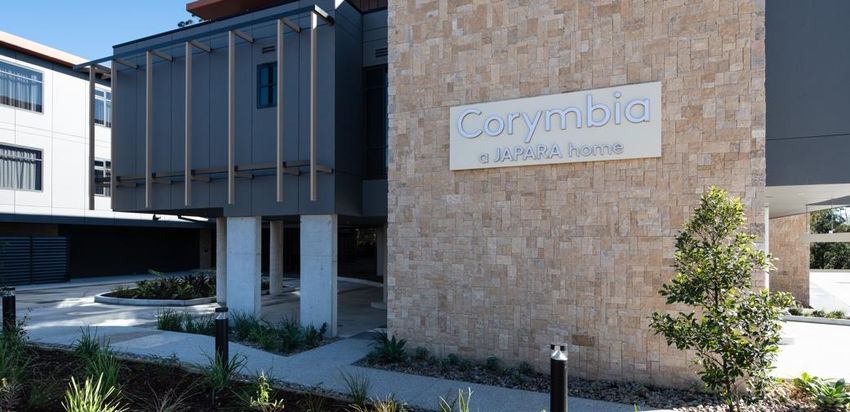
2021 and Corymbia in Belrose, NSW in June 2021
• A further brownfield development at Albury, New South Wales opened in September 2020
• Significant refurbishments of three Homes were also completed at Anglesea, Torquay and Balmoral Grove
• ICT systems improvement continued, with digital clinical and medication management applications
implemented and upgrades to workforce management and payroll systems undertaken
Response to Acquisition Approaches
• On 30 April 2021, Japara announced an unsolicited, conditional and non-binding proposal from Little
Company of Mary Health Care Ltd (Calvary) to acquire all of the shares in Japara for $1.04 per share
– On 7 June 2021, Japara announced an improved proposal from Calvary of $1.20 per share
• On 15 June 2021, Japara announced a conditional and non-binding proposal from RSL Care RDNS Limited,
part of the Bolton Clarke Group, to acquire all the shares in Japara for $1.22 per share
• The Japara Board granted access to information to both groups to allow them to undertake due diligence
• Following a six week diligence period, on 27 July 2021, a Scheme Implementation Deed was entered into
with Calvary for the acquisition of all the shares in Japara, by way of Scheme of Arrangement (Scheme)
• Japara shareholders will receive $1.40 cash per share under the Scheme, representing a premium of 75% to
the last undisturbed closing price of Japara shares on 29 April 20211 of $0.80
• Japara’s Board of Directors unanimously recommends the Scheme, in the absence of a superior proposal
• A Scheme Booklet, containing information relating to the Scheme, the reasons for the Japara Board
recommendation and an Independent Expert’s Report, is to be sent to shareholders in mid-September 2021
• The Scheme is to be voted on at a shareholder meeting in October 2021 and, if approved, will be
implemented in early November 2021
1. The last trading date before Japara announced that it had received an indicative non-binding acquisition proposal from Calvary02 FY2021 Financial Summary
FY2021 earnings                                                                                                                                                                                         8

COVID-19 impacting occupancy rates and earnings

FY2021 EBITDA bridge ($m)
                                                                                                  4.3
                                                                                                                    8.4
                                                                                3.6
                                                               3.1
                           4.0
                                                                                                                                        15.5

                                            36.9                                                                                                   2.1
        32.9                                                                                                                                                  2.0                  0.1

                                                                                                                                                                       19.9                   19.8

                                                                                                        3
       FY20            Net non-            FY20         Developments          Acuity            COPO            EBA wage         Occupancy       Medical     Other     FY21      Net non-     FY21
      EBITDA 1         recurring         recurring                                                               inflation                     consumables           recurring   recurring   EBITDA 1
                         items 2          EBITDA                                                                                                                      EBITDA       items 2

Summary
• New developments and refurbished Homes continue to make an incremental positive contribution despite the impact of COVID-19
• Increased resident acuity is attracting higher funding
• Government funding growth via COPO indexation (of 1.6%) exceeded by wage rate increases (of ~2.7%)
• Average FY2021 occupancy of 88.6%4 significantly impacted by COVID-19 and below FY2020 average occupancy of 92.2%4
• General medical consumable costs (primarily PPE) of $6.6m
      – $2.1m higher than FY2020 expense of $4.5m and $3.2m higher than FY2019 expense of $3.4m
• $7.4m of non-recurring COVID-19 outbreak specific expenses incurred in FY2021 at five COVID-19 outbreak Homes offset with $7.2m in
  Government Grants

1.   EBITDA is a measure consisting of earnings before interest, tax, depreciation, amortisation and impairment of non-current assets
2.   Refer to Appendices for a reconciliation of net non-recurring items
3.   Commonwealth Own Purpose Outlays indexation
4.   Average occupancy adjusted for places ramping up at new developments and places offline for refurbishment
FY2021 financial result and position 9
$70m invested in developments and portfolio improvement, funded through RAD
inflows, operating cashflows, asset sales and further debt drawdown
Summary
• FY2021 statutory net loss1 of $14.1m (FY2020 net loss1 of $292.1m)
• No dividends declared for FY2021
• Financial result impacted by lower operational earnings and increased depreciation and interest costs
• Tax expense impacted by provision of $2.7m to address franking account deficit created by prior year tax losses
• ~$70m capital invested in new Homes, Home extensions and refurbishments and general portfolio improvement
• $345m loan facilities drawn to a net $212.2m
– Core net debt of $70.9m (3.6x FY2021 EBITDA)
– Available cash and undrawn debt of $132.8m Development debt
Core net debt
FY2021 net bank debt movement ($m) 4 212
70
191
16
25 141
12 Development debt
155 largely attributable to
The Regent, Trugo
Place, Corymbia, and
land holdings
71
36
Net bank debt as at Cash from operating Net RAD / ILU inflows Net land & asset sales / Capital expenditure Lease payments Net debt as at
30 June 2020 activities purchases 30 June 2021
1. Loss attributable to members of the GroupFY2021 RAD liability movement 10
Net RAD and ILU inflows remain positive with new developments contributing as expected
RAD liability movement ($m) Probate liability
141.4 ( 154.7 )
39.5 610.7
584.5
59.8m 79.4m
RADs/Bonds at start Incoming RADs Refunds and deductions Net RADs RADs/Bonds at end
of period mature homes mature homes Greenfield/Brownfield homes of period
Highlights
• Net RAD liability movement of $26.2m in FY2021 (excludes $1.9m of net ILU liability decrease)
– $11.7m net RAD liability reduction from mature homes
– $39.5m net RAD liability increase from greenfield and brownfield developments recently completed
– $1.6m in RAD deductions
– Increase in probate liability of $19.6m
• A further ~$120m RAD inflows1 is expected from recently completed greenfield and brownfield developments
– Robina Rise opened in July 2019, The Regent in April 2020, Trugo Place in February 2021 and Corymbia in June 2021
– Brownfield extensions at Brighton-Le-Sands, Kingston Gardens and Albury & District are also maturing
1. Expected RAD inflows from 803 places ramping up assume a ‘look through’ ~60% RAD preference for non-supported residents and a weighted average RAD to local house price ratio of 53%03 FY2021 Operational Summary
Key operational metrics                                                                                                                                                                                       12

COVID-19 impacting occupancy and revenue and cost ratios

Summary                                                                                                               Operational place movement
•    Average FY2021 occupancy of              88.6%1     well below FY2020 average                                                                                                         6
                                                                                                                                             50
     – Occupancy at 30 June 2021 was                 89.0%1     and at 27 August 2021 was                                                                                                      60
       88.6%1                                                                                                                      125
                                                                                                                                                      42                         140
     – Victorian Homes occupancy at 27 August 2021 was 87.7%1 with                                                                                                                                   46
       remaining portfolio occupancy 90.4%                                                                                                                     50
•    Cost to revenue ratios impacted by lower revenues from lower occupancy
     and higher COVID-19 related costs offset by Government support                                                     4,496                                                                              4,507
                                                                                                                                                                       4,479
•    Net RAD cash inflows in FY2021 lower than expected due to COVID-19
     related occupancy declines but still positive
•    Place numbers reduced by closure of Japara Wyong and Japara Forest                                                 Jun 20      Conversions       Closures     Developments     Sig Refurb        Jun 21
                                                                                                                            Developments     Sig Refurb        Dec 20      Conversions       Closures
     View (96 places), significant refurbishment activity (102 places) and
     conversion of some double rooms to single occupancy (56 places)

    Operational metrics                                                                                   2H FY2021                         1H FY2021                          2H FY2020            1H FY2020
    Number of homes                                                                                               50                                50                                 51                   50
    Operational places (end of period)                                                                         4,507                             4,479                              4,496                4,385
    Average occupancy1                                                                                        88.0%                             89.2%                              91.9%                92.6%
    Average revenue Per Operating Bed Day2                                                                      $300.7                             $303.6                           $291.9                $284.4
    Average Government revenue Per Operating Bed                     Day2                                       $214.6                             $216.7                           $212.1                $206.3
    Staff cost to   revenue2                                                                                     79.0%                             75.6%                             74.2%                72.4%
    Non-wage costs to       revenue2                                                                             18.5%                             17.6%                             18.1%                17.4%
    Average concessional        residents3                                                                       38.5%                             39.1%                             38.9%                38.4%
    Average incoming contract price (’000)                                                                      $443.7                             $413.3                           $408.4                $382.7
    Net RAD & ILU loan inflow (m)                                                                                 $22.5                               $2.4                             $22.4               $33.4

1. Occupancy adjusts for places ramping up at new developments and places offline for refurbishment
2. Metrics shown exclude the impact of non recurring items, Government temporary subsidies and COVID-19 outbreak Grants, developments in ramp up and discontinued operations but include
   Government funded aged care worker retention bonuses and single site worker payments
3. Calculated as the number of concessional residents / operational places
Resident trends 13
Occupancy recovery evident in 2H FY2021, with average contract prices increasing as portfolio is
grown and improved and with associated RAD inflows offsetting continuing trend to payment by DAP
Summary Non-concessional portfolio mix1 slowly trending to DAPs
• 4,012 residents as at 30 June 2021 100%
22.4% 24.2% 26.7% 26.2% 26.5% 26.5%
– Resident numbers declined by 90 during FY2021 27.0% 29.3% 29.4% 30.5% 31.8%
80%
– Overall resident numbers have improved since January 2021 18.8% 18.2% 17.3% 17.3% 17.6% 18.9% 17.7%
60% 18.4% 19.0% 19.5%
– Drop in residents from August 2020 due to COVID-19 outbreaks in 20.8%
Victoria
40%
• Continuing slow trend in non-concessional resident preference towards
58.8% 57.6% 56.0% 56.5% 55.4% 54.6% 55.8%
DAPs 52.3% 51.6% 50.0% 47.4%
20%
• Average incoming place contract values increased mainly due to new
premium rooms opening at new and redeveloped Homes 0%
Jun 16 Dec 16 Jun 17 Dec 17 Jun 18 Dec 18 Jun 19 Dec 19 Jun 20 Dec 20 Jun 21
RAD Combination DAP
Total resident count improving Incoming place contract price2 ($’000) increasing
4,200
475
4,100
425
4,000
375
3,900 325
3,800 275
Jun 19 Sep 19 Dec 19 Mar 20 Jun 20 Sep 20 Dec 20 Mar 21 Jun 21 Jun 16 Jun 17 Jun 18 Jun 19 Jun 20 Jun 21
1. By number of residents
2. Monthly averageBusiness growth and improvement 14
Ongoing focus on real estate portfolio and systems improvement despite COVID-19 disruptions
Growth and improvement summary Owned aged care development pipeline1 (net new places)
• Key developments completed at: Operational places (4,507) Brownfield (120 net new places)
– Trugo Place in Newport, Victoria in February 2021 comprising 120 Refurbishment / ramping up (182) Greenfield (311 new places)
places and currently 71% occupied 115
90
– Corymbia in Belrose, NSW in June 2021 comprising 100 places and 106
currently 45% occupied 25
30 27 38
182 5,120
– Japara Albury & District in Albury, NSW in September 2020 comprising
a 25 place extension to the existing home, currently 97% occupied
4,507
• Significant improvements and enhancements were made to Japara’s key
ICT systems including in clinical care, workforce management, payroll and
cybersecurity (outlined bottom right)
• Progress was made on Japara’s future development pipeline:
– A planning permit was received for the development of an owned site in
Hope Island, Queensland to comprise a 115 place Home Key ICT systems improvements
– A planning permit was received for a 30 place extension at Lower
Plenty Garden Views, Lower Plenty, Victoria System Comment
– Development applications were lodged for the further development of
sites in Brighton, Victoria, and Mt Eliza, Victoria for senior living • Digital clinical care record rolled out at all 50 Homes
accommodation
• Digital medication management rollout progressing with 15
• An acquisition of adjacent land at Barongarook Gardens in Colac, Victoria homes live and all homes to be complete by June 2022
was completed in July 2021 to facilitate the expansion of the Home by 25
places • Upgrade of rostering platform, including cloud hosting
completed. Employee Self Service project commenced and
• Japara’s Wyong, NSW Home was closed in August 2020 and Chatswood,
to be completed by March 2022
NSW Home closed in June 2021, with residents transferred to the newly
opening Corymbia. The vacant sites have been subsequently sold • Payroll system upgraded
• Significant refurbishment projects were completed at Anglesea, Torquay
• A number of cyber security enhancement projects have
and Grovedale with places now ramping up
completed to keep Japara’s data safe
1. Refer Appendix for development pipeline detailsDevelopment assets and funding 15
$120m in future RAD inflows expected from completed developments ramping up
Debt and development capital summary
• Japara had $345m in committed debt facilities with cash and undrawn
debt of $132.8m at 30 June 2021
• Japara was in full compliance with all lender covenants during FY2021
• $120m in RAD inflows1 expected from 803 recently completed places
across eight Homes
– $39.5m in RAD inflows on recently completed places was received
during FY2021
• Ongoing portfolio management resulted in sales of closed Homes at
Japara Wyong (for net proceeds of $1.6m) and Japara Forest View (for
net proceeds of $4.5m to be received in FY2022)
• A sale and leaseback for six years of Japara Capel Sands was
undertaken in June 2021 for net proceeds of $7.9m
June 2021 debt facility summary Drawn Undrawn Total Land holdings Net new places Book value
General Purpose $113.0m $52.0m $165.0m Mitchelton (QLD) 106 $7.5m
Development $141.3m $23.7m $165.0m Lysterfield (VIC) 90 $5.9m
Multi-Option $1.5m $13.5m $15.0m Hope Island (QLD) 115 $5.2m
Brighton (VIC) - $10.6m
Sub-Total $255.8m $89.2m $345.0m Reservoir (VIC) - $8.1m
Kingston Way Estate (VIC) - $7.1m
Cash $(43.6)m $43.6m - Mt Eliza (VIC) - $2.5m
Oaklands (SA) - $1.0m
Net debt / available $212.2m $132.8m $345.0m Total 311 $47.9m
1. Expected RAD inflows from the above 803 total places assume a ‘look through’ ~60% RAD preference for non-supported residents and a weighted average RAD to local house price ratio of 53%04 Trading Update and Priorities
FY2022 update and priorities                                                            17

Priorities include staff vaccinations and progressing the
Scheme with Calvary
FY2022 trading update
• Occupancy has remained steady in FY2022 as the impact of lockdowns in several
  states is felt and disrupts the occupancy recovery experienced in 2H FY2021
• Additional Government funding of $10 per resident per day is being received
• Other Government revenues are tracking as expected
• Staff and infection control costs are marginally higher than expected due to the
  ongoing lockdowns, single site worker initiatives and general COVID-19 situation

FY2022 priorities
• Progressing the Scheme of Arrangement with Calvary is an immediate focus
• Strategies to improve occupancy in a challenging market are being pursued
• A focus remains on debt reduction with minimal growth capital expenditure underway
• Infection control measures are continuing, including a COVID-19 vaccination program
  with 82% of active staff vaccinated with at least one COVID-19 vaccination dose to
  date
• Ongoing ICT systems improvement is planned, especially in medication and incident
  management
• Developments are progressing to development approval stage but remain on hold
  thereafter with minimal further development capex projected in the short term

FY2022 earnings guidance
• Due to the continued uncertainty created by the COVID-19 pandemic no earnings
  guidance is provided at this time
05

Appendices
Appendix 1: Japara portfolio overview 19
Japara’s portfolio comprises over 5,000 existing or to be constructed aged care places
with several co-located senior living communities
Portfolio summary
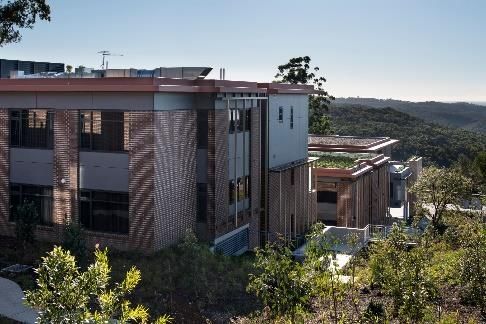
• Japara’s aged care portfolio comprises 50 operating
homes across five states
– 46 homes are owned freehold with the remaining four
leased
• Japara has a further greenfield development portfolio
comprising:
– Four owned sites (all with Development Approval)
offering the opportunity for new Home developments
– Two further regions where licenses are held and sites
are being sourced Gympie
• Japara also has a number of brownfield development
opportunities Noosa
• Japara’s senior living portfolio comprises a total of 180 Robina
independent living units and apartments co-located with
Coffs Harbour
five of our aged care homes
– Three sites with land already owned are in planning for South West Rocks
additional senior living developments
5 4 Sydney
Adelaide Albury
3
21 3 Gippsland
Victorian Goldfields 6
Melbourne
Greater Geelong
2
LauncestonAppendix 2: Detailed Profit and Loss 20
FY2021 FY2020 Change
$'000 $'000 % $'000
Revenue
Government care and accommodation funding 308,390 306,830 0.5% 1,560
Resident fees 111,150 115,412 (3.7)% (4,262)
Other income 19,253 5,290 264.0% 13,963
Total revenue & other income 438,793 427,532 2.6% 11,261
Expenses
Employee benefits expense (339,551) (315,064) 7.8% (24,487)
Resident costs (41,087) (39,074) 5.2% (2,013)
Other costs (38,333) (40,519) (5.4)% 2,186
Total expenses (418,971) (394,657) 6.2% (24,314)
EBITDA 19,822 32,875 (39.7)% (13,053)
Impairment of non-current assets (519) (291,923) (99.8)% 291,404
Depreciation and amortisation (29,615) (26,441) 12.0% (3,174)
EBIT (10,312) (285,489) (96.4)% 275,177
Net finance costs (8,799) (7,393) 19.0% (1,406)
Income tax credit 5,005 795 529.6% 4,210
NPAT1 (14,106) (292,087) (95.2)% 277,981
1. Loss attributable to members of the GroupAppendix 3: Detailed Cash Flow Statement 21
FY2021 FY2020
$'000 $'000
Cash flows from operating activities:
Receipts from customers 432,414 421,567
Payments to suppliers and employees (413,864) (390,603)
Income taxes refunded / (paid) 3,196 (3,316)
Interest received - 231
Finance costs paid (5,731) (8,444)
Proceeds from RADs & ILU resident loans 205,825 232,302
Repayment of RADs/accommodation bonds & ILU resident loans (180,905) (176,539)
Net cash provided by operating activities 40,935 75,198
Cash flows from investing activities:
Purchase of land & buildings - (15,407)
Proceeds from sale of land & buildings 11,790 19,009
Purchase of plant and equipment (8,105) (6,458)
Capital works in progress (62,422) (71,006)
Proceeds from sale of surplus resident places - 4,690
Deposits paid under land contracts (87) -
Net cash used in investing activities (58,824) (69,172)
Cash flows from financing activities:
Purchase of treasury shares - (617)
Dividends paid - (14,297)
Net proceeds from bank borrowings 16,750 28,500
Repayment of lease liabilities (3,596) (2,798)
Net cash provided by financing activities 13,154 10,788
Net increase in cash and cash equivalents held (4,735) 16,814
Cash and cash equivalents at beginning of the year 48,286 31,472
Cash and cash equivalents at end of the year 43,551 48,286Appendix 4: Balance Sheet 22
30 June 21 30 June 20
$'000 $'000
ASSETS
Current assets
Cash 43,551 48,286
Trade and other receivables 15,820 15,326
Non-current assets held for sale 4,466 2,261
Current tax receivable - 1,860
Other assets 7,245 3,681
Total current assets 71,082 71,414
Non-current assets
Trade and other receivables 2,458 2,574
Right-of-use assets 29,574 30,140
Property, plant and equipment 858,102 833,202
Investment property 50,525 48,925
Intangible assets 265,761 265,761
Total non-current assets 1,206,420 1,180,602
TOTAL ASSETS 1,277,502 1,252,016
LIABILITIES
Current liabilities
Trade payables and other liabilities 32,864 34,104
Loans and borrowings 32,500 58,250
Current tax payable 1,907 -
Other financial liabilities 633,834 609,526
Employee provisions 45,727 42,954
Lease liabilities 2,862 2,338
Total current liabilities 749,694 747,172
Non-current liabilities
Loans and borrowings 223,250 180,750
Deferred tax liabilities 55,514 61,090
Employee provisions 5,643 5,608
Other financial liabilities 3,337 5,039
Lease liabilities 29,247 29,390
Total non-current liabilities 316,991 281,877
TOTAL LIABILITIES 1,066,685 1,029,049
NET ASSETS 210,817 222,967
EQUITY
Issued capital 524,658 524,285
Share based payment reserve 185 304
Hedging reserve (3,337) (5,039)
Retained earnings (310,689) (296,583)
TOTAL EQUITY 210,817 222,967Appendix 5: Non-recurring earnings reconciliation 23
FY2021 FY2020
$m $m
Non recurring items
Profit on sale of land 1.5 3.0
Revaluation of land 1.6 (0.3)
Property revaluation gains / (losses) (0.1) (2.4)
Greenfields start-up losses (1.9) (1.8)
Redundancies / restructuring (0.8) (1.2)
Royal Commission costs (0.4) (1.8)
Profit on sale of surplus bed licences - 4.6
LSL assumption changes - (2.2)
ECL adjustment - (1.9)
Total (0.1) (4.0)Appendix 6: Portfolio Metrics 24
As at As at
Change
30 June 2021 30 June 2020
Resident mix
Concessional 1,738 43% 1,771 43% (1.9)%
RAD 968 24% 1,105 27% (12.4)%
DAP 651 16% 630 15% 3.3%
Combination 426 11% 408 10% 4.4%
Pre-reform high-care places 10 0% 16 0% (37.5)%
Respite 188 5% 155 4% 21.3%
TCP / Other 31 1% 17 0% 82.4%
Total residents 4,012 100% 4,102 99% (2.2)%
Staffing
Number of staff (including part time and casuals) 5,868 6,064 (3.2)%
Places
Operational places 4,507 4,496 0.2%
Non-operational places 597 459 30.1%
Provisional ACAR allocations 601 750 (19.9)%
Total places 5,705 5,705 0.0%
Places (metro/major regional, regional split)
Metro/major regional 4,568 80% 4,548 80% 0.4%
Regional 1,137 20% 1,157 20% (0.4)%
Total places 5,705 100% 5,705 100% 0.0%
Geographic spread (places)
VIC 67% 66%
NSW 13% 13%
QLD 8% 9%
SA 7% 7%
TAS 5% 5%
Total 100% 100%
Funded bed days 1,423,597 1,466,831 (2.9)%Appendix 7: Developments update 25
Significant greenfield & brownfield development program comprising over 400 net new aged care
places and additional seniors living development opportunities
Greenfield developments Program status Total new places Net new places
Newport (Melbourne) Complete 120 120
Belrose (Sydney) Complete 100 100
Mitchelton (Brisbane) Tendered (on hold) 106 106
Lysterfield (Melbourne) Tendered (on hold) 90 90
Hope Island (Gold Coast) Tender 115 115
Total 531 531
Brownfield developments Program status Total new places Net new places
Lower Plenty Garden Views (Melbourne) Tender 50 30
Kelaston (Ballarat) Tendered (on hold) 27 27
Brighton (Adelaide) Tendered (on hold) 54 38
Barongarook Gardens (Colac) Town planning 25 25
Total 156 120
Total new Net new
Seniors living / co-located developments Program status
Seniors units Aged Care places
Mt Eliza (Melbourne) Town planning 95 0
Launceston Concept design 120 0
Brighton (Melbourne) Town planning 95 8
Total 310 8Disclaimer 26 This presentation was prepared by Japara Healthcare Limited (ABN 54 168 631 052) (“the Company”) and was authorised for release by the Board of the Company. Information contained in this presentation is current as at 30 August 2021. This presentation is provided for information purposes only and has been prepared without taking account of any particular reader’s financial situation, objectives or needs. Nothing contained in this presentation constitutes investment, legal, tax or other advice. Accordingly, readers should, before acting on any information in this presentation, consider its appropriateness, having regard to their objectives, financial situation and needs, and seek the assistance of their financial or other licensed professional adviser before making any investment decision. This presentation does not constitute an offer, invitation, solicitation or recommendation with respect to the subscription for, purchase or sale of any security, nor does it form the basis of any contract or commitment. Except as required by law, no representation or warranty, express or implied, is made as to the fairness, accuracy or completeness of the information, opinions and conclusions, or as to the reasonableness of any assumption, contained in this presentation. By reading this presentation and to the extent permitted by law, the reader releases the Company and its affiliates, and any of their respective directors, officers, employees, representatives or advisers from any liability (including, without limitation, in respect of direct, indirect or consequential loss or damage or loss or damage arising by negligence) arising in relation to any reader relying on anything contained in or omitted from this presentation. The forward looking statements included in this presentation involve subjective judgment and analysis and are subject to significant uncertainties, risks and contingencies, many of which are outside the control of, and are unknown to, the Company. In particular, they speak only as of the date of these materials, they assume the success of Japara Healthcare Limited’s business strategies, and they are subject to significant regulatory, business, competitive and economic uncertainties and risks. Actual future events may vary materially from forward looking statements and the assumptions on which those statements are based. Given these uncertainties, readers are cautioned not to place reliance on such forward looking statements. Past performance is not a reliable indicator of future performance.
You can also read