Ted Sarandos appointed co-CEO and elected to Board of Directors
←
→
Page content transcription
If your browser does not render page correctly, please read the page content below
July 16, 2020

Fellow shareholders,

We live in uncertain times with restrictions on what we can do socially and many people are turning to
entertainment for relaxation, connection, comfort and stimulation. In Q1 and Q2, we saw significant
pull-forward of our underlying adoption leading to huge growth in the first half of this year (26 million
paid net adds vs. prior year of 12 million). As a result, we expect less growth for the second half of 2020
compared to the prior year. As we navigate these turbulent circumstances, we’re focused on our
members by continuing to improve the quality of our service and bringing new films and shows to
people's screens. Our Q2 summary results and forecast for Q3 are in the table below.

Ted Sarandos appointed co-CEO and elected to Board of
Directors
Ted joined Netflix over 20 years ago, and we are thrilled to appoint him to be co-CEO with Reed. “Ted
has been my partner for decades. This change makes formal what was already informal -- that Ted and I
share the leadership of Netflix,” says Hastings. Lead Independent director Jay Hoag says “Having
watched Reed and Ted work together for so long, the board and I are confident this is the right step to
evolve Netflix’s management structure so that we can continue to best serve our members and
shareholders for years to come.”

                                                                                                    1
Ted will also continue to serve as Chief Content Officer. In addition, Greg Peters has been appointed
COO adding to his Chief Product Officer role. “We want Greg to help us stay aligned and effective as we
grow so quickly around the world,” said Hastings.
Q2 Results and Q3 Forecast
In Q2, revenue grew 25% year over year, while quarterly operating income exceeded $1 billion. Average
streaming paid memberships in Q2 rose 25% year over year while streaming ARPU increased 0.4% year
over year. Excluding a -$289m impact from foreign exchange (F/X), streaming ARPU grew 5% year over
year. Operating margin expanded 770 basis points year over year to 22.1%, above our guidance forecast
due to higher than expected membership and revenue growth. In addition, content and marketing
expenses were lower than we expected, as the pandemic delayed some planned spend. EPS of $1.59 vs.
$0.60 a year ago included a $119m non-cash unrealized loss from F/X remeasurement on our Euro
denominated debt and a $220m non-cash valuation allowance for deferred tax assets (due to recent
legislation limiting the use of California R&D credits). Our Q2 effective tax rate of 30.5% includes about a
21% point negative impact due to the valuation allowance.
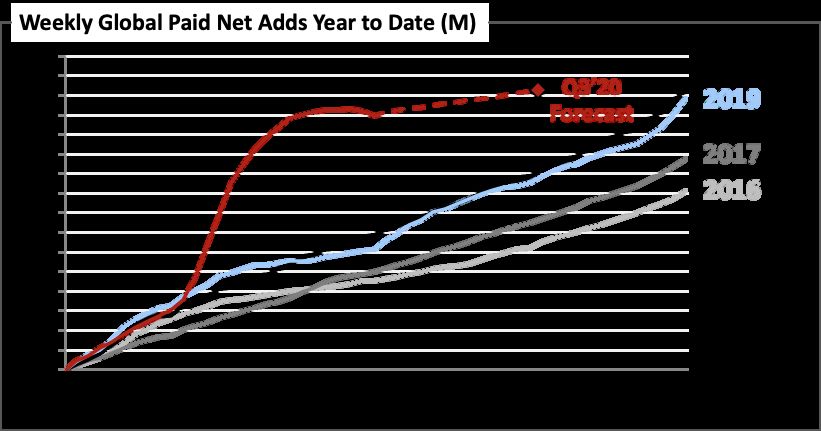
We added a Q2-record 10.1m paid memberships vs. 2.7m in last year’s Q2. The positive variance relative
to our 7.5m forecast was due to better-than-forecast acquisition and retention. In the first half of this
year, we’ve added 26m paid memberships, nearly on par with the 28m we achieved in all of 2019.
However, as we expected (and can be seen in the graph below), growth is slowing as consumers get
through the initial shock of Covid and social restrictions. Our paid net additions for the month of June
also included the subscriptions we cancelled for the small percentage of members who had not used the
service recently.
2The quarterly guidance we provide is our actual internal forecast at the time we report and we strive for
accuracy. We forecast 2.5m paid net adds for Q3’20 vs. 6.8m in the prior year quarter. As we indicated in
our Q1’20 letter, we’re expecting paid net adds will be down year over year in the second half as our
strong first half performance likely pulled forward some demand from the second half of the year. In
addition, Q3’19 included the positive impact of new seasons of both Stranger Things and La Casa de
Papel (a ka Money Heist). We continue to view the quarter-to-quarter fluctuations in paid net adds as not
that meaningful in the context of the long run adoption of internet entertainment which we believe
provides us with many years of strong growth ahead.
For the full year 2020, we’re still targeting a 16% operating margin. We’re currently on track to exceed
16% although F/X (and the relative strength of the US dollar) remains a wildcard. As always, our
intention is to grow our annual operating margin year over year - we’re currently targeting 19% for
2021.
Content
As the world slowly re-opens, our main business priority is to restart our productions safely and in a
manner consistent with local health and safety standards to ensure that our members can enjoy a
diverse range of high quality new content. Given the significant differences between countries (e.g.,
incidence of new Covid-19 cases, availability of testing, government and industry regulations), there is
no one-size-fits-all approach, and we’re adapting to local circumstances.
Today, we’re slowly resuming productions in many parts of the world. We are furthest along in Asia
Pacific (where we never fully shut down in Korea, for example) and are now shooting live action series
like season 2 of our Japanese original The Naked Director. In EMEA, we are now back in production in
many countries, including Germany, France, Spain, Poland, Italy, and the UK. While we recently resumed
production on two films in California and two stop-motion animation projects in Oregon and expect
some more of our US productions to get going this quarter, current infection trends create more
uncertainty for our productions in the US. Parts of the world like India and some of Latin America are
also more challenging and we are hoping to restart later in the year in these regions.
Since our content production lead time is long, our 2020 plans for launching original shows and films
continue to be largely intact. For 2021, based on our current plan, we expect the paused productions
will lead to a more second half weighted content slate in terms of our big titles, although we anticipate
the total number of originals for the full year will still be higher than 2020. We’ll also round out our
content offering with film acquisitions like The Trial of the Chicago 7 from Aaron Sorkin and The
Spongebob Movie: Sponge on the Run (global excluding US and China). We also acquired nearly
completed seasons of unreleased original series like Cobra Kai (seasons 1, 2 and a brand new season 3)
and Emily in Paris starring Lily Collins.
The pandemic and pauses in production are impacting our competitors and suppliers similarly. With our
large library of thousands of titles and strong recommendations, we believe our member satisfaction
will remain high.
3In Q2, we notched successes in many of our key content verticals. In English scripted TV, Never Have I
Ever, a fun, young adult dramedy from Mindy Kaling, broke through with 40m households choosing to
watch this show in its first four weeks, and 40m households for our new comedy Space Force (starring
Steve Carell). On the heels of Love is Blind, T oo Hot to Handle and Floor is Lava are the latest in our line
of buzzy unscripted shows (51m and a projected 37m households, respectively, in the first four weeks).
In original films, 27 million households chose to watch Spike Lee’s Da 5 Bloods, which was celebrated as
a “soul stirring film for the ages.” Extraction (starring Chris Hemsworth) and The Wrong Missy, a comedy
starring David Spade and Lauren Lapkus, were also big hits with audiences (99m and 59m households,
respectively, chose to watch in their first 28 days). In addition, The Willoughbys (38m households in the
first four weeks) is an example of the level of animated feature film we are ramping towards to bolster
our offering for kids and families.
We also saw increased viewing for some older titles like 13th, American Son and Dear White People - all
part of our Black Lives Matter Collection - as our members sought out stories that speak to racial
injustice and the Black experience in America.
Our local language originals - like Dark in Germany, C
ontrol Z in Mexico, Extracurricular in Korea, The
Woods in Poland, or Blood & Water in South Africa - continue to be highly impactful, driving large
viewing, buzz and sign-ups in their home countries. We continue to see these stories find audiences all
over the world. The best example of this was La Casa de Papel (aka Money Heist): Part 4, which we
launched on April 3; through its first 28 days, 65m households chose to watch this hit show.
For Q3, we recently released The Old Guard (starring Charlize Theron), which continues our recent string
of adrenaline-filled action movies. Later in July, we’re looking forward to launching season 2 of The
Umbrella Academy, followed by The Kissing Booth 2 (the sequel to our hit romantic comedy), Project
Power (an action movie starring Jamie Foxx) and Enola Holmes (featuring Millie Bobbie Brown as the
sister of Sherlock Holmes, played by Henry Cavill) later in the quarter.
Product and Partnerships
We continue to test different pricing approaches in some countries including lower priced, mobile-only
plans and our bundled offerings with MVPDs and ISPs. While some of these carry lower ARPU, the goal is
to accelerate membership growth on neutral-to-better short term revenue (with incremental acquisition
and improved retention offsetting the lower price). We think this strategy will increase long term
revenue as a larger membership base can generate more word-of-mouth around our content and help
us better understand peoples’ needs in that country - so that we can more quickly improve our catalog
and product experience, which would then lead to higher member satisfaction and growth as well as
improved long term retention.
A very small percentage of our members have not watched anything for the last two years and although
we make it easy for people to cancel their subscriptions with just a few clicks, they have not taken
advantage of that ability. So we decided to stop billing them and will do so for members meeting the
same criteria going forward. Like all of our former members, they can easily restart their membership in
the future. While this change resulted in a slight hit to revenue, we believe that pro-consumer policies
4like this are the right thing to do and that the long term benefits will outweigh the short term costs. In a
world where consumers have many subscriptions, auto-pause on billing after an extended period of
non-use should be how leading services operate.
Competition
All of the major entertainment companies like WarnerMedia, Disney and NBCUniversal are pushing their
own streaming services and two of the most valuable companies in the world, Apple and Amazon, are
growing their investment in premium content. In addition, TikTok’s growth is astounding, showing the
fluidity of internet entertainment. Instead of worrying about all these competitors, we continue to stick
to our strategy of trying to improve our service and content every quarter faster than our peers. Our
continued strong growth is a testament to this approach and the size of the entertainment market.
Cash Flow and Capital Structure
Net cash generated in operating activities in Q2 was +$1 billion vs. -$544 million in the prior year period.
Free cash flow1 was positive for a second consecutive quarter at +$899m vs. -$594 million. Free cash
flow was higher than net income due primarily to the loss on FX remeasurement and the valuation
allowance for deferred tax assets, both of which were non-cash items that reduced net income.
Our FCF profile is continuing to improve, which is being driven in part by our growing operating margin
and the digestion of our big move into the production of Netflix originals that requires more cash
upfront vs. licensed content. In addition, the pause in production has also pushed out cash spending on
content into the second half of 2020 and into 2021.
Due to the pause in production from the pandemic combined with higher-than-forecast paid net adds
year to date, we now expect free cash flow for the full year 2020 to be breakeven to positive, compared
with our prior expectation for -$1 billion or better. As we indicated last quarter, in 2021 we project that
full year free cash flow will dip back to being negative again, although we believe the FCF deficit will be
materially better than our peak deficit level of -$3.3 billion in 2019. There has been no material change
in our overall estimated timetable to reach consistent annual positive FCF within the next few years.
We’re often asked by investors what our FCF profile would be at “steady state” or when our cash
content spending matches our content amortization. The pandemic and the resulting pause in
productions provides one early snapshot of what that may look like. In Q2’20, our cash spending on
content was $2.6 billion, equivalent to our content amortization of $2.6 billion, or a 1x cash
content-to-content amortization ratio2. This resulted in a FCF margin of +15% in Q2. Of course, our plan
is to continue to grow our content spend (as we don’t believe we are anywhere near maturity), but the
above analysis may prove illustrative. And by the time our cash content-to-content amortization ratio
1
For a reconciliation of free cash flow to net cash provided by (used in) operating activities, please refer
to the reconciliation in tabular form on the attached unaudited financial statements and the footnotes
thereto.
2
For additional details on these concepts, please refer to our Content Accounting Overview slide deck on
our investor relations site.
5reaches 1x on a sustained basis (which is still many years away), we hope to have many more members
and much greater revenue, operating margin and FCF.
In April, we raised $1 billion of debt at a blended rate of ~3.3% across both US dollar and Euro tranches.
We ended Q2 with more than $7 billion of cash and cash equivalents on our balance sheet.
As part of our commitment to racial equity, we allocated about two percent of our cash holdings -
initially up to $100 million - into financial institutions and organizations that directly support Black
communities in the US. We hope other US large-caps will also consider taking this small and relatively
easy step to bolster US racial economic equity.
With our cash balance, $750 million credit facility (which remains undrawn) and improving FCF profile,
we have sufficient liquidity to fund our operations for over 12 months. As a result, we don’t expect to
access the debt markets for the remainder of 2020 and we believe our need for external financing is
diminishing.
Reference
For quick reference, our eight most recent investor letters are: April 2020, January 2020, October 2019,
July 2019, April 2019, January 2019, October 2018, July 2018.
6Regional Breakdown
July 16, 2020 Earnings Interview, 3pm PT
Our video interview with Kannan Venkateshwar of Barclays Capital will be on youtube/netflixir at 3pm
PT today. Questions that investors would like to see asked should be sent to
kannan.venkateshwar@barclayscapital.com. Reed Hastings, co-CEO, Spence Neumann, CFO, Ted
Sarandos, co-CEO and Chief Content Officer, Greg Peters, COO and Chief Product Officer and Spencer
Wang, VP of IR/Corporate Development will all be on the video to answer Kannan’s questions.
7IR Contact: PR Contact:
Spencer Wang Richard Siklos
VP, Finance/IR & Corporate Development VP, Communications 408 540-2629
408 809-5360
Use of Non-GAAP Measures
This shareholder letter and its attachments include reference to the non-GAAP financial measure of free
cash flow and adjusted EBITDA. Management believes that free cash flow and adjusted EBITDA are
important liquidity metrics because they measure, during a given period, the amount of cash generated
that is available to repay debt obligations, make investments and for certain other activities or the
amount of cash used in operations, including investments in global streaming content. However, these
non-GAAP measures should be considered in addition to, not as a substitute for or superior to, net
income, operating income, diluted earnings per share and net cash provided by operating activities, or
other financial measures prepared in accordance with GAAP. Reconciliation to the GAAP equivalent of
these non-GAAP measures are contained in tabular form on the attached unaudited financial
statements.
Forward-Looking Statements
This shareholder letter contains certain forward-looking statements within the meaning of the federal
securities laws, including statements regarding future content offerings and the timing of such offerings,
including the uncertainty introduced by the Coronavirus pandemic; restarting productions; watch
metrics for certain titles; product tests, including those around pricing, and the anticipated impact of
such tests; impact of competition; future capital raises and external financing needs; global streaming
paid members, paid net additions and membership growth; paid net additions, consolidated revenue,
revenue growth, operating income, operating margin, net income, and earnings per share; and free cash
flow, including future free cash flow profile and margin. The forward-looking statements in this letter
are subject to risks and uncertainties that could cause actual results and events to differ, including,
without limitation: our ability to attract new members and retain existing members; our ability to
compete effectively; maintenance and expansion of device platforms for streaming; fluctuations in
consumer usage of our service; service disruptions; production risks, including those related to the
Coronavirus pandemic; and, competition, including consumer adoption of different modes of viewing
in-home filmed entertainment. A detailed discussion of these and other risks and uncertainties that
could cause actual results and events to differ materially from such forward-looking statements is
included in our filings with the Securities and Exchange Commission, including our Annual Report on
Form 10-K, filed with the Securities and Exchange Commission (“SEC”) on January 29, 2020, as updated
in our Quarterly Report on Form 10-Q for the quarter ended March 31, 2020. The Company provides
internal forecast numbers. Investors should anticipate that actual performance will vary from these
forecast numbers based on risks and uncertainties discussed above and in our Annual Report on Form
10-K, as updated by Form 10-Q for the quarter ended March 31, 2020. We undertake no obligation to
update forward-looking statements to reflect events or circumstances occurring after the date of this
shareholder letter.
8Netflix, Inc.
Consolidated Statements of Operations
(unaudited)
(in thousands, except per share data)
Three Months Ended Six Months Ended
June 30, March 31, June 30, June 30, June 30,
2020 2020 2019 2020 2019
Revenues $ 6,148,286 $ 5,767,691 $ 4,923,116 $ 11,915,977 $ 9,444,108
Cost of revenues 3,643,707 3,599,701 3,005,657 7,243,408 5,876,271
Marketing 434,370 503,830 603,150 938,200 1,219,728
Technology and development 435,045 453,817 383,233 888,862 755,997
General and administrative 277,236 252,087 224,657 529,323 426,609
Operating income 1,357,928 958,256 706,419 2,316,184 1,165,503
Other income (expense):
Interest expense (189,151) (184,083) (152,033) (373,234) (287,562)
Interest and other income (expense) (133,175) 21,697 (53,470) (111,478) 22,634
Income before income taxes 1,035,602 795,870 500,916 1,831,472 900,575
Provision for income taxes 315,406 86,803 230,266 402,209 285,873
Net income $ 720,196 $ 709,067 $ 270,650 $ 1,429,263 $ 614,702
Earnings per share:
Basic $ 1.63 $ 1.61 $ 0.62 $ 3.25 $ 1.41
Diluted $ 1.59 $ 1.57 $ 0.60 $ 3.15 $ 1.36
Weighted-average common shares outstanding:
Basic 440,569 439,352 437,587 439,961 437,271
Diluted 453,945 452,494 452,195 453,220 452,063
9Netflix, Inc.
Consolidated Balance Sheets
(in thousands)
As of
June 30, December 31,
2020 2019
(unaudited)
Assets
Current assets:
Cash and cash equivalents $ 7,153,248 $ 5,018,437
Other current assets 1,410,891 1,160,067
Total current assets 8,564,139 6,178,504
Content assets, net 25,155,117 24,504,567
Property and equipment, net 751,941 565,221
Other non-current assets 2,704,084 2,727,420
Total assets $ 37,175,281 $ 33,975,712
Liabilities and Stockholders' Equity
Current liabilities:
Current content liabilities $ 4,664,733 $ 4,413,561
Accounts payable 446,668 674,347
Accrued expenses and other liabilities 986,595 843,043
Deferred revenue 1,029,261 924,745
Short-term debt 499,161 —
Total current liabilities 7,626,418 6,855,696
Non-current content liabilities 3,208,164 3,334,323
Long-term debt 15,294,998 14,759,260
Other non-current liabilities 1,710,948 1,444,276
Total liabilities 27,840,528 26,393,555
Stockholders' equity:
Common stock 3,127,813 2,793,929
Accumulated other comprehensive loss (34,072) (23,521)
Retained earnings 6,241,012 4,811,749
Total stockholders' equity 9,334,753 7,582,157
Total liabilities and stockholders' equity $ 37,175,281 $ 33,975,712
10Netflix, Inc.
Consolidated Statements of Cash Flows
(unaudited)
(in thousands)
Three Months Ended Six Months Ended
June 30, March 31, June 30, June 30, June 30,
2020 2020 2019 2020 2019
Cash flows from operating activities:
Net income $ 720,196 $ 709,067 $ 270,650 $ 1,429,263 $ 614,702
Adjustments to reconcile net income to net cash provided
by (used in) operating activities:
Additions to content assets (2,510,782) (3,294,275) (3,325,103) (5,805,057) (6,322,849)
Change in content liabilities (108,432) 258,945 (12,414) 150,513 (27,112)
Amortization of content assets 2,607,159 2,483,385 2,231,915 5,090,544 4,356,601
Depreciation and amortization of property, equipment
and intangibles 26,661 28,517 25,496 55,178 49,057
Stock-based compensation expense 104,210 97,019 103,848 201,229 205,048
Other non-cash items 70,301 65,448 60,695 135,749 106,403
Foreign currency remeasurement loss (gain) on debt 119,161 (93,060) 61,284 26,101 3,684
Deferred taxes 223,308 46,619 35,519 269,927 42,146
Changes in operating assets and liabilities:
Other current assets 3,066 (127,353) (24,231) (124,287) (56,307)
Accounts payable (112,027) (149,153) (2,674) (261,180) (127,141)
Accrued expenses and other liabilities (105,450) 214,191 (26,705) 108,741 130,942
Deferred revenue 42,508 62,008 84,085 104,516 131,878
Other non-current assets and liabilities (38,803) (41,446) (26,119) (80,249) (30,605)
Net cash provided by (used in) operating
activities 1,041,076 259,912 (543,754) 1,300,988 (923,553)
Cash flows from investing activities:
Purchases of property and equipment (141,741) (98,015) (39,584) (239,756) (99,965)
Change in other assets (260) (288) (10,452) (548) (30,174)
Net cash used in investing activities (142,001) (98,303) (50,036) (240,304) (130,139)
Cash flows from financing activities:
Proceeds from issuance of debt 1,009,464 — 2,243,196 1,009,464 2,243,196
Debt issuance costs (7,559) — (18,192) (7,559) (18,192)
Proceeds from issuance of common stock 89,060 43,694 21,896 132,754 44,868
Net cash provided by financing activities 1,090,965 43,694 2,246,900 1,134,659 2,269,872
Effect of exchange rate changes on cash, cash equivalents,
and restricted cash 11,819 (70,902) 4,998 (59,083) (16)
Net increase in cash, cash equivalents, and restricted cash 2,001,859 134,401 1,658,108 2,136,260 1,216,164
Cash, cash equivalents and restricted cash at beginning of
period 5,178,187 5,043,786 3,370,097 5,043,786 3,812,041
Cash, cash equivalents and restricted cash at end of period $ 7,180,046 $ 5,178,187 $ 5,028,205 $ 7,180,046 $ 5,028,205
Three Months Ended Six Months Ended
June 30, March 31, June 30, June 30, June 30,
2020 2020 2019 2020 2019
Non-GAAP free cash flow reconciliation:
Net cash provided by (used in) operating activities $ 1,041,076 $ 259,912 $ (543,754) $ 1,300,988 $ (923,553)
Net cash used in investing activities (142,001) (98,303) (50,036) (240,304) (130,139)
Non-GAAP free cash flow $ 899,075 $ 161,609 $ (593,790) $ 1,060,684 $ (1,053,692)
11Netflix, Inc.
Non-GAAP Information
(unaudited)
(in thousands)
June 30, September 30, December 31, March 31, June 30,
2019 2019 2019 2020 2020
Non-GAAP Adjusted EBITDA reconciliation:
GAAP net income $ 270,650 $ 665,244 $ 586,970 $ 709,067 $ 720,196
Add:
Other expense (income) 205,503 (32,084) 309,179 162,386 322,326
Provision for (benefit from) income taxes 230,266 347,079 (437,637) 86,803 315,406
Depreciation and amortization of property,
equipment and intangibles 25,496 26,704 27,818 28,517 26,661
Stock-based compensation expense 103,848 100,262 100,066 97,019 104,210
Adjusted EBITDA $ 835,763 $ 1,107,205 $ 586,396 $ 1,083,792 $ 1,488,799
12You can also read