Articulated Pose Estimation by a Graphical Model with Image Dependent Pairwise Relations
←
→
Page content transcription
If your browser does not render page correctly, please read the page content below
Articulated Pose Estimation by a Graphical Model
        with Image Dependent Pairwise Relations

                   Xianjie Chen                                       Alan Yuille
       University of California, Los Angeles             University of California, Los Angeles
             Los Angeles, CA 90024                             Los Angeles, CA 90024
                 cxj@ucla.edu                               yuille@stat.ucla.edu

                                              Abstract

         We present a method for estimating articulated human pose from a single static
         image based on a graphical model with novel pairwise relations that make adap-
         tive use of local image measurements. More precisely, we specify a graphical
         model for human pose which exploits the fact the local image measurements can
         be used both to detect parts (or joints) and also to predict the spatial relationships
         between them (Image Dependent Pairwise Relations). These spatial relationships
         are represented by a mixture model. We use Deep Convolutional Neural Networks
         (DCNNs) to learn conditional probabilities for the presence of parts and their spa-
         tial relationships within image patches. Hence our model combines the represen-
         tational flexibility of graphical models with the efficiency and statistical power of
         DCNNs. Our method significantly outperforms the state of the art methods on the
         LSP and FLIC datasets and also performs very well on the Buffy dataset without
         any training.

1   Introduction
Articulated pose estimation is one of the fundamental challenges in computer vision. Progress in
this area can immediately be applied to important vision tasks such as human tracking [2], action
recognition [25] and video analysis.
Most work on pose estimation has been based on graphical model [8, 6, 27, 1, 10, 2, 4]. The graph
nodes represent the body parts (or joints), and the edges model the pairwise relationships between
the parts. The score function, or energy, of the model contains unary terms at each node which
capture the local appearance cues of the part, and pairwise terms defined at the edges which capture
the local contextual relations between the parts. Recently, DeepPose [23] advocates modeling pose
in a holistic manner and captures the full context of all body parts in a Deep Convolutional Neural
Network (DCNN) [12] based regressor.
In this paper, we present a graphical model with image dependent pairwise relations (IDPRs). As
illustrated in Figure 1, we can reliably predict the relative positions of a part’s neighbors (as well as
the presence of the part itself) by only observing the local image patch around it. So in our model
the local image patches give input to both the unary and pairwise terms. This gives stronger pairwise
terms because data independent relations are typically either too loose to be helpful or too strict to
model highly variable poses.
Our approach requires us to have a method that can extract information about pairwise part relations,
as well as part presence, from local image patches. We require this method to be efficient and to
share features between different parts and part relationships. To do this, we train a DCNN to output

                                                   1
Lower Arm:     Upper Arm:     Elbow:   Wrist:

Figure 1: Motivation. The local image measurements around a part, e.g., in an image patch, can reliably
predict the relative positions of all its neighbors (as well as detect the part). Center Panel: The local image
patch centered at the elbow can reliably predict the relative positions of the shoulder and wrist, and the local
image patch centered at the wrist can reliably predict the relative position of the elbow. Left & Right Panels: We
define different types of pairwise spatial relationships (i.e., a mixture model) for each pair of neighboring parts.
The Left Panel shows typical spatial relationships the elbow can have with its neighbors, i.e., the shoulder and
wrist. The Right Panel shows typical spatial relationships the wrist can have with its neighbor, i.e., the elbow.

estimates for the part presence and spatial relationships which are used in our unary and pairwise
terms of our score function. The weight parameters of different terms in the model are trained using
Structured Supported Vector Machine (S-SVM) [24]. In summary, our model combines the rep-
resentational flexibility of graphical models, including the ability to represent spatial relationships,
with the data driven power of DCNNs.
We perform experiments on two standard pose estimation benchmarks: LSP dataset [10] and FLIC
dataset [20]. Our method outperforms the state of the art methods by a significant margin on both
datasets. We also do cross-dataset evaluation on Buffy dataset [7] (without training on this dataset)
and obtain strong results which shows the ability of our model to generalize.

2    The Model

The Graphical Model and its Variables: We represent human pose by a graphical model G =
(V, E) where the nodes V specify the positions of the parts (or joints) and the edges E indicates
which parts are spatially related. For simplicity, we impose that the graph structure forms a K−node
tree, where K = |V|. The positions of the parts are denoted by l, where li = (x, y) specifies the
pixel location of part i, for i ∈ {1, . . . , K}. For each edge in the graph (i, j) ∈ E, we specify a
discrete set of spatial relationships indexed by tij , which corresponds to a mixture of different spatial
relationships (see Figure 1). We denote the set of spatial relationships by t = {tij , tji |(i, j) ∈ E}.
The image is written as I. We will define a score function F (l, t|t) as follows as a sum of unary and
pairwise terms.
Unary Terms: The unary terms give local evidence for part i ∈ V to lie at location li and is based
on the local image patch I(li ). They are of form:
                                          U (li |I) = wi φ(i|I(li ); θ),                                        (1)
where φ(.|.; θ) is the (scalar-valued) appearance term with θ as its parameters (specified in the next
section), and wi is a scalar weight parameter.
Image Dependent Pairwise Relational (IDPR) Terms: These IDPR terms capture our intuition
that neighboring parts (i, j) ∈ E can roughly predict their relative spatial positions using only local
information (see Figure 1). In our model, the relative positions of parts i and j are discretized
into several types tij ∈ {1, . . . , Tij } (i.e., a mixture of different relationships) with corresponding
                          t
mean relative positions rijij plus small deformations which are modeled by the standard quadratic

                                                         2
deformation term. More formally, the pairwise relational score of each edge (i, j) ∈ E is given by:
                                                 t                   t
                R(li , lj , tij , tji |I) =   hwijij , ψ(lj − li − rijij )i + wij ϕ(tij |I(li ); θ)
                                                t                   t
                                                                                                   ,       (2)
                                       +      hwjiji , ψ(li − lj − rjiji )i + wji ϕ(tji |I(lj ); θ)

where ψ(∆l = [∆x, ∆y]) = [∆x ∆x2 ∆y ∆y 2 ]| are the standard quadratic deformation features,
ϕ(.|.; θ) is the Image Dependent Pairwise Relational (IDPR) term with θ as its parameters (specified
                           t             t
in the next section), and wijij , wij , wjiji , wji are the weight parameters. The notation h., .i specifies
dot product and boldface indicates a vector.
The Full Score: The full score F (l, t|I) is a function of the part locations l, the pairwise relation
types t, and the input image I. It is expressed as the sum of the unary and pairwise terms:
                                  X                X
                     F (l, t|I) =      U (li |I) +       R(li , lj , tij , tji |I) + w0 ,          (3)
                                       i∈V              (i,j)∈E

where w0 is a scalar weight on constant 1 (i.e., the bias term).
                                                                                               t       t
The model consists of three sets of parameters: the mean relative positions r = {rijij , rjiji |(i, j) ∈ E}
of different pairwise relation types; the parameters θ of the appearance terms and IDPR terms; and
                                        t          t
the weight parameters w (i.e., wi , wijij , wij , wjiji , wji and w0 ). See Section 4 for the learning of
these parameters.

2.1   Image Dependent Terms and DCNNs

The appearance terms and IDPR terms depend on the image patches. In other words, a local image
patch I(li ) not only gives evidence for the presence of a part i, but also about the relationship tij
between it and its neighbors j ∈ N(i), where j ∈ N(i) if, and only if, (i, j) ∈ E. This requires
us to learn distribution for the state variables i, tij conditioned on the image patches I(li ). In order
to specify this distribution we must define the state space more precisely, because the number of
pairwise spatial relationships varies for different parts with different numbers of neighbors (see
Figure 1), and we need also consider the possibility that the patch does not contain a part.
We define c to be the random variable which denotes which part is present c = i for i ∈ {1, ..., K}
or c = 0 if no part is present (i.e., the background). We define mcN(c) to be the random variable that
determines the spatial relation types of c and takes values in McN(c) . If c = i has one neighbor j
(e.g., the wrist), then MiN(i) = {1, . . . , Tij }. If c = i has two neighbors j and k (e.g., the elbow),
then MiN(i) = {1, . . . , Tij } × {1, . . . , Tik }. If c = 0, then we define M0N(0) = {0}.
The full space is represented as:
                                              S = ∪K
                                                   c=0 {c} × McN(c)                                        (4)
                                   PK
The size of the space is |S| = c=0 |McN(c) |. Each element in this space corresponds to a part with
all the types of its pairwise relationships, or the background.
We use DCNN [12] to learn the conditional probability distribution p(c, mcN(c) |I(li ); θ). DCNN is
suitable for this task because it is very efficient and enables us to share features. See section 4 for
more details.
We specify the appearance terms φ(.|.; θ) and IDPR terms ϕ(.|.; θ) in terms of p(c, mcN(c) |I(li ); θ)
by marginalization:
                           φ(i|I(li ); θ) = log(p(c = i|I(li ); θ))                                        (5)
                          ϕ(tij |I(li ); θ) = log(p(mij = tij |c = i, I(li ); θ))                          (6)

2.2   Relationship to other models

We now briefly discuss how our method relates to standard models.
Pictorial Structure: We recover pictorial structure models [6] by only allowing one relationship
type (i.e., Tij = 1). In this case, our IDPR term conveys no information. Our model reduces to

                                                          3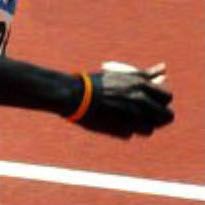
standard unary and (image independent) pairwise terms. The only slight difference is that we use
DCNN to learn the unary terms instead of using HOG filters.
Mixtures-of-parts: [27] describes a model with a mixture of templates for each part, where each
template is called a “type” of the part. The “type” of each part is defined by its relative position with
respect to its parent. This can be obtained by restricting each part in our model to only predict the
relative position of its parent (i.e., Tij = 1, if j is not parent of i). In this case, each part is associated
with only one informative IDPR term, which can be merged with the appearance term of each part
to define different “types” of part in [27]. Also this method does not use DCNNs.
Conditional Random Fields (CRFs): Our model is also related to the conditional random field
literature on data-dependent priors [18, 13, 15, 19]. The data-dependent priors and unary terms
are typically modeled separately in the CRFs. In this paper, we efficiently model all the image
dependent terms (i.e. unary terms and IDPR terms) together in a single DCNN by exploiting the fact
the local image measurements are reliable for predicting both the presence of a part and the pairwise
relationships of a part with its neighbors.

3    Inference
To detect the optimal configuration for each person, we search for the configurations of the locations
l and types t that maximize the score function: (l∗ , t∗ ) = arg maxl,t F (l, t|I). Since our relational
graph is a tree, this can be done efficiently via dynamic programming.
Let K(i) be the set of children of part i in the graph (K(i) = ∅, if part i is a leaf), and Si (li |I) be
maximum score of the subtree rooted at part i with part i located at li . The maximum score of each
subtree can be computed as follow:
                                         X
                Si (li |I) = U (li |I) +       max (R(li , lk , tik , tki |I) + Sk (lk |I))           (7)
                                                  lk ,tik ,tki
                                         k∈K(i)

Using Equation 7, we can recursively compute the overall best score of the model, and the optimal
configuration of locations and types can be recovered by the standard backward pass of dynamic
programming.
Computation: Since our pairwise term is a quadratic function of locations, li and lj , the max
operation over lk in Equation 7 can be accelerated by using the generalized distance transforms [6].
The resulting approach is very efficient, taking O(T 2 LK) time once the image dependent terms are
computed, where T is the number of relation types, L is the total number of locations, and K is the
total number of parts in the model. This analysis assumes that all the pairwise spatial relationships
have the same number of types, i.e., Tij = Tji = T, ∀(i, j) ∈ E.
The computation of the image dependent terms is also efficient. They are computed over all the
locations by a single DCNN. Applying DCNN in a sliding fashion is inherently efficient, since the
computations common to overlapping regions are naturally shared [22].

4    Learning
Now we consider the problem of learning the model parameters from images with labeled part
locations, which is the data available in most of the human pose datasets [17, 7, 10, 20]. We derive
type labels tij from part location annotations and adopt a supervised approach to learn the model.
Our model consists of three sets of parameters: the mean relative positions r of different pairwise
relation types; the parameters θ of the image dependent terms; and the weight parameters w. They
are learnt separately by the K-means algorithm for r, DCNN for θ, and S-SVM for w.
Mean Relative Positions and Type Labels: Given the labeled positive images {(In , ln )}N      n=1 , let
dij be the relative position from part i to its neighbor j. We cluster the relative positions over the
training set {dnij }N
                    n=1 to get Tij clusters (in the experiments Tij = 11 for all pairwise relations).
Each cluster corresponds to a set of instances of part i that share similar spatial relationship with
its neighbor part j. Thus we define each cluster as a pairwise relation type tij from part i to j in
                                                                              t
our model, and use the center of each cluster as the mean relative position rijij associated with each

                                                          4
type. In this way, the mean relative positions of different pairwise relation types are learnt, and the
type label tnij for each training instance is derived based on its cluster index. We use K-means in our
experiments by setting K = Tij to do the clustering.
Parameters of Image Dependent Terms: After deriving type labels, each local image patch I(ln )
centered at an annotated part location is labeled with category label cn ∈ {1, . . . , K}, that indi-
cates which part is present, and also the type labels mncn N(cn ) that indicate its relation types with
all its neighbors. In this way, we get a set of labelled patches {I(ln ), cn , mncn N(cn ) }KN
                                                                                            n=1 from pos-
itive images (each positive image provides K part patches), and also a set of background patches
{I(ln ), 0, 0} sampled from negative images.
Given the labelled part patches and background patches, we train a multi-class DCNN classifier by
standard stochastic gradient descent using softmax loss. The DCNN consists of five convolutional
layers, 2 max-pooling layers and three fully-connected layers with a final |S| dimensions softmax
output, which is defined as our conditional probability distribution, i.e., p(c, mcN(c) |I(li ); θ). The
architecture of our network is summarized in Figure 2.
Weight Parameters: Each pose in the positive image is now labeled with annotated part locations
and derived type labels: (In , ln , tn ). We use S-SVM to learn the weight parameters w. The structure
prediction problem is simplified by using 0 − 1 loss, that is all the training examples either have all
dimensions of its labels correct or all dimensions of its labels wrong. We denote the former ones
as pos examples, and the later ones as neg examples. Since the full score function (Equation 3) is
linear in the weight parameters w, we write the optimization function as:
                          1                 X
                     min hw, wi + C             max(0, 1 − yn hw, Φ(In , ln , tn )i),              (8)
                       w 2
                                             n

where yn ∈ {1, −1}, and Φ(In , ln , tn ) is a sparse feature vector representing the n-th example
and is the concatenation of the image dependent terms (calculated from the learnt DCNN), spatial
deformation features, and constant 1. Here yn = 1 if n ∈ pos, and yn = −1 if n ∈ neg.

5     Experiment

This section introduces the datasets, clarifies the evaluation metrics, describes our experimental
setup, presents comparative evaluation results and gives diagnostic experiments.

5.1   Datasets and Evaluation Metrics

We perform our experiments on two publicly available human pose estimation benchmarks: (i)
the “Leeds Sports Poses” (LSP) dataset [10], that contains 1000 training and 1000 testing images
from sport activities with annotated full-body human poses; (ii) the “Frames Labeled In Cinema”
(FLIC) dataset [20] that contains 3987 training and 1016 testing images from Hollywood movies
with annotated upper-body human poses. We follow previous work and use the observer-centric
annotations on both benchmarks. To train our models, we also use the negative training images from
the INRIAPerson dataset [3] (These images do not contain people).
We use the most popular evaluation metrics to allow comparison with previous work. Percentage
of Correct Parts (PCP) is the standard evaluation metric on several benchmarks including the LSP
dataset. However, as discussed in [27], there are several alternative interpretations of PCP that can
lead to severely different results. In our paper, we use the stricter version unless otherwise stated,
that is we evaluate only a single highest-scoring estimation result for one test image and a body part
is considered as correct if both of its segment endpoints (joints) lie within 50% of the length of the
ground-truth annotated endpoints (Each test image on the LSP dataset contains only one annotated
person). We refer to this version of PCP as strict PCP.
On the FLIC dataset, we use both strict PCP and the evaluation metric specified with it [20]: Per-
centage of Detected Joints (PDJ). PDJ measures the performance using a curve of the percentage
of correctly localized joints by varying localization precision threshold. The localization precision
threshold is normalized by the scale (defined as distance between left shoulder and right hip) of each
ground truth pose to make it scale invariant. There are multiple people in the FLIC images, so each

                                                   5
7
5
3
7 conv conv 3 3 3
+ +
5
3
dense dense
conv
conv
conv
OR norm norm
3
3
3
+ + dense
+ + dropout dropout
pool pool
9x
9x
9x
9x
18
9
9
9
9
128
x1
128 128 128
8
32
36
x3
54
6
3 4096 4096 |S|
x5
4
3
Figure 2: Architectures of our DCNNs. The size of input patch is 36 × 36 pixels on the LSP dataset, and
54 × 54 pixels on the FLIC dataset. The DCNNs consist of five convolutional layers, 2 max-pooling layers
and three fully-connected (dense) layers with a final |S| dimensions output. We use dropout, local response
normalization (norm) and overlapping pooling (pool) described in [12].
ground truth person is also annotated with a torso detection box. During evaluation, we return a
single highest-scoring estimation result for each ground truth person by restricting our neck part to
be localized inside a window defined by the provided torso box.
5.2 Implementation detail
Data Augmentation: Our DCNN has millions of parameters, while only several thousand of train-
ing images are available. In order to reduce overfitting, we augment the training data by rotating
the positive training images through 360◦ . These images are also horizontally flipped to double the
training images. This increases the number of training examples of body parts with different spatial
relationships with its neighbors (See the elbows along the diagonal of the Left Panel in Figure 1).
We hold out random positive images as a validation set for the DCNN training. Also the weight
parameters w are trained on this held out set to reduce overfitting to training data.
Note that our DCNN is trained using local part patches and background patches instead of the whole
images. This naturally increases the number of training examples by a factor of K (the number of
parts). Although the number of dimensions of the DCNN final output also increases linearly with the
number of parts, the number of parameters only slightly increase in the last fully-connected layer.
This is because most of the parameters are shared between different parts, and thus we can benefit
from larger K by having more training examples per parameter. In our experiments, we increase K
by adding the midway points between annotated parts, which results in 26 parts on the LSP dataset
and 18 parts on the FLIC dataset. Covering a person by more parts also reduces the distance between
neighboring parts, which is good for modeling foreshortening [27].
Graph Structure: We define a full-body graph structure for the LSP dataset, and a upper-body
graph structure for the FLIC dataset respectively. The graph connects the annotated parts and their
midways points to form a tree (See the skeletons in Figure 5 for clarification).
Settings: We use the same number of types for all pairs of neighbors for simplicity. We set it as
11 on all datasets (i.e., Tij = Tji = 11, ∀(i, j) ∈ E), which results in 11 spatial relation types
for the parts with one neighbor (e.g., the wrist), 112 spatial relation types for the parts with two
neighbors (e.g., the elbow), and so forth (recall Figure 1). The patch size of each part is set as
36 × 36 pixels on the LSP dataset, and 54 × 54 pixels on the FLIC dataset, as the FLIC images are
of higher resolution. We use similar DCNN architectures on both datasets, which differ in the first
layer because of different input patch sizes. Figure 2 visualizes the architectures we used. We use
the Caffe [9] implementation of DCNN in our experiments.
5.3 Benchmark results
We show strict PCP results on the LSP dataset in Table 1, and on the FLIC dataset in Table 2. We
also show PDJ results on the FLIC dataset in Figure 3. As is shown, our method outperforms state
of the art methods by a significant margin on both datasets (see the captions for detailed analysis).
Figure 5 shows some estimation examples on the LSP and FLIC datasets.
6Method Torso Head U.arms L.arms U.legs L.legs Mean
Ours 92.7 87.8 69.2 55.4 82.9 77.0 75.0
Pishchulin et al. [16] 88.7 85.6 61.5 44.9 78.8 73.4 69.2
Ouyang et al. [14] 85.8 83.1 63.3 46.6 76.5 72.2 68.6
DeepPose* [23] - - 56 38 77 71 -
Pishchulin et al. [15] 87.5 78.1 54.2 33.9 75.7 68.0 62.9
Eichner&Ferrari [4] 86.2 80.1 56.5 37.4 74.3 69.3 64.3
Yang&Ramanan [26] 84.1 77.1 52.5 35.9 69.5 65.6 60.8
Table 1: Comparison of strict PCP results on the LSP dataset. Our method improves on all parts by a significant
margin, and outperforms the best previously published result [16] by 5.8% on average. Note that DeepPose uses
Person-Centric annotations and is trained with an extra 10,000 images.
Elbows Wrists
1 1
Percentage of Detected Joints (PDJ)
Percentage of Detected Joints (PDJ)
MODEC: 75.5% MODEC: 57.9%
0.9 DeepPose: 91.0% 0.9 DeepPose: 80.9%
0.8 Ours: 94.9% 0.8 Ours: 92.0%
0.7 0.7
0.6 0.6
0.5 0.5
Method U.arms L.arms Mean 0.4
0.3
0.4
0.3
Ours 97.0 86.8 91.9 0.2 0.2
0.1 0.1
0 0
MODEC[20] 84.4 52.1 68.3 0 0.05 0.1 0.15
Normalized Precision Threshold
0.2 0 0.05 0.1 0.15
Normalized Precision Threshold
0.2
Table 2: Comparison of strict PCP results on the Figure 3: Comparison of PDJ curves of elbows and
FLIC dataset. Our method significantly outperforms wrists on the FLIC dataset. The legend shows the
MODEC [20]. PDJ numbers at the threshold of 0.2.
5.4 Diagnostic Experiments
We perform diagnostic experiments to show the cross-dataset generalization ability of our model,
and better understand the influence of each term in our model.
Cross-dataset Generalization: We directly apply the trained model on the FLIC dataset to the
official test set of Buffy dataset [7] (i.e., no training on the Buffy dataset), which also contains
upper-body human poses. The Buffy test set includes a subset of people whose upper-body can be
detected. We get the newest detection windows from [5], and compare our results to previously
published work on this subset.
Most previous work was evaluated with the official evaluation toolkit of Buffy, which uses a less
strict PCP implementation1 . We refer to this version of PCP as Buffy PCP and report it along with the
strict PCP in Table 3. We also show the PDJ curves in Figure 4. As is shown by both criterions, our
method significantly outperforms the state of the arts, which shows the good generalization ability
of our method. Also note that both DeepPose [23] and our method are trained on the FLIC dataset.
Compared with Figure 3, the margin between our method and DeepPose significantly increases in
Figure 4, which implies that our model generalizes better to the Buffy dataset.
Method U.arms L.arms Mean
Ours* 96.8 89.0 92.9 Elbows Wrists
Ours* strict 94.5 84.1 89.3 1 1
Percentage of Detected Joints (PDJ)
Percentage of Detected Joints (PDJ)
Yang: 80.4% Yang: 57.4%
0.9 MODEC: 77.0% 0.9 MODEC: 58.8%
DeepPose*: 83.4% DeepPose*: 64.6%
0.8 0.8
Ours*: 93.2% Ours*: 89.4%
Yang[27] 97.8 68.6 83.2 0.7
0.6
0.7
0.6
Yang[27] strict 94.3 57.5 75.9 0.5
0.4
0.5
0.4
Sapp[21] 95.3 63.0 79.2 0.3 0.3
0.2 0.2
FLPM[11] 93.2 60.6 76.9 0.1 0.1
0 0
Eichner[5] 93.2 60.3 76.8 0 0.05 0.1 0.15
Normalized Precision Threshold
0.2 0 0.05 0.1 0.15
Normalized Precision Threshold
0.2
Table 3: Cross-dataset PCP results on Buffy test sub- Figure 4: Cross-dataset PDJ curves on Buffy test
set. The PCP numbers are Buffy PCP unless other- subset. The legend shows the PDJ numbers at the
wise stated. Note that our method is trained on the threshold of 0.2. Note that both our method and
FLIC dataset. DeepPose [23] are trained on the FLIC dataset.
1
A part is considered correctly localized if the average distance between its endpoints (joints) and ground-
truth is less than 50% of the length of the ground-truth annotated endpoints.
7Method Torso Head U.arms L.arms U.legs L.legs Mean
Unary-Only 56.3 66.4 28.9 15.5 50.8 45.9 40.5
No-IDPRs 87.4 74.8 60.7 43.0 73.2 65.1 64.6
Full Model 92.7 87.8 69.2 55.4 82.9 77.0 75.0
Table 4: Diagnostic term analysis strict PCP results on the LSP dataset. The unary term alone is still not
powerful enough to get good results, even though it’s trained by a DCNN classifier. No-IDPRs method, whose
pairwise terms are not dependent on the image (see Terms Analysis in Section 5.4), can get comparable perfor-
mance with the state-of-the-art, and adding IDPR terms significantly boost our final performance to 75.0%.
Terms Analysis: We design two experiments to better understand the influence of each term in
our model. In the first experiment, we use only the unary terms and thus all the parts are localized
independently. In the second experiment, we replace the IDPR terms with image independent priors
(i.e., in Equation 2, wij ϕ(tij |I(li ); θ) and wji ϕ(tji |I(lj ); θ) are replaced with scalar prior terms
t t
bijij and bjiji respectively), and retrain the weight parameters along with the new prior terms. In this
case, our pairwise relational terms do not depend on the image, but instead is a mixture of Gaussian
deformations with image independent biases. We refer to the first experiment as Unary-Only and the
second one as No-IDPRs, short for No IDPR terms. The experiments are done on the LSP dataset
using identical appearance terms for fair comparison. We show strict PCP results in Table 4. As is
shown, all terms in our model significantly improve the performance (see the caption for detail).
6 Conclusion
We have presented a graphical model for human pose which exploits the fact the local image mea-
surements can be used both to detect parts (or joints) and also to predict the spatial relationships
between them (Image Dependent Pairwise Relations). These spatial relationships are represented
by a mixture model over types of spatial relationships. We use DCNNs to learn conditional prob-
abilities for the presence of parts and their spatial relationships within image patches. Hence our
model combines the representational flexibility of graphical models with the efficiency and statisti-
cal power of DCNNs. Our method outperforms the state of the art methods on the LSP and FLIC
datasets and also performs very well on the Buffy dataset without any training.
Figure 5: Results on the LSP and FLIC datasets. We show the part localization results along with the graph
skeleton we used in the model. The last row shows some failure cases, which are typically due to large fore-
shortening, occlusions and distractions from clothing or overlapping people.
7 Acknowledgements
This research has been supported by grants ONR MURI N000014-10-1-0933, ONR N00014-12-1-
0883 and ARO 62250-CS. The GPUs used in this research were generously donated by the NVIDIA
Corporation.
8References
[1] X. Chen, R. Mottaghi, X. Liu, S. Fidler, R. Urtasun, and A. Yuille. Detect what you can: Detecting and
representing objects using holistic models and body parts. In Computer Vision and Pattern Recognition
(CVPR), 2014.
[2] N.-G. Cho, A. L. Yuille, and S.-W. Lee. Adaptive occlusion state estimation for human pose tracking
under self-occlusions. Pattern Recognition, 2013.
[3] N. Dalal and B. Triggs. Histograms of oriented gradients for human detection. In Computer Vision and
Pattern Recognition (CVPR), 2005.
[4] M. Eichner and V. Ferrari. Appearance sharing for collective human pose estimation. In Asian Conference
on Computer Vision (ACCV), 2012.
[5] M. Eichner, M. Marin-Jimenez, A. Zisserman, and V. Ferrari. 2d articulated human pose estimation and
retrieval in (almost) unconstrained still images. International Journal of Computer Vision (IJCV), 2012.
[6] P. F. Felzenszwalb and D. P. Huttenlocher. Pictorial structures for object recognition. International
Journal of Computer Vision (IJCV), 2005.
[7] V. Ferrari, M. Marin-Jimenez, and A. Zisserman. Progressive search space reduction for human pose
estimation. In Computer Vision and Pattern Recognition (CVPR), 2008.
[8] M. A. Fischler and R. A. Elschlager. The representation and matching of pictorial structures. IEEE
Transactions on Computers, 1973.
[9] Y. Jia. Caffe: An open source convolutional architecture for fast feature embedding. http://caffe.
berkeleyvision.org/, 2013.
[10] S. Johnson and M. Everingham. Clustered pose and nonlinear appearance models for human pose esti-
mation. In British Machine Vision Conference (BMVC), 2010.
[11] L. Karlinsky and S. Ullman. Using linking features in learning non-parametric part models. In European
Conference on Computer Vision (ECCV), 2012.
[12] A. Krizhevsky, I. Sutskever, and G. E. Hinton. Imagenet classification with deep convolutional neural
networks. In Neural Information Processing Systems (NIPS), 2012.
[13] J. Lafferty, A. McCallum, and F. C. Pereira. Conditional random fields: Probabilistic models for segment-
ing and labeling sequence data. In International Conference on Machine Learning (ICML), 2001.
[14] W. Ouyang, X. Chu, and X. Wang. Multi-source deep learning for human pose estimation. In Computer
Vision and Pattern Recognition (CVPR), 2014.
[15] L. Pishchulin, M. Andriluka, P. Gehler, and B. Schiele. Poselet conditioned pictorial structures. In
Computer Vision and Pattern Recognition (CVPR), 2013.
[16] L. Pishchulin, M. Andriluka, P. Gehler, and B. Schiele. Strong appearance and expressive spatial models
for human pose estimation. In International Conference on Computer Vision (ICCV), 2013.
[17] D. Ramanan. Learning to parse images of articulated bodies. In Neural Information Processing Systems
(NIPS), 2006.
[18] C. Rother, V. Kolmogorov, and A. Blake. Grabcut: Interactive foreground extraction using iterated graph
cuts. In ACM Transactions on Graphics (TOG), 2004.
[19] B. Sapp, C. Jordan, and B. Taskar. Adaptive pose priors for pictorial structures. In Computer Vision and
Pattern Recognition (CVPR), 2010.
[20] B. Sapp and B. Taskar. Modec: Multimodal decomposable models for human pose estimation. In Com-
puter Vision and Pattern Recognition (CVPR), 2013.
[21] B. Sapp, A. Toshev, and B. Taskar. Cascaded models for articulated pose estimation. In European
Conference on Computer Vision (ECCV), 2010.
[22] P. Sermanet, D. Eigen, X. Zhang, M. Mathieu, R. Fergus, and Y. LeCun. Overfeat: Integrated recogni-
tion, localization and detection using convolutional networks. In International Conference on Learning
Representations (ICLR), 2014.
[23] A. Toshev and C. Szegedy. Deeppose: Human pose estimation via deep neural networks. In Computer
Vision and Pattern Recognition (CVPR), 2014.
[24] I. Tsochantaridis, T. Hofmann, T. Joachims, and Y. Altun. Support vector machine learning for interde-
pendent and structured output spaces. In International Conference on Machine Learning (ICML), 2004.
[25] C. Wang, Y. Wang, and A. L. Yuille. An approach to pose-based action recognition. In Computer Vision
and Pattern Recognition (CVPR), 2013.
[26] Y. Yang and D. Ramanan. Articulated pose estimation with flexible mixtures-of-parts. In Computer Vision
and Pattern Recognition (CVPR), 2011.
[27] Y. Yang and D. Ramanan. Articulated human detection with flexible mixtures of parts. IEEE Transactions
on Pattern Analysis and Machine Intelligence (TPAMI), 2013.
9You can also read