Contribution of the Leech River Valley - Devil's Mountain Fault System to Seismic Hazard in Victoria, B.C - Devil's Mountain Fault ...
←
→
Page content transcription
If your browser does not render page correctly, please read the page content below
Contribution of the Leech River Valley - Devil's Mountain Fault System to Seismic Hazard
                                     in Victoria, B.C.

                           Stephen Halchuk1, Trevor Allen2, John Adams1, Tuna Onur3,4
            1
             Seismologist, Canadian Hazards Information Service, Natural Resources Canada – Ottawa, ON, Canada.
       2
           Seismologist, Positioning and Community Safety Division, Geoscience Australia – Canberra, ACT, Australia.
                                3
                                  Principal, Onur Seemann Consulting, Inc. – Victoria, BC, Canada.
              4
                Adjunct Professor, Department of Civil Engineering, University of Victoria – Victoria, BC, Canada.

ABSTRACT
The Devil’s Mountain fault is included in the 2014 USGS hazard model for Washington State as an active fault. Recent
neotectonic investigations have suggested that a west-northwestwards extension of the fault (the Leech River Valley Fault) has
onshore evidence pointing to recurrent Holocene offsets. Accordingly, a logic tree model for the Leech River Valley Fault –
Devil’s Mountain Fault system (LRVF-DMF) incorporating various fault lengths, slip rates of 0.25 mm/yr with upper and lower
alternatives of 0.15 and 0.35 mm/yr, and interactions between the faults was developed and added to Canada’s 6 th Generation
seismic hazard model. The LRVF was given a 50% chance of being active. Although the slip rate is low for an active tectonic
region, the fault system passes through greater Victoria, British Columbia, and contributes to the overall seismic hazard for
southernmost Vancouver Island. We calculate the hazard in greater Victoria with and without the LRVF-DMF in order to
estimate its effect. The hazard in downtown Victoria is already high (coming mainly from inslab sources at short periods and
the Cascadia subduction zone at long periods) and decreases slowly in a north-easterly direction. The hazard increment due to
the LRVF-DMF is quite small, even very close to the fault, and its contribution to the hazard decreases away from the fault so
that in Sidney, B.C., at ~25 km distance it is insignificant. The importance of the fault system would have been very different
in a lower hazard region, or if the slip rate on the LRVF-DMF had been considerably higher.
Keywords: seismic hazard, faults, Victoria, British Columbia

INTRODUCTION
The United States Geological Survey (USGS) hazard model has included active faults in the Puget lowlands of Washington
State since 1996 [1] with the inclusion of the Devil’s Mountain fault (DMF), that passes through the eastern Strait of Juan de
Fuca, used in the 2002 edition [2]. These faults are characterized by surface offsets that occurred during large earthquakes in
the period since deglaciation (~12 ka), and from these offsets slip rates and other parameters can be derived to allow their
inclusion as fault sources. Canada’s 5th Generation model did not explicitly include the U.S. fault sources, being content to
implicitly include their shaking contribution via areal seismic source zone enveloping the Puget Sound region (PGT) [3]. Given
that those fault sources were mostly distant from Canada, this was deemed sufficient for the calculation of hazard in Canadian
territory.
The 5th Generation seismic hazard model for Canada was finalised (calculations completed) by late 2013 for inclusion in the
2015 National Building Code of Canada (NBCC2015). Since this time, two studies have identified potentially active crustal
fault zones in the southern Vancouver Island region, near the British Columbia provincial capital of Victoria. Barrie and Greene
[4, 5] analyse recently acquired marine geophysical and sediment core data that reveals Holocene faulting in the Devil’s
Mountain Fault zone in the northern Strait of Juan de Fuca. The fault zone is interpreted to extend east-to-west from Washington
State in the United States [6] to just southeast of Victoria. It is interpreted as having transpressional motion with left-lateral
motions in the vicinity of Whidbey Island in Washington State [6], and transpressional motion with right-lateral oblique slip in
the vicinity of Victoria [4]. An initial submarine survey further to the west off the Victoria waterfront revealed no definitive
evidence of faulting in the Holocene section [5], although the authors favour extending the DMF through this region.
There is also some evidence that may suggest there is tectonically-driven Holocene faulting in the Leech River valley [7, 8], a
steep-sided valley west of Victoria that is centred on the surface expression of the Eocene terrane bounding Leech River fault,
which is a low-angle thrust. Morell et al. [7] investigated a 200-m lineament above the valley floor on the south side of the
valley and identify vertical movements which they propose are evidence of three surface-rupturing earthquakes in the last ~9
ka, suggesting that the valley has hosted large MW 6.0+ earthquakes in the Holocene. Trench logs across a section of the fault
scarp show dip-slip motion on vertical or south-dipping high-angle faults, ambiguously representing normal or reverse faulting,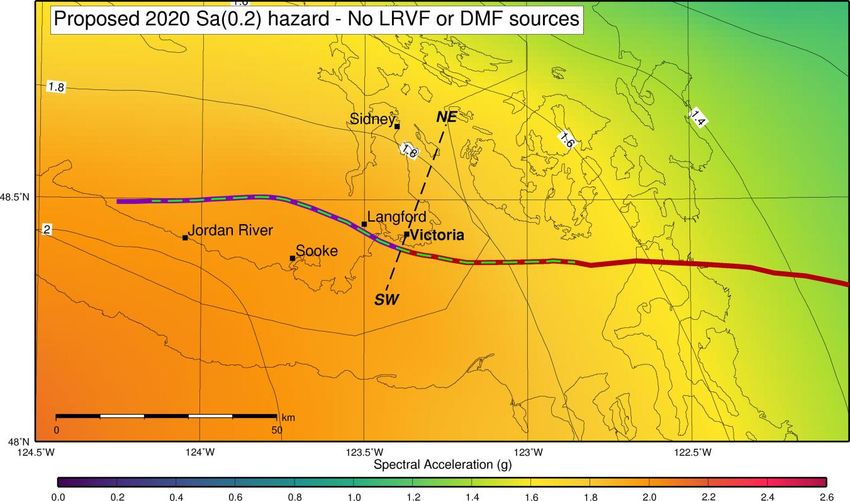
12th Canadian Conference on Earthquake Engineering, Quebec City, June 17-20, 2019
without definitive lateral offsets [7], in contrast to the observations by Barrie and Greene [5] for the DMF. Both Morell et al.
[7] and Li et al. [9] emphasize that they are not proposing Holocene activity on the low-angle terrane boundary Leach River
fault, but on a high-angle fault zone centred in the Leech River valley that would be reacting to the northwest-southeast
horizontal compressive stress [10] in the southern Vancouver Island region. To distinguish the proposed fault from the Eocene
Leach River Fault, we refer to it as the “Leech River Valley Fault” (LRVF). We recognize that both the DMF and LRVF may
be fault zones (perhaps up to 10 km wide), but we refer to them as “faults” as a convenient shorthand, and we model them as
single-strand faults to reduce model complexity.
Given the proximity of both of these structures to the largest population centre on Vancouver Island and the possible Holocene
activity, their inclusion as independent fault sources into seismic hazard models and their impact on seismic hazard estimates
need to be explored. Herein, we investigate the parameterization of the LRVF and DMF for use in the 6th Generation seismic
hazard model of Canada being proposed for NBCC2020. As in the 5th Generation model, the hazard contributions of the other,
more distant, active faults in Washington State are captured via the areal source PGT.
FAULT-MODEL PARAMETERISATION
In order to integrate the potential southwestern British Columbia fault sources into the source-model logic tree, some pragmatic
decisions were required to parameterize the fault-source model. Firstly, the geometry of the fault sources needed to be defined.
Given the possible “fault zone” nature of the LRVF-DMF the particular position assigned to the faults in the model should not
be taken as definitive. At the time these geometries were conceived, there was no definitive evidence that the LRVF was active
through to the western coast of Vancouver Island. Consequently, seven rupture scenarios were developed (Figure 1). For each
of the LRVF and DMF, three rupture scenarios were assigned assuming single-segment ruptures. For each of the three
scenarios, a combined weight of 0.9 was assigned for the LRVF and DMF, respectively (Table 1).
Figure 1. Leech River Valley – Devil’s Mountain fault system as modelled for the proposed 2020 NBCC. Fault codes as in
Table 1. The red star on the inset map shows the location of the study area along the westernmost Canada-U.S.A. border
while the white star on the main map shows the location of the evidence collected for the Morell et al. [7,8] detailed study.
Table 1: Fault parameterization for LRVF and DMF.
INTER- INTRA-
LENGTH CHARACTERISTIC
FAULT_NAME CODE FAULT FAULT
(km) MAGNITUDE
WEIGHT WEIGHT
Leech River Valley Fault Full LRVFF 65 6.9 0.3
Leech River Valley Fault Mid LRVFM 40 6.6 0. 5 0.9* 0.4
Leech River Valley Fault Short LRVFS 30 6.5 0.3
Devils Mountain Fault Full DMFF 133 7.2 0.3
Devils Mountain Fault Mid DMFM 77 6.9 0.9 0.4
Devils Mountain Fault Short DMFS 40 6.6 0.3
Leech River Valley and Devils
LDFC 99 7.1 0.2 1.0
Mountain faults Combined
* The LRVF was given a 50% chance of being active.
12th Canadian Conference on Earthquake Engineering, Quebec City, June 17-20, 2019

Barrie and Greene [5] and Morell et al. [8] both suggest that the LRVF and the DMF are likely part of a network of Holocene-
active faults in the Pacific Northwest region that accommodate plate boundary strain. Furthermore, current mapping of the two
faults indicates that they are well-aligned relative to each other and possibly merge near Victoria. Consequently, a multi-
segment model that allows for both fault systems to rupture in a single earthquake was considered. For each of the fault sources,
this scenario was given a weight of 0.1 (summing to 0.2 when both faults are considered). The scenarios deliberately focus on
the Victoria region because it is in this region where evidence for the activity on the faults is postulated. All scenarios assume
steeply north-dipping faults of 70°, a seismogenic thickness of 15 km, and thus a down-dip rupture width of approximately 16
km, which are similar to the parameters used by the USGS in their 2008 National Seismic Hazard Maps. Both parameters are
poorly constrained, and as nearby earthquakes occur down to about 30 km (Garry Rogers, pers. comm. 2019), the seismogenic
thickness may be under-estimated. A potentially wider rupture surface (and thus larger area) may allow for larger-magnitude
earthquakes to occur. However, the total strain would then be accommodated across this larger area and would lead to a
reduction in the rates of moderately-large (MW ~ 6.0-6.5) earthquakes that could occur at time-scales relevant to our PSHAs.
Characteristic magnitudes were calculated for each of the seven rupture scenarios using the modelled rupture length areas in
concert with an average magnitude derived from several magnitude-area scaling relationships [11-14]. The rupture length and
characteristic magnitudes [15] for each of the scenarios are provided in Table 1. The characteristic magnitude is assumed to be
0.25 magnitude units lower than the maximum magnitude [15], Mmax. An uncertainty of ± 0.15 magnitude units was assigned
on the characteristic magnitude and this was implemented using a three-branch logic tree to capture the epistemic uncertainty
associated with this parameter. The weights for the upper, preferred and lower magnitude branches are assigned as 0.3, 0.6 and
0.1, respectively.
The slip rates are assumed to be constant for all rupture scenarios. The slip rate is determined based on the vertical slip rate of
0.18 mm/yr provided by Johnson et al. [6] for a segment of the Devil’s Mountain fault where it transects Whidby Island. The
2008 USGS seismic hazard model implemented the Devil’s Mountain fault in the U.S. national hazard maps with a vertical
slip rate of 0.15 mm/yr [16]. In the development of the NBCC 2020 fault-source model, we assume oblique ruptures with equal
horizontal and vertical slip for both fault zones. This is conservative with respect to the vertical-only LRVF Holocene
displacements, but reflects the oblique nature of the DMF (e.g. [5]). The preferred annual slip rate for both faults is taken to
be 0.25 mm/yr. Given the uncertainty on the slip rate of the two fault zones, we model epistemic uncertainty on the slip
assuming an upper and lower bound of ± 0.1 mm/yr. The weights for the upper, preferred and lower branches of the fault slip
rate are assigned as 0.16, 0.68 and 0.16, respectively. Subsequent data published by Morell et al. [8] estimates a long-term slip
rate of 0.2-0.3 mm/year for the LRVF, corroborating the original choice of the preferred slip rate.
All magnitude-frequency distribution (MFD) branches assume Youngs and Coppersmith [15] characteristic magnitude
recurrence (Figure 2) with a constant Gutenberg-Richter [17] b-value of 0.8 and a minimum magnitude Mmin of 6.3. The seismic
moment contributed by these fault-source models are assumed to be additive to the earthquake occurrence rates from the
shallow-crustal area source for the Puget Sound region, PGT.

    Figure 2: Plots showing (left) the characteristic magnitude MFDs for the seven alternative rupture scenarios listed in
  Table 1 assuming Mmin of 6.3, a b-value of 0.8, together with the preferred slip rate and Mmax. Read LRF* as LRVF*. The
    right-hand plot shows the same MFDs with their weighted (Table 1) occurrence rates together with the summed rate.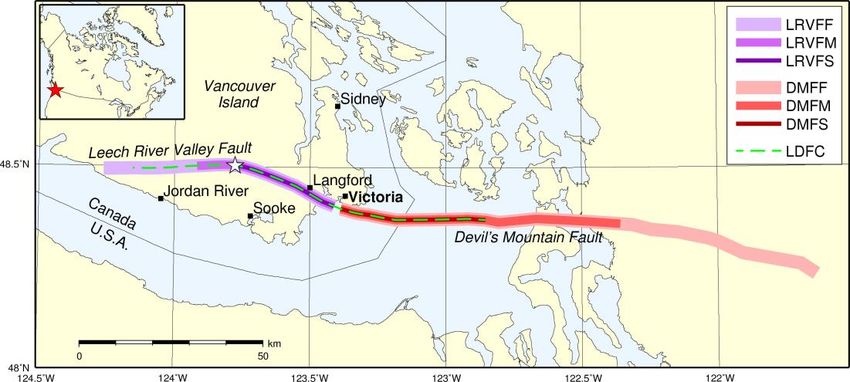
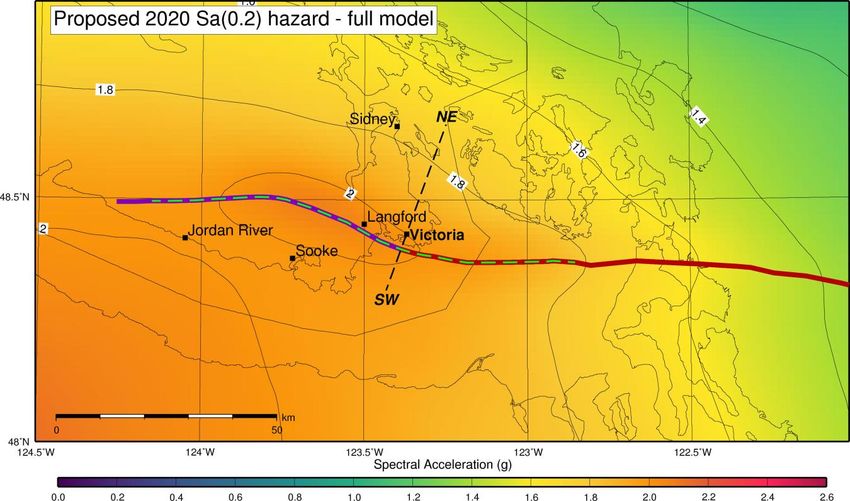
12th Canadian Conference on Earthquake Engineering, Quebec City, June 17-20, 2019

OpenQuake-engine [18] input source files were generated assuming the fault-model parameterization above. Earthquake
occurrence rates from multiple MFDs (three Mmax branches and three slip-rate branches) were collapsed onto a single occurrence
rate curve per source. While preserving mean seismic hazard and significantly improving computational efficiency, this
approach does not allow for the calculation of the full suite of hazard fractiles associated with the fault-source model. All other
elements of the model are those of the 6th Generation model proposed for the NBCC2020 design values [19].
At the time the model was developed for the proposed NBCC2020 design values, evidence was unclear as to whether the full
mapped fault-length had been active in the neotectonic era. Consequently, LRVF was given a 50% chance of being active
because at the time of the model development, the Standing Committee on Earthquake Design (SCED)’s seismicity task group
members were not convinced that there was enough evidence for the fault to be fully weighted in the source model logic tree.
Consequently, the incremental earthquake occurrence rates calculated using the procedure above were multiplied by a factor
of 0.5. Although we have not performed the calculation, our expectation is that if the LRVF were given a 100% chance of
being active (for some future version of NBCC), the hazard contours west of Victoria on Figure 5 would be increased by 40%
(that is the 4% contour would become the 6% contour).

HAZARD RESULTS AND DISCUSSION
The Victoria site for which the hazard is calculated is at the NBCC co-ordinates of 48.430°N 123.370°W (the intersection of
Herald and Store streets in Victoria). This places it about 4 km from the closest part of the modelled LRVF rupture plane (Rrup)
and 3.5 km from the DMF, with some uncertainty arising from the exact position of the faults. Some southern parts of greater
Victoria will lie closer to one or the other fault, and the hazard increases would be larger for these sites. However, for sites 25
km from the faults (e.g. Sidney) the contribution of the LRVF-DMF to the total hazard is very small.
We choose to discuss the contribution of the LRVF-DMF to the hazard in greater Victoria chiefly in terms of the short-period
hazard, spectral acceleration at a period of 0.2 s (Sa(0.2)), though the effects at longer periods are given in Table 2 and discussed
later. Figure 3 indicates the high level of regional hazard in southern Vancouver Island calculated from the 6 th Generation
model. Most of the Sa(0.2) hazard arises from inslab earthquakes about 50 km below greater Victoria and from great
earthquakes on the Cascadia subduction interface [3, 18]. Figure 4 indicates the hazard calculated without the LRVF-DMF
sources. By inspection of the two figures it can be seen that the contribution of the LRVF-DMF increases the hazard near the
fault slightly, though it is enough to increase the Sa(0.2) hazard in greater Victoria just above the 2 g level. Figure 5 displays
the difference between Figures 3 and 4, as a percentage of the local hazard relative to Figure 4. As the gradient of hazard down
to the northeast is relatively small, this is also close to representing the pattern of a difference map. Figure 5 shows that the
consequence of the north-dip of the faults is increased hazard to the north of the fault (part of this is proximity, and so a smaller
Rrup). Note that much of greater Victoria sits on the hanging wall of the modelled fault, where ground motions are expected to
be larger than for the footwall; these effects are included in the OpenQuake implementation of the NGA-West2 ground-motion
models.
The largest contributions from the LRVF and DMF occur immediately to the north of the fault, and thence decay rapidly away
from the fault to the north and south (Figures 5 and 6). The increase in shaking hazard from being right on top of the fault is
relatively small, though there may be other shaking considerations at such close fault distances that are poorly captured in the
OQ implementation of NGA-West2. At 10-12 km from the fault the contribution is less than 3% of the total hazard, and is
essentially negligible (given the uncertainty in mean estimates of seismic hazard). The small contribution of LRVF-DMF is
also illustrated in Figure 7, where it can be seen that the other sources contribute nearly all the hazard over all probabilities.
Table 2 illustrates the percentage increase in hazard at Victoria due to Leech River Valley and Devil’s Mountain fault sources
as a function of period and NBCC Site Class. It should be stressed that the faults’ relative importance is a function of the level
of seismic hazard from other sources. On Site Classes B and C the relative contribution at longer periods is less than at short
periods due to the very large long-period contributions from great earthquakes on the Cascadia subduction interface. On Site
Classes D and E, however, that relationship is reversed, and being close to the faults gives a larger increase at the longer periods,
due to the smaller amount of non-linearity in the NGA-West2 ground-motion models (see e.g. right panel of Fig. 6 in [20]).
We note that the additional hazard to buildings and infrastructure from onshore surface rupture of LRVF (e.g. near Langford),
any tsunami effects from offshore rupture of the LRVF and DMF (immediately south of Victoria), and sea level drop in Victoria
harbor due to reverse fault slip offshore of Victoria are not addressed in these shaking calculations for NBCC2020. Such risk
aspects have been investigated by others [21, 22].

12th Canadian Conference on Earthquake Engineering, Quebec City, June 17-20, 2019

Figure 3. Proposed NBCC 2020 Sa(0.2) hazard including the Leech River Valley and Devil’s Mountain fault sources. A
        southwest (SW) to northeast (NE) profile through Victoria is indicated by the dashed line, see Figure 6.

  Figure 4. Proposed NBCC 2020 Sa(0.2) hazard without the Leech River Valley and Devil’s Mountain fault sources.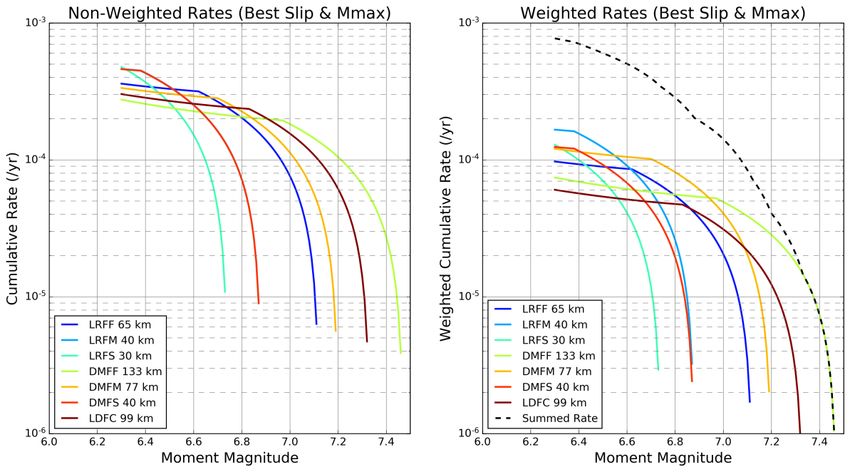
12th Canadian Conference on Earthquake Engineering, Quebec City, June 17-20, 2019

Figure 5.Percentage increase in Sa(0.2) hazard resulting from the inclusion of the Leech River Valley and Devil’s Mountain
                                                       fault sources.

Figure 6. Southwest (SW) to northeast (NE) profile (Figures 3-5) through Victoria (location at 4 km indicated by filled circle)
 showing the difference in hazard resulting from the full model (solid lines) and the model without LRVF and DMF sources
                                           (dashed lines) for Sa(0.2) and Sa(2.0).
12th Canadian Conference on Earthquake Engineering, Quebec City, June 17-20, 2019
1.00000
full model
model without faults
0.10000
faults only
Probability (per annum)
0.01000
0.00100
0.00010
0.00001
0 1 2 3 4 5 6
Spectral Acceleration (g)
Figure 7. Sa(0.2) hazard curves for Victoria showing relative contributions from the Leech River Valley Fault and Devil’s
Mountain Fault sources on Class C.
Table 2. Percentage increase in hazard at Victoria due to Leech River Valley and Devil’s Mountain fault sources.
Site Class PGA Sa(0.1) Sa(0.2) Sa(0.5) Sa(1.0) Sa(2.0) Sa(5.0) Sa(10.0)
B 3.1 4.4 2.8 1.3 1.4 0.7 1.6 1.1
C 5.1 4.1 5.5 7.0 6.8 3.8 4.7 2.6
D 3.6 1.5 2.4 7.5 11.2 8.5 10.1 5.4
E 1.5 0.6 0.7 4.8 11.7 15.2 15.9 8.3
CONCLUSIONS
Inclusion of the LRVF and DMF in the 6th Generation model recognizes that the 5th Generation model’s use of areal source
zone PGT to include these and other active faults in the Puget Lowlands - Straits of Georgia region was insufficient to model
their local hazard contributions. The 6th Generation model’s results are recommended for adoption into NBCC2020. The
inclusion adds conservatism to the design values in Victoria, and thus additional seismic protection, against potential ruptures
along these two fault sources. In addition, explicit identification of these potentially active faults will allow for a better informed
near-fault ground motion record selection for time-history analyses as part of major infrastructure projects in this urban area.
Because of the possible “fault zone” nature of the LRVF-DMF the particular position assigned to the faults in the model should
be taken as indicative, not definitive. Thus distances to the closest active strand may be less than indicated. Because of
Victoria’s already high seismic hazard environment, the inclusion of these newly-proposed crustal faults produces relatively
modest – and mostly local – increases in seismic hazard. The importance of these faults would have been very different if the
slip rate on the LRVF-DMF had been considerably higher, or if the faults were in a lower hazard region.
ACKNOWLEDGMENTS
We thank Kristen Morell for discussions on her paleoseismic analysis of the LRVF and well as her participation in several
Seismicity Task Group conference calls. We appreciate a thorough review from Garry Rogers and have used his comments
and terminology to improve the paper. Trevor Allen publishes with the permission of the CEO of Geoscience Australia.
REFERENCES
[1] Frankel, A, Mueller, C, Barnhard, T, Perkins, D, Leyendecker, EV, Dickman, N, Hanson, S, Hopper, M (1996): National
Seismic-Hazard Maps: Documentation June 1996, in, U.S. Geological Survey Open-File Report 96-532, Denver, CO, pp. 69.12th Canadian Conference on Earthquake Engineering, Quebec City, June 17-20, 2019 [2] Frankel, AD, Petersen, MD, Mueller, CS, Haller, KM, Wheeler, RL, Leyendecker, EV, Wesson, RL, Harmsen, SC, Cramer, CH, Perkins, DM, Rukstales, KS (2002): Documentation for the 2002 update of the National Seismic Hazard Maps, in, U.S. Geological Survey Open File Report 02-420, Denver, CO, pp. 33. [3] Rogers, G, Halchuk, S, Adams, J, Allen, T (2015): 5th Generation (2015) seismic hazard model for southwest British Columbia, 11th Canadian Conference on Earthquake Engineering, Victoria, Canada, Paper 94198. [4] Barrie, JV, Greene, HG (2015): Active faulting in the northern Strait of Juan de Fuca: Implications for Victoria, British Columbia, Current Res. [5] Barrie, JV, Greene, HG (2018): The Devils Mountain Fault zone: An active Cascadia upper plate zone of deformation, Pacific Northwest of North America, Sediment. Geol., 364, 228-241, doi: 10.1016/j.sedgeo.2017.12.018. [6] Johnson, SY, Dadisman, SV, Mosher, DC, Blakely, RJ, Childs, JR (2001): Active tectonics of the Devils Mountain fault and related structures, northern Puget Lowland and eastern Strait of Juan de Fuca region, Pacific Northwest, in, U.S. Geological Survey, Professional Paper 1643, pp. 45. [7] Morell, KD, Regalla, C, Amos, C, Bennett, S, Leonard, L, Graham, A, Reedy, T, Levson, V, Telka, A (2018): Holocene surface rupture history of an active forearc fault redefines seismic hazard in southwestern British Columbia, Canada, Geophys. Res. Lett., 45 (21), 11,605-611,611, doi: 10.1029/2018GL078711. [8] Morell, KD, Regalla, C, Leonard, LJ, Amos, C, Levson, V (2017): Quaternary rupture of a crustal fault beneath Victoria, British Columbia, Canada, GSA Today, 27 (3), 4–10, doi: 10.1130/GSATG291A.1. [9] Li, G, Liu, Y, Regalla, C and Morell, KD (2018) Seismicity relocation and fault structure near the Leech River fault Zone, southern Vancouver Island, J. Geophys. Res., 123, 2841-2855, https://doi.org/ 10.1002//2017JB015021. [10] Balfour, NJ, Cassidy, JF, Dosso, SE, Mazzotti, S (2011): Mapping crustal stress and strain in southwest British Columbia, J. Geophys. Res., 116, B03314, doi: 10.1029/2010JB008003. [11] Wells, DL, Coppersmith, KJ (1994): New empirical relationships among magnitude, rupture length, rupture width, rupture area, and surface displacement, Bull. Seism. Soc. Am., 84 (4), 974-1002. [12] Shaw, BE (2013): Earthquake surface slip-length data is fit by constant stress drop and is useful for seismic hazard analysis, Bull. Seism. Soc. Am., 103 (2A), 876–893, doi: 10.1785/0120110258. [13] Hanks, TC, Bakun, WH (2002): A bilinear source-scaling model for M-log A observations of continental earthquakes, Bull. Seism. Soc. Am., 92 (5), 1841-1846, doi: 10.1785/0120010148 [14] Leonard, M (2010): Earthquake fault scaling: self-consistent relating of rupture length, width, average displacement, and moment release, Bull. Seism. Soc. Am., 100 (5A), 1971–1988, doi: 10.1785/0120090189. [15] Youngs, RR, Coppersmith, KJ (1985): Implications of fault slip rates and earthquake recurrence models to probabilistic seismic hazard estimates, Bull. Seism. Soc. Am., 75 (4), 939-964. [16] Petersen, MD, Frankel, AD, Harmsen, SC, Mueller, CS, Haller, KM, Wheeler, RL, Wesson, RL, Zeng, Y, Boyd, OS, Perkins, DM, Luco, N, Field, EH, Wills, CJ, Rukstales, KS (2008): Documentation for the 2008 update of the United States National Seismic Hazard Maps, in, U.S. Geological Survey Open-File Report 2008–1128, pp. 128. [17] Gutenberg, B, Richter, CF (1944): Frequency of earthquakes in California, Bull. Seism. Soc. Am., 34 (4), 185-188. [18] Pagani, M, Monelli, D, Weatherill, G, Danciu, L, Crowley, H, Silva, V, Henshaw, P, Butler, R, Nastasi, M, Panzeri, L, Simionato, M, Vigano, D (2014): OpenQuake Engine: An open hazard (and risk) software for the Global Earthquake Model, Seism. Res. Lett., 85 (3), 692–702, doi: 10.1785/0220130087. [19] Adams, J, Allen, T, Halchuk, S, Kolaj, M (2019): Canada's 6th Generation Seismic Hazard Model, as prepared for the 2020 National Building Code of Canada, 12th Canadian Conference on Earthquake Engineering, Quebec City, paper 192- WGm8-169, 8 pp. [20] Kolaj, M, Allen, T, Mayfield, R, Adams, J, Halchuk, S (2019): Ground-motion models for the 6th Generation Seismic Hazard Model of Canada, 12th Canadian Conference on Earthquake Engineering, Quebec City, paper 192-hHtH-159, 9pp. [21] VC Structural Dynamics Ltd. (2016): Executive Summary, Citywide Seismic Vulnerability Assessment of the city of Victoria, in, pp. 43. [22] Zaleski, MP (2014): Earthquake loss estimates greater Victoria, British Columbia. Master of Science Thesis, Simon Fraser University. 343 pp. http://summit.sfu.ca/item/14791
You can also read