Measurement-Based Evaluation Of Google/Apple Exposure Notification API For Proximity Detection In A Light-Rail Tram

Page created by Sarah Beck
 
CONTINUE READING
Measurement-Based Evaluation Of Google/Apple Exposure Notification API For Proximity Detection In A Light-Rail Tram
1

  Measurement-Based Evaluation Of Google/Apple
 Exposure Notification API For Proximity Detection
               In A Light-Rail Tram
                                               Douglas J. Leith, Stephen Farrell
                                           School of Computer Science & Statistics,
                                                Trinity College Dublin, Ireland
                                                        26th June 2020

Abstract—We report on the results of a Covid-19 contact tracing       reflections from the metal walls, floor and ceiling within the
measurement study carried out on a commuter tram in Dublin,           tram, metal being known to be a strong reflector of radio
Ireland. Our measurements indicate that in the tram there is          signals [4], [5], and is coherent with the behaviour observed
little correlation between received signal strength and distance
between handsets. We applied the detection rules used by the          on a commuter bus [2].
Italian, Swiss and German apps to our measurement data and            We applied the detection rules used by the Italian, Swiss and
also characterised the impact on performance of changes in the
parameters used in these detection rules. We find that the Swiss      German apps to our measurement data and also characterised
and German detection rules trigger no exposure notifications          the impact on performance of changes in the parameters used
on our data, while the Italian detection rule generates a true        in these detection rules. We find that the Swiss and German de-
positive rate of 50% and a false positive rate of 50%. Our analysis   tection rules trigger no exposure notifications, despite around
indicates that the performance of such detection rules is similar     half of the pairs of handsets in our data being less than 2m
to that of triggering notifications by randomly selecting from the
participants in our experiments, regardless of proximity              apart. The Italian detection rule has a true positive rate (i.e.
                                                                      correct detections of handsets less than 2m apart) of around
                                                                      50%. However, it also has a false positive rate of around 50%
                       I. I NTRODUCTION                               i.e. it incorrectly triggers exposure notifications for around
                                                                      50% of the handsets which are greater than 2m apart. This
We report on the results of a Covid-19 contact tracing measure-
                                                                      performance is similar to that of triggering notifications by
ment study carried out on a commuter tram in Dublin, Ireland.
                                                                      randomly selecting from the participants in our experiments,
The tram is of a standard French design widely used in Europe.
                                                                      regardless of proximity.
Measurements were collected between 108 pairs of handset
locations and we have made those publicly available [1]. This         We observe that changing the people holding a pair of hand-
adds to the body of data on contact tracing app performance           sets, with the location of the handsets otherwise remaining
on public transport initiated in [2].                                 unchanged, can cause variations of ±10dB in the attenuation
                                                                      level reported by the GAEN API. This is pertinent because this
Contact tracing apps based on the Google/Apple Exposure No-
                                                                      level of “noise” is large enough to have a substantial impact
tification (GAEN) API [3] are currently being rolled out across
                                                                      on proximity detection.
Europe, with apps already deployed in Italy, Switzerland and
Germany. These apps use Bluetooth received signal strength
                                                                                           II. M ETHODOLOGY
to estimate proximity and will likely be used as an adjunct
to existing manual contact tracing and test systems. Existing         A. Experimental Protocol
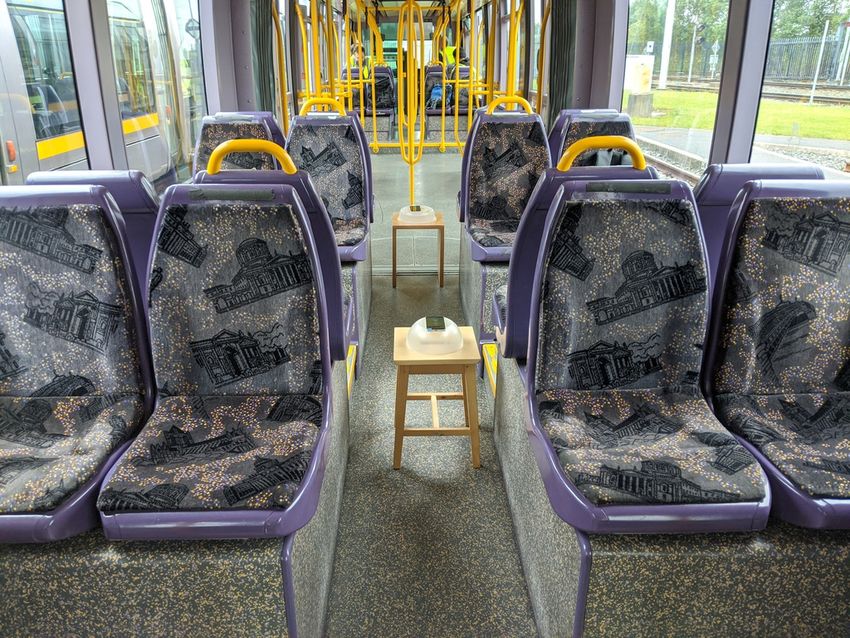
manual systems can usually readily identify the people with           Our experimental measurements were collected on a standard
whom an infected person share accommodation and with                  light-rail tram carriage used to carry commuters in Dublin,
work colleagues with whom the infected person is in regular           Ireland, see Figure 1(a). We recruited seven participants and
contact. More difficult is to identify people travelling on public    gave each of them Google Pixel 2 handsets. We asked them
transport with whom an infected person has been in contact,           to sit in the relative positions shown in Figure 1(b). This
since the identities of these people are usually not known to         positioning aims to mimic passengers respecting the relaxed
the infected person and are generally not otherwise recorded.         social distancing rules likely during easing of lockdown and
Public transport is therefore potentially an important use case       with the distances between participants including a range of
where effective contact tracing apps may be of significant            values < 2m and a range of values > 2m, see Figure 2. Each
assistance in infection control.                                      experiment is 15 minutes duration giving around 3 scans by the
                                                                      GAEN API when scans are made every 4 mins. A Wifi hotspot
In summary, our measurements indicate that in the tram
                                                                      was set up on the tram and the participants were asked to
there is little correlation between received signal strength and
                                                                      hold the handset in their hand and use it for normal commuter
distance between handsets. Similar ranges of signal strength
                                                                      activities such as browsing the internet.
are observed both between handsets which are less than 2m
apart and handsets which are greater than 2m apart (including         After the first experiment was carried out participants were
when handsets are up to 5m apart). This is likely due to              then asked to switch seats (they chose seats themselves) and a
Measurement-Based Evaluation Of Google/Apple Exposure Notification API For Proximity Detection In A Light-Rail Tram
2

                                                                      of approximately 0.5m (about the same height as the tram
                                                                      seating) in the centre aisle of the tram carriage.

                                                                      B. Ethical Approval
                                                                      The experimental protocol was reviewed and approved by
                                                                      the Ethics Committee of the School of Computer Science
             (a)                                                (b)
                                                                      and Statistics, Trinity College Dublin. The ethics application
Fig. 1: (a) Tram on which measurements were collected. (b)            reference number is 20200503.
Relative positions of participants during tests.
                                                                      C. Hardware & Software Used
                               0.2
                                                                      We used Google Pixel 2 handsets running GAEN API version
                              0.15
                                                                      2025120011 , which includes a major update by Google issued
                   Fraction

                               0.1                                    on 13th June 2020.
                              0.05                                    We used a version of the Google exemplar Exposure Notifi-
                                                                      cation app modified to allow us to query the GAEN API over
                                0
                                     1   2     3        4   5         USB using a python script (the source code for the modified
                                         Distance (m)
                                                                      app is available on github [6]).
Fig. 2: Distribution of distances between participants in ex-
                                                                      In addition we also wrote our own GAENAdvertiser app that
periments.
                                                                      implements the Bluetooth LE transmitter side of the GAEN
                                                                      API [3]. GAENAdvertiser allows us to control the TEK, and in
second 15 minute experiment run. After the second experiment          particular reset it to a new value at the start of each experiment.
participants were again asked to change seats for the third           In effect, resetting the TEK makes the handset appear as a
15 minute experiment and, in addition, two participants were          new device from the point of view of the GAEN API, and
asked to place their handsets in their left trouser pocket (in an     so this allows us to easily collect clean data (the GAEN API
orientation of their choice).                                         otherwise only resets the TEK on a handset once per day).
                                                                      We carried out extensive tests running GAENAdvertiser and
Each handset had the GAEN API and a modified version of the           the GAEN API on the same device to confirm that under a
Google exemplar Exposure Notification app [6] installed, and          wide range of conditions the responses of the GAEN API
was registered to a gmail user included on the Google GAEN            on a second receiver handset were the same for beacons
whitelist so as to allow use of the GAEN API by the Exposure          from GAENAdvertiser and the GAEN API, see [7] for further
Notification app. Each handset also had a GAENAdvertiser              details.
app developed by the authors installed. This app implements
the transmitter side of the GAEN API and allowed us to                GAENAdvertiser is open source and can be obtained by
control the TEK used and also to start/stop the broadcasting          contacting the authors (we have not made it publicly available,
of Bluetooth LE beacons.                                              however, since it can be used to facilitate a known replay attack
                                                                      against the GAEN API [8]).
At the start of each 15 minute experiment participants were
asked to configure the GAENAdvertiser app with a new TEK
                                                                      D. Querying the GAEN API
and then to instruct the app to start broadcasting GAEN
beacons. At the end of the experiment the GAENAdvertiser              The GAEN API takes low and high attenuation threshold
stopped broadcasting beacons. In this way a unique TEK is             values as input, together with the TEK and time interval of
associated with each handset in each experiment, and these            interest, and responds with three atttenuation duration values,
can be used to query GAEN API to obtain separate exposure             giving the duration (in minutes) that the attenuation level is
information reports for each handset in each experiment.              below the low threshold, the duration the attenuation level is
                                                                      between the low and high thresholds and the duration above
Following all three experiments the handsets were collected,          the high threshold. For each TEK and time interval we made
the TEKs used by each handset extracted and the GAEN API              repeated queries to the GAEN API holding the low threshold
on each then queried for exposure information relating to the         constant at 48dB and varying the high threshold from 49dB to
TEKs of the other handsets. In total, therefore, from these           100dB (in 1dB steps up to 80dB, then in 5dB steps since noise
experiments we collected GAEN API reports on Bluetooth LE             tends to be higher at higher attenuation levels). By differencing
beacon transmissions between 108 pairs of handset locations.          this sequence of reports we can infer the attenuation duration at
This measurement data is publicly available [1].                      each individual attenuation level from 48dB through to 100dB.
To provide baseline data on the radio propagation environment         We present the attenuation duration data obtained in this way
we also used the standard Android Bluetooth LE scanner                using a coloured heatmap. We split the range of attenuation
API to collect measurements of RSSI as the distance was
varied between two Google Pixel 2 handsets placed at a height           1 As   reported in the Settings-COVID 19 Notifications handset display.
3

                                                                                                                    80
                        75                                                                                          75

                                                                                                 Attenuation (dB)
                        70
                                                                                                                    70
     Attenuation (dB)

                        65
                                                                                                                    65
                        60
                                                                                                                    60
                        55
                        50                                                                                          55

                        45                                                                                          50
                                                                                                                         1   2    3     4   5
                        40                                                                                                   Distance (m)
                             5   10          15     20   25   (b)
                                      time (mins)
                                                                               Fig. 4: Mean attenuation level vs distance between handsets.
                                       (a)

Fig. 3: (a) Measurements of attenuation between two handsets
as the distance between them is varied along the centre aisle in                                                         III. R ESULTS
the tram carriage, (b) shows the setup used. The vertical dashed               A. Attenuation vs Distance
lines indicate when the distance between the handsets was
changed, starting at 0.5m and then increasing by 0.5m at each                  Figure 3(a) plots the attenuation measured between two hand-
step. The solid horizontal lines indicate the mean attenuation                 sets placed at seat height in the aisle of the tram as the distance
level at each distance. Measurements taken using the standard                  between them is varied. These measurements were taken using
Android Bluetooth LE scanner API.                                              the standard Android Bluetooth LE scanner API (rather than
                                                                               the GAEN API). This scanner API reports an RSSI value for
                                                                               each received beacon. Following [7] updated to reflect GAEN
                                                                               calibration changes pushed by Google on 13th June 2020, for
values shown on the y-axis into 2dB bins, i.e. 70-72dB, 72-                    the Google Pixel 2 handsets used in our experiments we map
74dB and so on, up to 80dB when 5dB bins are thereafter used                   from RSSI to attenuation level using the formula -31-(RSSI-6)
since the data is noisier at these low signal levels. Within each              dB.
bin the colour indicates the percentage of the total duration
reported by the GAEN API that was spent in that bin, e.g                       It can be seen that the attenuation initially increases as the
bright green indicates that more than 90% of the time was                      distance is increased from 0.5m to 1.5m, as might be expected.
spent in that bin. The mapping from colours to percentages is                  But thereafter the attenuation level stays roughly constant with
shown on the righthand side of the plot. Bins with no entries                  increasing distance out to 2.5m. There is then a sharp rise in
(i.e. with duration zero) are left blank. Where appropriate we                 the attenuation at 3m. This corresponds to the end of a group
also include a solid line in plots that indicates the average                  of seats and the start of a flexible joint between two carriages.
attenuation level at each transmit power level (the average is                 As the distance is increased further it can be seen that the
calculated by weighting each attenuation level by the duration                 attenuation starts to fall. The attenuation is around 52dB at
at that level and then summing over all attenuation levels).                   1.5m and around 60dB at 4m.
                                                                               These baseline measurements indicate that the radio attenua-
The GAEN documentation does not precisely state how the
                                                                               tion within the tram does not simply increase with the distance
attenuation level is calculated, nor does it give details as to how
                                                                               between handsets. This is similar to the behaviour observed
the attenuation duration is calculated. The analysis in [7], and
                                                                               in previous GAEN measurements taken on a bus [2], and is
subsequent personal communication from Google, establishes
                                                                               of course pertinent to the use of attenuation level as a proxy
that the attenuation level is calculated as PT X − PRX , where
                                                                               for distance.
PT X is the transmit power level sent in the beacon metadata
and PRX is given by a filtered RSSI2 measurements plus a
calibration offset.                                                            B. Attenuation Between Passengers
                                                                               The full attenuation duration data reported by GAEN API is
For the Google Pixel 2 handsets and GAEN API version                           given in the Supplementary Material and is publicly available
202512001 used in our experiments PT X is -31dB and the cal-                   online [1]. In this section we analyse two aspects of this
ibration offset is -6dB. Google supplied us with the calibration               data: (i) the relationship, if any, between attenuation level
and offset values used for all handset models in GAEN version                  and distance between handsets and (ii) the magnitude of the
202512001 and we have posted these in our online study                         variations in the attenuation level induced by differences in
archive [1]. Note that we observed that the noise floor (the                   the way participants hold their handsets.
RSSI below which beacons can no longer be reliably decoded)
is around -100dB in a Pixel 2, giving a maximum measureable
attenuation of around 75dB i.e. above this attenuation level                   C. Trend With Distance
beacons are generally not decoded successfully and so no RSSI                  Figure 4 plots the mean attenuation level vs the distance
values are reported by Bluetooth scans.                                        between participants in the three tests. The mean is calculated
                                                                               by weighting each attenuation level by the duration at that
   2 For Google Pixel 2 handsets (and others) the RSSI is recorded only from
                                                                               level reported by the GAEN API and then summing over all
beacons transmitted on one of the three radio channels used by Bluetooth LE    attenuation levels. It can be seen that there is no clear trend
for transmitting beacons, see [7].                                             in the mean attenuation level as the distance changes, with
4

                                                                                                               80

                                                                                     test 2 attenuation (dB)
                                                                                                               75

                                                                                                               70

                                                                                                               65                               1
                                                                                                                                                2
                                                                                                               60                               3
                                                                                                                                                4
                                                                                                               55                               5
                                                                                                                                                6
                                                                                                               50
                                                                                                                 50      60           70        80
                                                                                                                      test 1 attenuation (dB)

        (a) Threshold 55dB             (b) Threshold 63dB           Fig. 6: Mean attenuation level in test 2 vs test 1 for the
                                                                    same seat position. The legend indicates the seat index of the
                                                                    transmitting handset, see Figure 1(b) for the location. The solid
                                                                    line is the 45◦ line and the dashed lines the ±10dB lines about
                                                                    this.

                                                                    Since the seating locations and environment within the tram
                                                                    are the same between experiments, and particpants use the
        (c) Threshold 68dB             (d) Threshold 73dB           same model of handset, these variations can be attributed to
Fig. 5: Mean attenuation level vs distance between handsets.        differences in the way each particpant holds their handset
                                                                    and/or changes between tests in the way the same particpant
                                                                    holds their handset. Such substantial variations in attenuation
similar ranges of attenuation levels observed at all distances,     level are obviously pertinent to the use of attenuation level for
except perhaps for distances below 1m where the attenuation         proximity detection.
level is more tightly clustered.
The GAEN API records the duration at each attenuation,
and so effectively the full distribution of attenuation levels      E. Exposure Notification True/False Positive Detection Rate
rather than just the mean. Figure 5 plots the sum-duration that     The GAEN API is intended for use by health authority Covid-
the measured attenuation level is below 55dB, 63dB, 68dB            19 contact tracing apps [3]. When a person is found to
and 73dB. For each pair of handsets these values are the            be infected with Covid-19 the TEKs from their handset are
rescaled empirical CDF of the attenuation level evaluated at the    uploaded to a central server. The health authority app on
specified values. Recall that a typical definition of a proximity   another person’s handset can then download these TEKs, and
event is spending 15 minutes or more at a distance of 2m or         use them to compare against the set of beacons received by
less apart. We have therefore indicated the 2m distance with        the handset. If there is a match, the attenuation duration values
a vertical line in Figure 5, and attenuation durations greater      reported by the GAEN API can then be used to estimate the
than 15 minutes by the shaded areas.                                risk of infection and trigger an exposure notification is this
For reliable detection of proximity events what one might           risk is sufficiently high.
like is that for an appropriate choice of threshold value the
attenuation levels lie within the shaded area when the distance     A typical requirement is for a person to have spent at least 15
is less than 2m and outside the shaded area when the distance       minutes within 2m of the infected person in order to trigger an
is greater than 2m. Unfortunately we do not see such behaviour      exposure notification. The mapping from GAEN attenuation
in Figure 5. Instead, consistent with Figure 4 we see no            durations to exposure notification is therefore largely based
consistent trend between attenuation duration and distance          on use of attenuation level as a proxy for proximity between
below/above 2m.                                                     handsets.
                                                                    1) Swiss & German Exposure Notification Rules: Switzerland
                                                                    deployed a Covid-19 contact tracing app based on the GAEN
D. Magnitude of Inter-Test Variations
                                                                    API on 26 May 2020 [9]. The documentation for this app states
Between each of the three experiments the participants switch       that it queries the GAEN API with low and high attenuation
seats. The seat positions themselves remain the same, only          thresholds of t1 = 50dB and t2 = 55dB and then bases
the person sitting in the seat changes, allowing us to see the      exposure notifications on the quantity ES = B1 + 0.5B2,
impact of differences in the way that each participant uses         where B1 is the attenuation duration below 50dB reported by
their handset. For beacons transmitted from each seat position      the GAEN API and B2 is the attenuation duration between
Figure 6 shows the mean attenuation level observed at the           50dB and t2 [10]. An exposure notification is triggered is ES
other seat positions (see the Supplementary Material for the        is greater than 15 mins.
full attenuation duration data). The attenuation level observed
in test 1 is plotted vs the attenuation level observed in test 2.   Germany deployed a Covid-19 contact tracing app based on
It can be seen that the points are clustered around the 45◦ line,   the GAEN API on 15 June 2020 [11]. The app is open source.
but variations of ±10dB between the two tests are common.           By inspecting the documentation and code, and querying
5

                   80                                                        80                                                          100

                                                                                                                                                                                        Mean True Positive Rate (%)
                                                                                                                                                                                                                      100
                         duration thresh 10 min                                    duration thresh 10 min                                                                                                                       Duration thresh 10 min
                         duration thresh 15 min                                    duration thresh 15 min                                                                                                                       Duration thresh 15 min
                                                                                                                                          80                                                                           80
                   60                                                        60

                                                                                                                        Detections (%)
  Detections (%)

                                                            Detections (%)
                                                                                                                                          60                                                                           60
                   40                                                        40
                                                                                                                                          40                                                                           40

                   20                                                        20                                                           20                                                                           20
                                                                                                                                                              Duration thresh 10 min
                                                                                                                                                              Duration thresh 15 min
                   0                                                         0                                                             0                                                                            0
                    55        60         65       70   75                     55        60         65       70   75                         55   60     65        70      75       80                                       0     20       40      60    80    100
                                      t2 (dB)                                                   t2 (dB)                                               Threshold (dB)                                                            Mean False Positive Rate (%)

                    (a) t1 = 50dB (Swiss app)                                (b) t1 = 55dB (German app)                                                 (a)                                                                                (b)

Fig. 7: Exposure notification true and false positive rates when                                                      Fig. 8: Exposure notification true and false positive rates when
the threshold strategy used in the Swiss and German contact                                                           a simple threshold strategy is applied to the GAEN tram
tracing apps is applied to the GAEN tram dataset. Data is                                                             dataset. (a) True and false positive rates vs attenuation level
shown vs attenuation level and duration thresholds, solid lines                                                       and duration thresholds, solid lines indicate true positive rates
indicate true positive rates and dashed lines the corresponding                                                       and dashed lines the corresponding false negative rates. (b)
false negative rates.                                                                                                 ROC plot corresponding to mean rates in (a), dashed line
                                                                                                                      indicates 45◦ line.

the server API to obtain the app configuration settings3 , we
determined that the German app follows an approach similar                                                            the app configuration settings5 , we determined that the app
to the Swiss app for triggering an exposure notification, but                                                         follows a different approach to the Swiss and German apps,
uses values t1 = 55dB and t2 = 63dB.                                                                                  triggering an exposure notification whenever the attenuation
                                                                                                                      duration is above threshold t2 = 73dB i.e. without the
We applied the Swiss and German exposure notification rules                                                           weighting of 0.5 used in the Swiss and German exposure
to the tram dataset. Figure 7(a) plots the true and false positive                                                    notification rules.
rates for t1 = 50dB and as t2 is varied from 55dB upwards
and the ES threshold varied from 10 minutes to 15 mins. The                                                           We applied this exposure notification rule to the tram dataset.
mean rates are shown with one standard deviation indicated by                                                         Figure 8(a) plots the true and false positive rates as threshold
the error bars. The mean and standard deviation are obtained                                                          t2 is varied from 55dB upwards and the threshold for ES
by a standard bootstrapping approach4 . Figure 7(b) plots the                                                         is varied from 10 minutes to 15 mins. For t2 = 73dB the
true and false positive rates when t1 = 55dB.                                                                         true and false positive detection rates are both around 50%
                                                                                                                      when the threshold for ES is 15 minutes, rising to 80%
It can be seen from Figure 7(a) that selecting t1 = 50dB                                                              when the threshold for ES is reduced to 10 minutes. As
and t2 = 55dB (the values used in the Swiss app) yields no                                                            noted in Section II-D, with the calibration values used in
positive detections, despite approximately 50% of the handset                                                         the GAEN API the maximum observable attenuation level
pairs in the tram dataset being within a 2m distance of one                                                           with Google Pixel 2 handsets is around 75dB (above this
another. Increasing t2 to 62dB and above yields a small                                                               level beacons are generally no longer successfully received).
increase in detection rate, with true and false detection rates                                                       Selecting t2 = 73dB therefore means that almost the full
roughly equal (we comment further on the implications of this                                                         range of possible attenuation levels will trigger an exposure
below).                                                                                                               notfication. High detection rates are therefore unsurprising, but
It can be seen from Figure 7(b) that selecting t1 = 55dB and                                                          the detection has little discrimination and essentially would
t2 = 63dB (the values used in the German app) there are                                                               trigger exposure notifications for all participants in our tests
are no detections when the threshold for ES is 15 minutes.                                                            regardless of proximity.
Reducing this to 10 minutes, the true and false positive
                                                                                                                      Figure 8(a) also shows the true and false positive detection
detection rates both rise to 9%. Increasing t2 does not increase
                                                                                                                      rates for other choices of threshold t2. While the detection
these detection rates.
                                                                                                                      rates are generally substantially higher than with the Swiss and
2) Italian Exposure Notification Rule: Italy deployed a Covid-
                                                                                                                      German detection rules, it can be seen that the false positive
19 contact tracing app based on the GAEN API on 1 June
                                                                                                                      rate increases almost exactly in line with the true positive rate.
2020 [12], [13]. The app is open source. By inspecting the
                                                                                                                      This can be seen more clearly when this data is replotted in
documentation and code, and querying the server API to obtain
                                                                                                                      ROC format, see Figure 8(b). It can be seen that the true
                                                                                                                      vs false positive curve lies close to the 45◦ line. That is,
   3 This means that the app configuration can be dynamically updated. We
                                                                                                                      the detection performance is poor, and comparable to simply
downloaded the detection settings from the server on 21 June 2020 and they
are included in the study data repository [1]
                                                                                                                      selecting from participants at random when making exposure
   4 The dataset was resampled with replacement n = 1000 times, the                                                   notifications.
exposure notification percentage calculated for each sample and then the mean
and standard deviation of these n estimates calculated. We selected n by
calculating the mean and standard deviation vs n and selecting a value large                                            5 We downloaded the detection settings from the Italian app server on 21
enough that these were convergent.                                                                                    June 2020 and they are included in the study data repository [1]
6

                               IV. D ISCUSSION                        [2] ——, “Measurement-Based Evaluation Of Google/Apple Exposure
                                                                          Notification API For Proximity Detection In A Commuter Bus,”
A limitation of this study is that it is confined to handsets             15 June 2020. [Online]. Available: https://www.scss.tcd.ie/Doug.Leith/
using the Android operating system. The GAEN API is also                  pubs/bus.pdf
implemented on Apple iOS devices, but Apple have severely             [3] “Exposure Notifications: Android API Documentation,” accessed
limited the ability of testers to make measurements (each                 6 June 2020. [Online]. Available: https://static.googleusercontent.
                                                                          com/media/www.google.com/en//covid19/exposurenotifications/pdfs/
handset is limited to querying the GAEN API a maximum of                  Android-Exposure-Notification-API-documentation-v1.3.2.pdf
15 times a day, and Apple has no whitelisting process to relax
                                                                      [4] N. Kita, T. Ito, S. Yokoyama, M. Tseng, Y. Sagawa, M. Ogasawara,
this constraint. Our measurement approach uses 34 queries                 and M. Nakatsugawa, “Experimental study of propagation characteristics
to extract fine-grained attenuation data per pair of handset              for wireless communications in high-speed train cars,” in 2009 3rd
locations.                                                                European Conference on Antennas and Propagation, 2009, pp. 897–
                                                                          901.
We equipped participants with the same model of handset in            [5] L. Zhang, J. Moreno, and C. Briso, “Experimental characterisation and
order to remove this as a source of variability in the data and           modelling of intra-car communications inside highspeed trains,” IET
instead focus on variability caused by the radio environment              Microwaves, Antennas and Propagation, vol. 13, no. 8, pp. 1060–1064,
                                                                          2019.
and the way that people hold their handsets. Google and
Apple are currently undertaking a measurement campaign                [6] D. Leith and S. Farrell, “Modified Exposure Notification App,” 9 June
                                                                          2020. [Online]. Available: https://github.com/doug-leith/BLEapp
to select calibration values within the GAEN API with the
aim of compensating for differences between handset models.           [7] ——, “GAEN Due Diligence: Verifying The Google/Apple Covid
                                                                          Exposure Notification API,” 13 June 2020. [Online]. Available:
We therefore expect that our measurements should also be                  https://www.scss.tcd.ie/Doug.Leith/pubs/gaen verification.pdf
applicable to a range of handsets, although this remains to be
                                                                      [8] S. Farrell and D. Leith, “A Coronavirus Contact Tracing App Replay
confirmed.                                                                Attack with Estimated Amplification Factors,” 19 May 2020. [Online].
                                                                          Available: https://down.dsg.cs.tcd.ie/tact/replay.pdf
                               V. C ONCLUSION                         [9] BBC News, “Coronavirus: First Google/Apple-based contact-tracing
                                                                          app launched,” Accessed 14 June 2020. [Online]. Available: https:
We report on the results of a Covid-19 contact tracing mea-               //www.bbc.com/news/technology-52807635f
surement study carried out on a commuter tram in Dublin,
                                                                     [10] DP-3T Team, “DP-3T Exposure Score Calculation Sum-
Ireland. Our measurements indicate that in the tram there is              mary,”   Accessed       14   June    2020.     [Online].  Avail-
little correlation between received signal strength of distance           able: https://github.com/DP-3T/documents/blob/master/DP3T\%20-\
between handsets. We applied the detection rules used by the              %20Exposure\%20Score\%20Calculation.pdf
Italian, Swiss and German apps to our measurement data and           [11] “Corona-Warn-App Open Source Project,” accessed 23 June 2020.
also characterised the impact on performance of changes in                [Online]. Available: https://www.coronawarn.app/en/
the parameters used in these detection rules. We find that           [12] “Immuni App Web Site,” accessed 23 June 2020. [Online]. Available:
the Swiss and German detection rules trigger no exposure                  https://www.immuni.italia.it/
notifications on our data, while the Italian detection rule          [13] “Immuni Apple Store Version History,” accessed 23 June 2020. [Online].
generates a true positive rate of 50% and a false positive rate           Available: https://apps.apple.com/us/app/immuni/id1513940977/
of 50%. Our analysis indicates that the performance of such
detection rules is similar to that of triggering notifications by
randomly selecting from the participants in our experiments,
regardless of proximity

                          ACKNOWLEDGEMENTS
The authors would like to extend their thanks to the Irish
Health & Safety Executive (HSE) for arranging with Google
for us to have whitelisted access to the GAEN API, and
to Transdev Dublin Light Rail for kindly providing access
to one of their trams. Trinity College Dublin, (the authors’
employer) funded the “Testing Apps for Contact Tracing”
(TACT) project6 that has allowed us the time and handsets
required here. We emphasise that any views expressed in this
report are the authors own, and may not be shared by the HSE,
Transdev or Trinity College Dublin.

                                 R EFERENCES
 [1] D. Leith and S. Farrell, “Dublin Luas Tram GAEN Attenuation
     Durations Dataset,” 23 June 2020. [Online]. Available: https:
     //github.com/doug-leith/dublintram gaen dataset

  6 See   https://down.dsg.cs.tcd.ie/tact/
7

                S UPPLEMENTARY M ATERIAL
                                                                                          80                    100                                     80                    100

Figures 9 - 11 plot the exposure information between each                                                       80                                                            80

                                                                       Attenuation (dB)

                                                                                                                                     Attenuation (dB)
                                                                                          70                                                            70
pair of handsets reported by the GAEN API for each of

                                                                                                                      Duration (%)

                                                                                                                                                                                    Duration (%)
                                                                                                                60                                                            60
                                                                                          60                                                            60
the three experiments. To assist with interpreting the plots                                                    40                                                            40

the reports in each plot are ordered by increasing distance                               50
                                                                                                                20
                                                                                                                                                        50
                                                                                                                                                                              20

between the pairs of participants (see Figure 1(a)). No data                              40                    >0                                      40                    >0

is shown when no beacons were received between a pair of
                                                                                               Pair of People                                                Pair of People
handsets, e.g. between particpants 2 and 3 in Figures 9(b) and
                                                                                                     (a)                                                           (b)
9(c). It can be seen that occasionally there is an increasing
trend in attenuation, for example see Figures 9(c) and 11(c),                             80                    100                                     80                    100

but this is infrequent. Occasionally there is a decreasing                                                      80                                                            80

                                                                                                                                     Attenuation (dB)
                                                                       Attenuation (dB)
                                                                                          70                                                            70

                                                                                                                                                                                    Duration (%)
                                                                                                                      Duration (%)
trend in attenuation, for example see Figures 9(e) and 11(d).                             60
                                                                                                                60
                                                                                                                                                        60
                                                                                                                                                                              60

Overall, however no consistent trend is evident in the change                                                   40                                                            40

                                                                                          50                                                            50
in attenuation level with increasing distance.                                                                  20                                                            20

                                                                                          40                    >0                                      40                    >0
In Figure 11 participants 1 and 3 place their handsets in their
                                                                                               Pair of People                                                Pair of People
left trouser pocket rather than their hand. Intuitively, one might
                                                                                                     (c)                                                           (d)
expect this change to increase the attenuation level since the
particpants body is now more likely to affect transmission                                80                    100                                     80                    100

and reception of radio signals. However, comparing Figures                                                      80                                                            80

                                                                       Attenuation (dB)

                                                                                                                                     Attenuation (dB)
                                                                                          70                                                            70

                                                                                                                      Duration (%)

                                                                                                                                                                                    Duration (%)
11(a) and 11(c) with Figures 9 and 10 it can be seen that                                                       60                                                            60
                                                                                          60                                                            60
this change does not cause any consistent change in the                                                         40                                                            40

observed attenuation level. For example, comparing Figures                                50
                                                                                                                20
                                                                                                                                                        50
                                                                                                                                                                              20

11(a) and 10(a) the attenuation level between participants 1                              40                    >0                                      40                    >0

and 5 decreases from test 2 to test 3, while the attenuation                                   Pair of People                                                Pair of People
level between participants 1 and 3 increases.                                                        (e)                                                           (f)

                                                                     Fig. 9: Attenuation durations reported by GAEN API on
                                                                     completion of the first test. Pairs indicated on x-axis in each
                                                                     plot are ordered by increasing distance.
8

                                                                                                                                                   80                    100                                     80                    100
                     80                    100                                     80                    100
                                                                                                                                                                         80                                                            80

                                                                                                                                Attenuation (dB)

                                                                                                                                                                                              Attenuation (dB)
                                                                                                                                                   70                                                            70
                                           80                                                            80
  Attenuation (dB)

                                                                Attenuation (dB)

                                                                                                                                                                               Duration (%)

                                                                                                                                                                                                                                             Duration (%)
                     70                                                            70
                                                                                                                                                                         60                                                            60
                                                 Duration (%)

                                                                                                               Duration (%)
                                           60                                                            60                                        60                                                            60
                     60                                                            60                                                                                    40                                                            40
                                           40                                                            40
                                                                                                                                                   50                                                            50
                                                                                                                                                                         20                                                            20
                     50                                                            50
                                           20                                                            20
                                                                                                                                                   40                    >0                                      40                    >0
                     40                    >0                                      40                    >0

                                                                                                                                                        Pair of People                                                Pair of People
                          Pair of People                                                Pair of People
                                                                                                                                                              (a)                                                           (b)
                                (a)                                                           (b)
                                                                                                                                                   80                    100                                     80                    100
                     80                    100                                     80                    100
                                                                                                                                                                         80                                                            80

                                                                                                                                                                                              Attenuation (dB)
                                                                                                                                Attenuation (dB)

                                                                                                                                                   70                                                            70
                                           80                                                            80
  Attenuation (dB)

                                                                Attenuation (dB)

                                                                                                                                                                                                                                             Duration (%)
                                                                                                                                                                               Duration (%)
                     70                                                            70
                                                                                                                                                                         60                                                            60
                                                 Duration (%)

                                                                                                               Duration (%)

                                           60                                                            60                                        60                                                            60
                     60                                                            60                                                                                    40                                                            40
                                           40                                                            40
                                                                                                                                                   50                                                            50
                                                                                                                                                                         20                                                            20
                     50                                                            50
                                           20                                                            20
                                                                                                                                                   40                    >0                                      40                    >0
                     40                    >0                                      40                    >0

                                                                                                                                                        Pair of People                                                Pair of People
                          Pair of People                                                Pair of People
                                                                                                                                                              (c)                                                           (d)
                                (c)                                                           (d)
                                                                                                                                                   80                    100                                     80                    100
                     80                    100                                     80                    100
                                                                                                                                                                         80                                                            80
                                                                                                                                Attenuation (dB)

                                           80                                                            80
                                                                                                                                                   70
                                                                                                                                                                                              Attenuation (dB)   70
  Attenuation (dB)

                                                                Attenuation (dB)

                                                                                                                                                                               Duration (%)

                                                                                                                                                                                                                                             Duration (%)
                     70                                                            70
                                                                                                                                                                         60                                                            60
                                                 Duration (%)

                                                                                                               Duration (%)

                                           60                                                            60                                        60                                                            60
                     60                                                            60                                                                                    40                                                            40
                                           40                                                            40
                                                                                                                                                   50                                                            50
                                                                                                                                                                         20                                                            20
                     50                                                            50
                                           20                                                            20
                                                                                                                                                   40                    >0                                      40                    >0
                     40                    >0                                      40                    >0

                                                                                                                                                        Pair of People                                                Pair of People
                          Pair of People                                                Pair of People
                                                                                                                                                              (e)                                                           (f)
                                (e)                                                           (f)
                                                                                                                              Fig. 11: Attenuation durations reported by GAEN API on
Fig. 10: Attenuation durations reported by GAEN API on
                                                                                                                              completion of the third test (with the same participants as in
completion of the second test (with the same participants as in
                                                                                                                              the first test, but with their seating positions swapped about
the first test, but with their seating positions swapped about).
                                                                                                                              and participants 1 and 3 with handsets in their trouser pocket
Pairs indicated on x-axis in each plot are ordered by increasing
                                                                                                                              rather than their hand). Pairs indicated on x-axis in each plot
distance.
                                                                                                                              are ordered by increasing distance.
You can also read