Social Impact Assessment Series Nursing Home Support Scheme - (NHSS) - Irish Government ...
←
→
Page content transcription
If your browser does not render page correctly, please read the page content below

Social Impact Assessment Series

Nursing Home Support Scheme
(NHSS)

D EIRDRE C OLLINS
H EALTH V OTE , D EPARTMENT                    OF   P UBLIC E XPENDITURE
AND R EFORM

A UGUST 2019

This paper has been prepared by IGEES staff
in the Department of PER. The views
presented in this paper do not represent the
official views of the Department or Minister
for PER.
Executive Summary
Features of NHSS
A Social Impact Assessment (SIA) is an evidence-based methodology which
attempts to assess the impact of a particular policy on a cohort of targeted
individuals. The Nursing Home Support Scheme (NHSS), also known as the
Fair Deal, is a targeted service for residents in Ireland who require long-term
nursing home care. Individuals make a means-assessed contribution to the
cost of their care, paying 80% of assessable income and 7.5% of the value of
any assets held annually. The State funds the difference in this contribution
and the cost of a nursing home place.
It is within the context of a small but growing elderly population, that has a
comparatively high life expectancy at 65 years, that this paper focuses on
the impact of public expenditure on the NHSS. Budgetary expenditure for
NHSS has increased in line with an increase in numbers and applications. In
the six years to 2019, Exchequer expenditure on the NHSS grew by almost
€100 million or 11%.
This analysis is a point-in-time exercise which identifies numbers in receipt
of this financial support and the characteristics of these recipients in order
to generate a baseline profile of beneficiaries. This paper forms part of the
Social Impact Assessment (SIA) series of DPER publications.
In addition to those accessing the State support element of the Scheme,
there is an increase in those applying for Ancillary State Support – the
‘Nursing Home Loan’. The majority of applications to the NHSS come from
the acute hospital setting (44%) followed by referrals from the community
(38%).
Key findings
Profile of those in receipt of NHSS
- The cohort of females in the NHSS greatly exceeds males at 66% to 34%. This
follows through from general population trends, which show males in
Ireland have a slightly lower life expectancy at 65 with 18.6 years compared
with their female counterparts at 21.1 years.
- An individual in the NHSS is most likely to be aged over 80 years of age.
- The highest percentage of leavers in the NHSS exit the Scheme after 2 to 4
years and just 3.5% are resident over 10 years.
- In a county comparison, Leitrim has the highest percentage of elderly people
in their population and the highest uptake of the NHSS from the elderly
cohort, second only to Offaly. Donegal has the lowest uptake of the NHSS in
their elderly population despite a comparatively high percentage of elderly
in the county. Donegal not only has a low uptake of the Scheme but within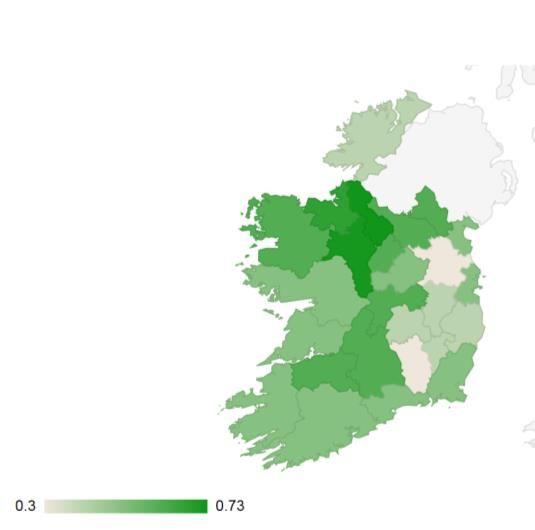
the cohort that are in NHSS, it has one of the lowest uptake of the Nursing
Home loan option.
Assets of those in receipt of NHSS
- A financial assessment is made on admission to the Scheme and this self-
reported application is subject to random audits. Revenue have permission
under the NHSS Act (2009) to review applications with Social Welfare
consulted with regards any social welfare allowances a client receives. Total
declared assets for clients in NHSS at 31 December 2018 was €4 billion.
- The average cash assets of Scheme participants, presented in this analysis,
is based on declared assets prior to the calculation of allowable deductions.
The average value of these cash assets rose from €49,590 in 2014 to €64,420
in 2018 (12%). The average value per client of other relevant assets, which
includes the principal private residence and other property, stood at €88,941
in 2014 and increased to €134,589 by 2018 (35%).
Client contributions
- The contribution based on land or property may be deferred and collected
from the individual’s estate within 12 months of them exiting the Scheme.
In other words, clients can opt to defer the portion of their contribution from
their principal private residence (PPR). This optional element of the Scheme
is legally named Ancillary State Support (A.S.S.). The percentage of those in
NHSS receiving the nursing home loan, A.S.S., has increased by 5% since
2014.
- The greatest percentage of those in NHSS opting for the nursing home loan
are in areas where the value of that PPR asset are comparatively higher.
- The average weekly declared income for a single person applying for NHSS
was €297 in 2018 and €605 for a couple.
- The average weekly client contribution in 2018 was €301 with the average
weekly cost of a nursing home bed €1,280.
Characteristics of the average NHSS participant
The characteristic NHSS participant is;
- Referred from the Acute hospital setting
- Applying for both State Support along with ASS
- Waiting under 4 weeks for funding approval;
- Is a female over 80 years of age
- Remaining 2 to 4 years in the Scheme.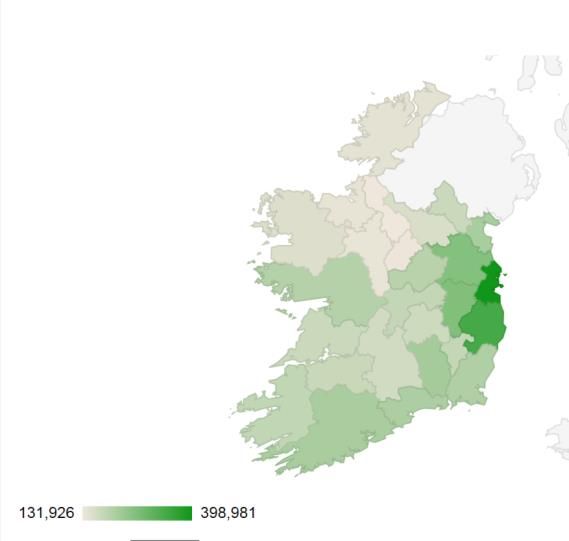
1. Introduction
A Social Impact Assessment (SIA) is an evidence-based methodology which attempts to assess the
impact of a particular policy on a cohort of targeted individuals1. 79% of private nursing home
residents in Ireland are NHSS funded2. This paper focuses on the impact of public expenditure on the
Nursing Home Support Scheme (NHSS). It undertakes a point-in-time exercise which identifies
numbers in receipt of this financial support and the characteristics of these recipients in order to
generate a baseline profile of participants of the Scheme. This paper forms part of the Social Impact
Assessment (SIA) series of DPER publications.
The objectives of this paper are to:
Look at numbers participating in NHSS;
Establish a profile of recipients distinguishing them based on age, gender, location and
average length of stay;
Compare regional participation in the Scheme;
Outline the income, assets and loans that clients in the Scheme hold;
Identify further analysis which could be undertaken in this space in light of the findings of this
paper and the potential impacts of future policy change.
1.2 Data Sources
This analysis is based on data collated from NHSS applications and Health Service Executive (HSE) NHSS
reports provided to the Department of Public Expenditure and Reform (DPER) on a monthly basis.
Central Statistics Office (CSO) statistics are utilised to provide an overview of the elderly population
resident in Ireland along with Census data which records the overall numbers of those residing in
nursing homes in Ireland. Revenue collects funds in relation to the nursing home loan as the
administrator and so this administrative data is used to assess this aspect of the Scheme.
2. Overview of NHSS
2.1 What is the NHSS?
The Nursing Homes Support Scheme (NHSS), also known as the Fair Deal, is a targeted service for
residents in Ireland who require long-term nursing home care. It was introduced with the aim of
providing financial support for accessing long-term nursing home care for all who are deemed to be
in need3. This support replaced the pre-existing Subvention scheme4. The primary objective of the
NHSS, a co-funding model between the State and individual, is to ensure that long-term nursing home
1
An outline of the SIA framework is available at; https://igees.gov.ie/wp-content/uploads/2016/10/SIA-Framework-
Final-101016.pdf
2 Eurofound study, Care homes for older Europeans: Public, for-profit and non-profit providers, 2017.
https://www.eurofound.europa.eu/sites/default/files/ef_publication/field_ef_document/ef1723en.pdf
3
HSE Annual Report and Financial Statements 2009
https://www.hse.ie/eng/services/publications/corporate/annualreport2009.pdf
4
The Nursing Home Subvention Scheme was introduced in 1993 under the Health (Nursing Homes) Act, 1990.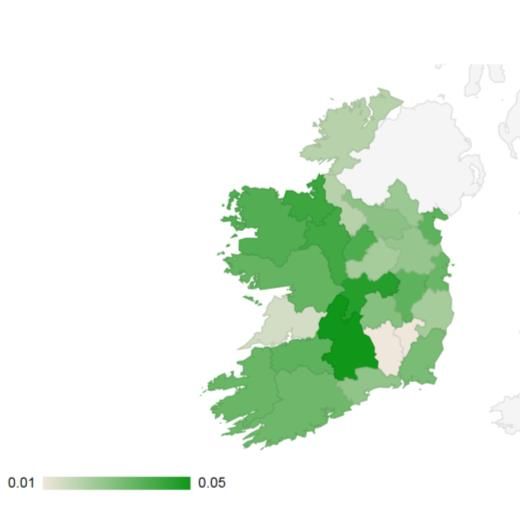
care is accessible and affordable for all, regardless of age and income, and that people are cared for
in the setting most appropriate to their needs.

Established under the Nursing Home Support Scheme Act (2009) and signed into law 1st July 2009, the
Scheme came into effect 27th October 2009. It was amended by the Health (Amendment) Act 20135,
and the Health (General Practitioner Service) Act 20146 amongst others. Administration of the Scheme
lies with the HSE.

Under NHSS, a prospective client undergoes a care needs assessment and a financial assessment to
establish if they require long-term nursing home care, and if such care is required, how much they will
contribute to the cost of this care.

The Care Needs Assessment ascertains whether an individual is in need of long-term nursing home
care. It is carried out by the HSE and assesses the ability of an individual to undertake daily tasks such
as bathing, dressing and mobility. It also takes a rounded view of family, community and social
supports and makes an assessment to determine if these are adequate for the applicant’s needs or if
long-term nursing home care is required. The assessment evaluates whether an individual requires
long-term care in a nursing home setting or if support packages would allow them to continue to live
in the community7. The care needs is undertaken using the standardised common summary
assessment report (CSAR). When the care needs assessment has been completed, a report, the CSAR
summarises the findings of the healthcare professional. In November 2018 88.5% of clients had their
CSAR processed within 6 weeks.

The next step, Financial Assessment ascertains how much an individual will contribute to the cost of
his/ her care. The application form is self-assessed and the applicant must include documentary
evidence. The value of an applicant’s contribution is determined in accordance with their income and
assets held and State support covers the balance of the cost of care. Under the Act, generally, the
only qualifying criteria for participation in the Scheme is whether long-term residential care services
are required, on the basis of the care needs assessment.

Individuals make a means-assessed contribution to the cost of their care, paying 80% of assessable
income8 and 7.5% of the value of any assets held annually9. Applicants for whom the level of their
statutory contribution is assessed to be higher than the cost of care are not deemed eligible for State
support under the Scheme. However, they can apply for the Scheme and pay, fully with no State
contribution, the NHSS rate that a nursing home charges. They can also apply for the Ancillary State
Support ‘nursing home loan’.

5 Principal residence contribution was raised from a three year cap of 15% to 22.5% for a single individual. For a couple this
rate raised to an annual contribution of 11.25% from 7.5%.
6
  The term ‘Transferred Asset’ was extended from an asset that has been transferred from ‘5 years prior to’ the date of
application to ‘5 years prior to or at any time on or subsequent to’ the date on which an application for State support is
first made.
7
  Those already in a nursing home prior to applying to the scheme will not be subject to this care needs assessment.
8 Clients retain 20% of their income or 20% of the maximum weekly State Pension whichever is greater. The remainder
(80%) contributes to the cost of their nursing home care.
9
  The first €36,000 worth of assets, or €72,000 in the case of a couple, are not included in the financial assessment. An
individual’s principle residence is included for the first three years of care only.
The capital value of an applicant’s principal private residence contributes to the cost of care for the
initial 3 years of care. Where assets include land or property, the contribution based on the value of
these assets may be deferred and collected from the individual’s estate within 12 months of them
exiting the NHSS. This optional element of the scheme is legally referred to as Ancillary State Support
(A.S.S.).

The average client contribution to the costs of a Nursing Home is 24%10. The cost of a nursing home
place itself is the price of a place in a given nursing home, agreed between the nursing home and the
National Treatment Purchase Fund (NTPF) in the case of a private or voluntary nursing home and set
by the HSE in the case of a public nursing home. Any nursing home can be chosen as long as the nursing
home is an approved home for the purposes of the Scheme, there is availability and the home has the
ability to support an individual’s needs. A client in NHSS residing in a public nursing home pays the
contribution to the HSE, with the balance of the cost of care funded by the HSE. In a private nursing
home their contribution is paid directly to the nursing home, with the HSE paying the balance to the
private home.

Over time the scheme has remained relatively unchanged. Some minor amendments have been
enacted, mostly regarding the application process. One significant amendment was the Health
(Amendment) Act 2013, which increased the percentage contribution of assets in the financial means
assessment from 5% to 7.5%.

There is a policy change recently approved by Government in relation to farm and business assets.
The three year capitation on contributions from these assets currently only applies if there is a sudden
adverse event such as the sudden illness of the owner. A Memorandum for Government in June 2019,
the Nursing Home Support Scheme (Amendment) Bill, approved the proposed policy change to the
NHSS to treat farm and relevant business assets in the same manner as the PPR. This is discussed in
further detail in Section 6.4.

2.2 Spend on NHSS 2013 -2018
The 2019 budget for NHSS is €986 million. Figure 1 below shows that spend on NHSS has increased
year on year since 2014.

10
     See Section 6.5.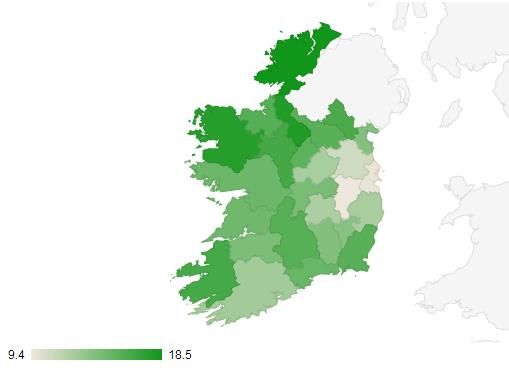
Figure 1 Exchequer expenditure NHSS 2013-2019

From 2013 to 2019 the Exchequer                                    €1,000
expenditure on the Scheme grew by almost                            €980
                                                                                                                          €986
€100 million or 11%. The largest increase in                        €960
                                                                                                                   €962
funding occurred between 2015 and 2016                              €940
                                                                                                            €943

                                                        millions
when a decision was taken (in early 2015)                           €920
to fully fund the NHSS.                                                                              €921
                                                                    €900
                                                                    €880                   €894
                                                                            €887
                                                                    €860           €876

                                                                    €840
                                                                    €820
                                                                            2013   2014    2015      2016   2017   2018   2019
                                                           Source: HSE NHSS monthly data

In 2011 5% of the elderly population in Ireland (65 and over) were in a Nursing home and almost
18% of the 85+ age group. This percentage fell in the five years to 2016 when the Census showed
that 4% of those aged 65 and over are resident in a Nursing Home and 15% of those aged over 85
years of age in a nursing home. One could assume this to be a reflection of an elderly population
who are less inclined to require residential care or have greater access to non-residential supports
such as home support allowing them to reside in their home for longer. Previous analysis found no
significant correlation in changes in the size of the elderly population and the demand for NHSS
funding (Campbell and Connors, 201511).

3. Demographic overview of elderly population
Census 2016 showed the average age in Ireland12 to be increasing with the projected old age
dependency ratio13 is also set to rise from 20% in 2016 to 28% by 2031.

The elderly population saw the largest increase in population since 2011, rising by 19.1%. 13.5% of
the population in Ireland is categorised as elderly, up from 10.8% in 2008. Elderly in this context is
any individual over 65 years of age. The CSO forecast this to increase to 18.5% by 2031. To put this in
context, the percentage of persons that are considered elderly in the EU 28 currently is much higher
at 19.4%. In other words, Ireland has a relatively small but growing proportion of elderly in the
population. Life expectancy for those 65 years and over in Ireland is almost on par with the EU (28
countries) average of 20 at 19.9 years, meaning an individual in Ireland at 65 is expected to live until
they are 85.

The Economic and Social Research Institutes (ESRI) Projections of Demand for Healthcare in Ireland
2015-2030, found that the demand for places in nursing homes and other settings for long as well as
intermediate term periods is forecast to increase by between 40% to 54% from 2015-2030. Over the
same period, demand for home help hours is estimated to increase in the range of 38% to 54%. This

11 Nursing Homes Support Scheme The Fair Deal, affordable and sustainable https://igees.gov.ie/wp-
content/uploads/2014/11/Nursing-Homes-Support-Scheme.pdf
12 37.4 years in 2016. Central Statistics Office (CSO) https://www.cso.ie/en/census/
13 The number of persons over 65 as a percentage of the working age population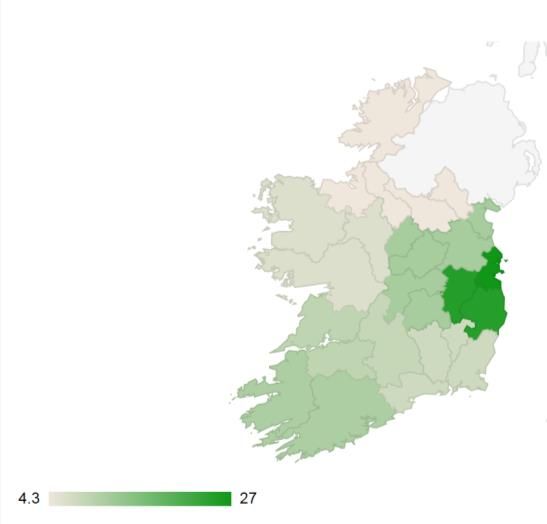
is in line with the European Commission’s 2015 Ageing Report which forecasts that by 2060 public
expenditure in long-term care will increase by a proportionately greater extent than total expenditure
on healthcare.

It is within this context of a small but growing elderly population that has a comparatively high life
expectancy at 65 (the cohort that this policy is most applicable to)and the forecasted increase in
demand for nursing home places that this paper outlines who is participating in the NHSS.

4. Numbers in NHSS
4.1 Scheme demand
Applications to the NHSS come from a variety of sources, such as mental health facilities, those in
nursing home care but not in the Scheme and hospital care14. The trend in the percentage breakdown
of source of application referrals has remained consistent since 2012. Figure 2 graphs the source of
applicants to the NHSS scheme15. The majority of applications to the NHSS come from the acute
hospital setting (44%) followed by referrals from the community (38%). A 2017 report, 'Planning for
Health’ found that in 2015 48% of delayed discharges in acute hospitals for those aged 65 and over
was due to the individual waiting on home care package support or to enter the NHSS. In 2010 the
CSO found that 4 in 10 people look after a parent or parent-in-law with one third caring for someone
due to old age, which could explain the almost 40% referrals from a community setting.

Figure 2 Application Referral Source 2018
                                         Mental Health Disabiities
                    Public/ Voluntary        1%            0%
           Private Nursing 7%
         Homes (subvention
            patients)
                0%

     Private Nursing Homes
        (non-subvention
            patients)                                                           Acute Hospitals
               9%                                                                    44%

                       Community
                          38%

Source: Department of Health

14 An individual who is in a hospital setting and no longer requires acute care, but may need long-term care can apply to
the NHSS to receive such care in a nursing home setting.
15 If an individual was receiving subvention prior to 27 October 2009 they can choose to continue with subvention or move

onto the NHSS scheme.
Applicants to the NHSS can apply for State support alone or State support along with Ancillary State
Support (the nursing home loan)16. In the twelve months of 2018, 10,221 applications were received
to the NHSS; 3% more than for the same period in 2017 and 1.8% (or 182 applications) higher than
expected levels for 2018. The driver behind this peak in applications has not been validated although
it has been suggested that a combination of extreme weather events and a virulent flu season may
have contributed.
Since 2012 State support only applications fell by 0.8% with the joint State support and Ancillary State
Support (A.S.S.) applications rising by over 4%. Figure 3 below shows that, State support only fell from
84% of all applications in 2013 to 76% in 2017 and began to rise again to 83% of all applications in
2018. In 2012 16% of applications for NHSS applied for both State support and the nursing home loan.
This had risen to 24% by 2017. In other words, those applying for NHSS are increasingly applying for
co-funding in the semblance of State Support along with the A.S.S.
Figure 3 Number of NHSS Applications Received 2012-2018 and the percentage change year on year
4.0%
3.1%
10,000 2.4%
1.8% 2.1% 2.0%
8,000
0.0%
6,000 8,555 8,695 7,930 7,928 7,509 8,479
8,028 -2.0%
4,000 -2.9%
-4.0%
2,000 -6.0%
-6.2%
2,066 2,280 2,402
1,670 1,711 1,729 1,742
0 -8.0%
2012 2013 2014 2015 2016 2017 2018
State Suport & Ancillary State Support State Support only
% change in Number of Applications received
Source: Department of Health
4.1 Funding Approvals
A total of 8,725 individuals were approved for NHSS funding in the twelve months of 2018 compared
to 8,168 people approved in the same period in 2017; a 7% increase in approvals year on year.
The target of maintaining the wait time for funding approval at no more than 4 weeks has been
consistently achieved since 2015 when NHSS became a fully funded scheme; a significant reduction
from peak wait times of 15 weeks in October 2014.
16
Ancillary State Support can be applied for prior to or at any time an individual is resident in a nursing home.The numbers on the placement list (funding approved but not yet released) also saw numbers waiting
for funding release fall post 2014. It was 530 at end 2018 – a significant reduction in the numbers17
and time spent waiting post 2014. The list of those whose funding has been approved but they have
yet to take up their placement in long term care has risen each year since 2013, 55% over the period.
To take an overall view of applications, the time between approvals and funding being made
available has become shorter but the time it’s taking clients to take up their placement once funding
has been approved and released is rising.
4.2 Number of people funded under NHSS scheme
The number of those who enter nursing homes depends on a number of variables not least
dependency levels, the availability of informal or community care and the availability and access to
home care supports.
New entrant numbers (numbers entering NHSS in a given year) were up by 12% year on year between
2017 and 2018; from 8,073 to 9,028.
Despite the increase in new entrants in 2018, the number of people supported under the NHSS at
end December 2018 was just below the HSE forecasted outturn of 23,334 people, as the number of
leavers from the Scheme also increased significantly in 2018.
Figure 4 Number of people funded under NHSS 2012-2018
23,400 23,142
23,073 23,305
23,000 23,007 22,949
22,600
22,360
22,200
22,065
21,800
21,400
21,000
2012 2013 2014 2015 2016 2017 2018
Source: Department of Health
Figure 4 shows that the trend in the number of individuals funded in the NHSS from 2012 to 2018 has
increased by 1,240 or 6%. It has remained relatively flat since 2015, only increasing by 1% or an
average of 77 persons a year. 23,042 people are projected to be in NHSS support by end 2019.
17
In October 2014 the number of approvals awaiting funding to be released peaked at 2,135 (NHSS, Monthly Monitoring
Reports).4.5 Total number of leavers 18
The number of leavers exiting the NHSS has increased consistently year on year since 2014, with leaver
numbers increasing by almost 24% (12% from 2014-2015 alone). The high number of leavers from the
Scheme in 2017 can, in part, be attributed to the influenza outbreak that year. 2018 saw a further 4%
increase in leavers. The number of those who exited the scheme (8,565) in the twelve months of 2018
was 715 (9%) more than expected19.
Figure 5 Total number of leavers
10,000
9,000
17.3%
8,000 8,565
8,052 8,266
7,000 7,786
7,302
6,933
6,000
5,000
4,000
3,000
2,000
1,000
0
2013 2014 2015 2016 2017 2018
Source: Department of Health
The majority of clients exited the system having been participants for on average 3 years. Just 3.5% of
residents are part of the Scheme for over 10 years. Many of these are clients from before the
commencement of the Scheme as the Scheme is in operation just under a decade. Average length of
stay is discussed in further detail in Section 5.
18 ‘Leavers’ for the purpose of this paper are those who exit the Scheme for any reason and who are no longer in support of
this NHSS State funding
19 The expected number of levers are based on trends over the 5 year period from 2013 to 2017.Figure 6 Percentage of Leavers from long-stay (NHSS) beds by Destination on Discharge, 2017
Acute Hospital
Community 2% Long-stay Hospital/
3.5% Home
10%
Other
0%
Death
84%
Source: Department of Health
In 201720 84% of exits from the NHSS were due to death. 10% appear to have left the Scheme but
remain in long-stay hospital care. An example of this would be a client who has been discharged from
a nursing home to an acute hospital setting due to illness or disease progression.
5. Profile of Recipients
This section will look at the profile of NHSS recipients. It will include characteristics such as age,
gender, region and average length of stay, along with an estimate of the average income and assets
of clients.
5.1 Age
An individual in the NHSS is most likely to be aged over 80. Individuals aged 80 years or over make
up 70% of NHSS clients; 50% of clients are over 85. The population 80 years and over, who are the
core NHSS clients, is forecast to rise to between 470,000 and 484,000 by 2046.
Table 1 Percentage distribution of residents in long-stay beds (NHSS) 2017 by Age
Age Under 40 40-64 65-69 70-74 75-79 80-84 85-89 90-94 95 and older
% of 0.3% 5.2% 4.2% 7.6% 12.7% 20.5% 24.7% 17.9% 6.9%
residents
Source: Department of Health, Long Stay Activity Statistics 2017
Table 1 shows that the age cohort with the largest percentage of clients, for both males and females,
is the four year age bracket from 85 to 89 years of age. Not surprisingly, the age group with the lowest
percentage of residency at just 0.3% is the under 40 age group. Clients under 40 years require long
20
The Department of Health’s, Long-Stay Activity Statistics 2017, references the figure of 8,326 residents, covered by the
NHSS, were discharged from long-stay beds in 2017. https://health.gov.ie/wp-
content/uploads/2018/11/long_stay_2017.pdfterm residential care for numerous reasons including early onset dementia or acquired brain injury.
3% of the elderly population Ireland are NHSS funded.
5.2 Gender Profile
In the general population overall, there is on average a 50:50 split in males and female. However figure
8 shows that as you move through the age groups, the female to male ratio increases. 66% of the
population over 85 is female.
Figure 7 Older population by sex and age group, 201721
85 years and over
80-84
75-79
70-74
65-69
0% 10% 20% 30% 40% 50% 60% 70% 80% 90% 100%
Male Female
Source: Central Statistics Office (CSO)
On average there are more females than males in receipt of NHSS funding. Figure 8 below graphs the
elderly population by age cohort and gender in the NHSS. In the under 65 year old cohort in the NHSS,
there is a higher percentage of males at 53%. However, as with the general population an increase in
age shows an increase in the female to male ratio. From age 75 and older, the male-female ratio
declines. 58% of those aged over 75 in the NHSS are female.
21
CSO annual population estimates based on 2016 Census https://www.cso.ie/en/census/Figure 8 Percentage distribution of residents in long-stay beds (NHSS) 2017 by Age and Gender
4,000
4,091
3,500
3,000 3,245
3,092
2,500
2,000
1,500 1,661 1,672 1,688
1,299 1,369
1,000 1,196
1,061
895 861 927
500
238
0Figure 9 Percentage of Residents in long-stay beds by Gender 2017 and CHO
100.0%
90.0%
80.0%
70.0%
60.0%
50.0%
63.7% 61.3% 63.0%
40.0% 64.8% 66.3% 64.6% 65.1%
71.1% 68.3%
30.0% 36.3% 38.7% 37.0% 35.2% 33.7% 35.4% 34.9%
28.9% 31.7%
20.0%
10.0%
0.0%
CHO 1 CHO 2 CHO 3 CHO 4 CHO 5 CHO 6 CHO 7 CHO 8 CHO 9
Male Female
Source: Nursing home Support Scheme (NHSS)
5.3 Average length of stay
The average length of stay measures how long an individual is in the NHSS prior to exiting the Scheme,
for reasons discussed in Section 4.5. Almost two-thirds of NHSS residents stay for longer than a year.
The highest percentage of leavers exit the Scheme after 2 to 4 years. Just 3.5% are resident over 10
years, although it should be noted that these are legacy residents as the Scheme has only been in
place for just under 10 years.
Figure 10 Percentage Distribution of Leavers by Length of Stay 2017
TimeThe length of stay for both male and female clients has increased since 2012 by approximately a month
for each gender. In 2012 the average length of stay for both was 2 years 10 months and has risen to 3
years.
Figure 11 Average length of stay (years) by gender 2012-2018
4.00
3.50
3.46 3.41
3.34 3.34 3.33
3.00
2.50 2.68 2.69 2.65 2.61 2.68
2.00
1.50
1.00
0.50
0.00
2014 2015 2016 2017 2018
Male Female
Source: Department of Health
The average length of stay for a client in the NHSS is just over 3 years. However, 1.6% of total NHSS
population, at end 2018, were clients that entered prior to NHSS being introduced in 2009. They may
have entered residential care at a relatively young age with acquired brain injury or dementia-type
condition. By 2018 those clients who entered long-term residential care prior to the introduction of
NHSS were spending an average of 12 years in the NHSS. This means that the average length of stay
for those who entered since 200923 is less than 3 years. A calculation of Scheme participants, in other
words post 27 October 2009 clients, shows the average length of stay to be 2 and a half years.
5.4 Geographic Profile
3% of the elderly population of Ireland are NHSS funded. CSO data shows that the age profile of
counties on the West coast of Ireland are generally older. Individuals in this elderly cohort are the
main beneficiaries of the NHSS.
23
Legacy is a term used by the HSE that refers to those nursing home residents that pre-date NHSS. Within this cohort
there are: Contract: where prior to NHSS the HSE/Health Boards would have purchased beds in private nursing homes for
residents; Savers: refers to people who were in public and voluntary nursing homes or contract beds in private nursing
homes paying in-patient charges or the equivalent rate prior to the Scheme commencing; and Subvention: referring to
people on the Subvention Scheme and elected to stay on that arrangement when NHSS came in.In a county comparison, Leitrim has the highest percentage of elderly people in their population and the highest uptake of the NHSS from the elderly cohort, second only to Offaly. Leitrim also has the highest percentage of its population in NHSS as a percentage of their total population, followed by Roscommon. Donegal and Kilkenny have the lowest percentage of their elderly population in NHSS. Donegal has the lowest uptake of the NHSS in their elderly population despite a comparatively high percentage of elderly in the county. Just 0.4% of their population, and 2% of their elderly population, is in NHSS despite almost 19% of the population being elderly. Kilkenny, along with Donegal, has the lowest uptake rate of the Scheme at just 2% of their elderly population in NHSS and 0.3% of its population in the NHSS – the lowest of any of the 26 counties. Although less than 0.5% of the under 65 age group of each of the 26 counties are in the NHSS, Kilkenny has the lowest uptake of NHSS in the under 65 age cohort as well as the over 65 years of age group. This highlights that there is potentially a factor which is deterring those in Kilkenny from engaging with this policy and entering the NHSS irrespective of age. This may warrant further analysis in a future evaluation. Elderly population as % of county population Total population in NHSS in each county as % of county population
% of elderly in NHSS as a percentage elderly population   Under 65’s in NHSS as % of under 65 population

Source: CSO Census 2016
https://www.cso.ie/en/media/csoie/newsevents/documents/census2016summaryresultspart1/Census2016SummaryPart1.
pdf

NHSS Monthly Monitoring Reports, Dec 2018.

6. Profile of Assets of clients in NHSS
This section details the average value of assets of NHSS participants. Assets can consist of cash assets,
stocks and shares, land, property or businesses held. These assets are assessed and a percentage of
their value contributes towards an individual’s cost of nursing home care.

A financial assessment is made on admission to the Scheme and this self-reported application is
subject to random audits. Revenue has permission under the NHSS Act (2009) to review applications
with Social Welfare consulted with regards any social welfare allowances a client receives. Total
declared assets for clients in NHSS on 31 December 2018 was €4 billion.

Under Section 27 of the Nursing Homes Support Scheme Act 2009, a Schedule of Assets must be
submitted to the HSE in respect of a deceased person who receives financial support under the
Scheme. This is reviewed to identify and calculate any overpayment of financial support that is
repayable to the HSE pursuant to Section 42 of the Act.
Recent reviews of the Schedules of Assets24, required to be submitted by the estates of clients who
received financial support under Fair Deal, identified €6 million in assets not declared in 2018. Three
quarters of the cash assets not declared were bank accounts. It was not possible to calculate the rate
of non-compliance in assets declared from HSE data provided.
6.1 Cash Assets 25 and Income
The average cash assets of Scheme participants, presented in this analysis, is based on declared assets
prior to the calculation of allowable deductions.
Of the clients in the Scheme at end December 2018, 14% of clients had no cash assets to declare on
application. For those who did declare, the average value of these cash assets is estimated at €64,420.
These cash assets are Gross Value of declared Cash Assets and would be subject to allowable
deductions or asset disregard threshold of €36,000 for a single person prior to contributions being
calculated. 82% of clients were assessed as single in 2018. Therefore an increase in this figure does
not automatically translate into higher client contribution.
Table 2 Cash and Income Assets of NHSS participants
Type of Asset 2018
Average cash assets €64,420
Average weekly declared income (not including €297
cash assets) Single
Average weekly declared income (not including €605
cash assets) Couple
Source: HSE *proxy
Table 2 above shows the average assets of clients in the NHSS in 2018. The table shows average cash
assets, the value of other relevant assets and average weekly income. The average declared income26
on a single person basis per week was €297 in 2018 (before allowable deductions). For applicants
assessed jointly as a couple, this was €605.
The percentage of Scheme applicants that have no declared income other than the State Pension
(Non-Contributory) is not available from the HSE. This level of detail is not easily extracted from the
NHSS IT system and so was not provided.
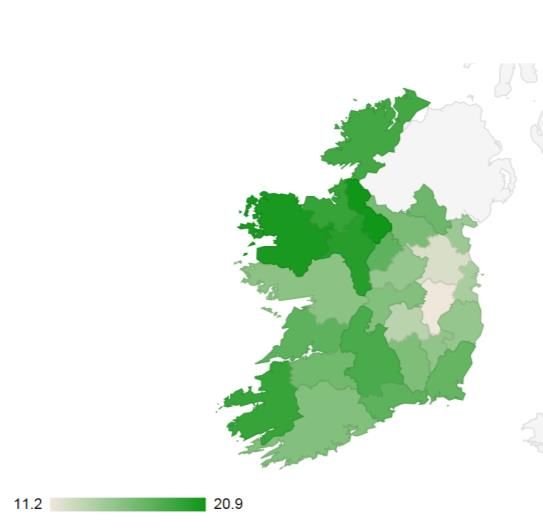
Figure 12 Proportion of Households where State pension was the majority of income by county, 2016
24
The Schedule of Assets Office (SAO) office was set up in 2016.
25
Those in care as of 31st December 2018, regardless of when entered (post 2009). There is no data held for those in
nursing homes prior to 2009 on the NHSS database.
26
Not including cash assetsSource: Central Statistics Office (CSO)
However, CSO data shows that Donegal and Leitrim have the highest proportion of households where
the State Pension is the majority of income. This is in line with earlier findings that these are counties
with a comparatively high elderly population.
6.2 Primary Principal Residence (PPR) Contribution
As with cash assets, the asset valuation for PPR is made at time of application, as per legislation. 11%
of NHSS clients have no cash or other relevant assets, including PPR. The average value per client of
other relevant assets, which includes the principal private residence and other property was €134,589
in 2018 (before allowable deductions or asset disregard).
The total value of PPR along with other property and other relevant assets of those in Scheme at 31
December 2018 was €2.7 billion. 89% or €2.4 billion of this was the total PPR value of participants. We
know that, as of 31 December 2018, 11% of clients had no declared cash or other relevant assets.
However, data that disaggregated the numbers of participants who did not have a PPR was not
provided.
To calculate an estimated average contribution per client of the principal private residence (PPR)
value, this paper looks at average house prices nationally. The average list price for a home nationwide
at end 2018 was €254,000. 7.5% per year for three years (22.5%) is the contribution required to be
made to the Scheme by participants.
Table 3 Average Value of house 2018 and potential client contribution27
Average house Average client Average
price contribution per contribution if
annum (7.5%) in Scheme for 3
yrs+ (22.5%)
27
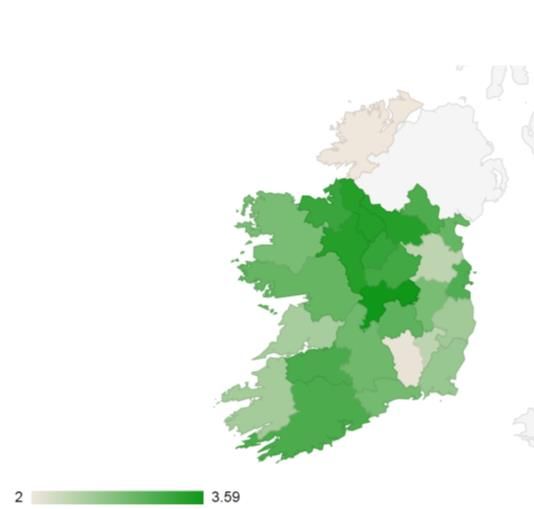
The Daft.ie House Price Report, 2018, Q4. https://www.daft.ie/report/2018-Q4-houseprice-daft-report.pdfNationwide 254,000 19,050 57,150 Dublin/ Wicklow 418,000 31,350 94,050 Roscommon, Sligo, Longford, Leitrim 137,000 10,275 30,825 Source: Daft.ie, HSE The average client contribution per annum is an estimate based on PPR value. However, for a single individual €36,000 would be deducted from the value of the house prior to the contribution being calculated if this deduction has not been made to any other cash or relevant asset. If the participant has no cash or other assets the €36,000 disregard is then taken from the value of the PPR prior to the percentage contribution being calculated. 6.3 Ancillary State Support Scheme (ASS) – Nursing Home Loan The contribution based on land or property may be deferred and collected from the individual’s estate within 12 months of them exiting the Scheme28. In other words, clients can opt to defer the portion of their contribution from their principal private residence. This optional element of the Scheme is legally referred to as Ancillary State Support (ASS). The maps below show that the greatest percentage of those in NHSS opting for the nursing home loan are in areas where the value of that PPR asset is comparatively higher. Percentage of clients in NHSS in receipt of A.S.S. House asking price by county 2018 Source: HSE Source: Daft.ie Reviewing the numbers in receipt of A.S.S. by CHO region, CHO 9, which includes Dublin central, north and North West, had the highest percentage of clients in receipt of this loan option. The next closest 28The 22.5% falls due for repayment following client exiting the NHSS scheme and must be repaid within 12 months from the date of death. If property is sold while client is still alive, the loan must be repaid within 6 months. If it has not been repaid after those time limits, interest applies.
also includes Dublin regions. A 2018 Daft.ie report shows Dublin City, North and South along with
Wicklow as having the most expensive prices to purchase a house at an average of €418,000 over the
four areas. Roscommon, Sligo, Longford and Leitrim had the lowest at €137,000. Donegal not only has
a low uptake of the Scheme but within the cohort in NHSS, it has one of the lowest uptake of the
nursing home loan option.
Revenue is responsible for the collection of funds in relation to ASS. In the interim, the HSE pays the
nursing home on behalf of the client. Revenue recoup the Ancillary State Support contribution from
the estate of the client and it goes directly into the General account upon a client’s departure from
the Scheme. A.S.S. recouped contributions do not get directly fed back into the NHSS itself and do
not contribute to the funding of the Scheme.
There has been an on-going increase in the number of clients in receipt of A.S.S. and the average value
of A.S.S. paid monthly since 2015. The percentage of those in NHSS receiving the nursing home loan,
A.S.S., has increased by 5% since 2014. The 2017 HSE Annual Report records 13.2% of clients in the
NHSS as in receipt of Ancillary State Support; 1.5% above 2016. 2018 saw this rise by a further 1.2% to
14.4%.
6.4 Non-residential Productive Assets 29
A productive asset has the ability to generate cash flow and potentially profit. It is subject to the
financial assessment of the Scheme. Farms are businesses are productive assets. Currently farm and
relevant business owners in the NHSS, who remain in the Scheme for longer than 3 years, contribute
7.5% on the productive asset on an annual basis for the length of their stay.
3% (688) of NHSS clients have a farm asset30. Of that, 36% (248) of them are in the scheme
longer than three years.
0.4% (100) of NHSS clients are relevant business owners with 36% (36) of them remaining
resident in the scheme longer than three years.
The three year capitation on contributions from these assets currently only applies if there is a sudden
adverse event such as the sudden illness of the owner. A Memorandum for Government in June 2019,
the Nursing Home Support Scheme (Amendment) Bill, approved the proposed policy change to the
NHSS to treat farm and relevant business assets in the same manner as the PPR; to cap contributions
towards the cost of care from such productive assets at three years, where a family successor commits
to working the productive asset. Appendix 1 details the potential impact of this policy in further detail.
6.5 Client contributions
29
Appendix A discusses this in further detail
30
Department of Health, 2017.While it is not possible to attribute the origin of client contributions from the type of assets held, the
average weekly client contribution made to the NHSS is available.
The client and State contributions for private nursing homes is consistently higher than public
nursing homes over the analysis period. However, table 4 shows that private contributions grew by
just 0.3% from 2016 to 2018 while the gross weekly average cost of a bed rose by 4%. In the same
period the public client contribution rose by 10%, 1% higher than the growth in the gross weekly
average cost of a public bed.
Contributions by NHSS clients in a private nursing home have fallen from 32% of the total cost of care
in 2016 to 30% in 2018. Despite this client contributions to private nursing homes have remained
higher than the contributions of those in a public nursing home which have remained at 18% of the
total cost of care since 2016, as weekly contributions rose along with the weekly cost of a bed.
Table 4 Client and State weekly Contributions, public and private nursing home beds per week
2016 2017 2018 Variance 2016-2018
Private Client Contribution 299 291 300 0.3%
State Contribution to private 647 666 684 6%
nursing home
Gross weekly average cost of 946 957 984 4%
private bed
Public Client Contribution 260 276 286 10%
State Contribution to public 1,186 1,236 1,289 9%
nursing home
Gross weekly average cost of 1,446 1,512 1,575 9%
public bed
Source: NHSS monthly monitoring reports
The average net cost of care (State contribution) in a private or voluntary nursing home at end 2018
was €684 per week; 70% of total cost of care. The average net cost of care (State contribution) in a
public nursing home was €1,289 per week in 2018; 82% of the cost of care.
6.6 The Vacant Residential property debate and NHSS
According to Census data, on a national level, 2.3% of vacant homes are related to people residing
in Nursing Homes. The majority of these are in cities other than Dublin. Just 3% of vacant homes in
Dublin city and suburbs are vacant due to an owner being in a Nursing Home.The data suggests that rural areas suffer from a comparatively larger share of long-term vacancies
than urban areas. Of the vacancies due to nursing homes, 54% are in rural areas or small towns,
not rent pressure zones. 31% are in cities and suburbs, potential rent pressure zones.
Table 5 Vacant homes by location
Reason for vacancy Dublin Other Large Small Rural Total
City & cities towns towns
suburbs
Nursing Home 865 409 625 428 1,838 4,165
Total vacant homes 28,188 14,233 25,475 27,700 87,716 183,312
Nursing homes as a 3.0% 2.8% 2.5% 1.5% 2.1% 2.3%
percentage of all
vacant homes
Source: Central Statistics Office (CSO), 2016 https://www.cso.ie/en/releasesandpublications/ep/p-cp1hii/cp1hii/vac/
Other potential vacancies which may be commonly associated with the elderly are those ‘in hospital’
which accounted for less than 1% of home vacancies, ‘with relatives’ 0.5% and ‘deceased’ 5% of
home vacancies nationally.
The Governments National Vacant Housing Reuse Strategy, 2018-2021 outlines a plan for cross-
departmental engagement, examining measures to address vacant homes when an owner moves
into the NHSS. It further states that it will explore possible taxation measures and review Local
Authority legislation to bring such vacant properties back into use.
7. Key findings, conclusions and future analytical work
This section discusses the findings of the SIA and next steps. Overall there is good data available on
the NHSS, partly due to it being in place for just a decade. However, the data system is set up in a
manner to calculate payments. It is not established for statistics and so can have reporting issues.
Although the analysis found that some counties are engaged in the Scheme more than others, there
does appear to be similarities across counties in terms of age, gender and average length of stay.
In terms of the profile of recipients this paper has the following findings;
o Programme recipients are generally in the elderly population, more specifically in the 85
year old plus age category.
o The gender balance of those in NHSS is 2:1 female to male.
o The counties with the highest percentage of their elderly population in the NHSS are Leitrim
and Roscommon.o Kilkenny has a low uptake of the scheme at all ages which may warrant further investigation.
The characteristic NHSS beneficiary
Referred from the Acute hospital setting
Applying for both State Support along with ASS
Waiting under 4 weeks for funding approval;
Is a female over 80 years of age
Staying 2-4 years in the Scheme
NHSS is a policy set out to allow any individual to access long-term nursing home care regardless of
income in a setting most appropriate to their needs. It aims to make care in public, private and
voluntary settings accessible for all and provide affordable access to long-term care based on means.
Budgetary expenditure for NHSS has increased in line with an increase in numbers and applications.
The introduction of NHSS has proven to be successful and despite a growing elderly population, no
large spikes in demand have materialised. The Scheme has proven to be financially sustainable,
which is of key importance for the functioning of the Scheme going forward.
In addition to those accessing the State support, there’s an increase in those applying for the Nursing
Home Loan. Increasing the contribution of assets held from 5-7% per annum for three years in 2015
does not appear to have deterred participation in this element of the Scheme. And the three year
cap is in line with the average length of stay. It appears that A.S.S. uptake is increasing as house
prices increase; potentially because owners do not have the percentage contribution of high valued
principal private residence to hand as the contribution required from the asset is higher than their
current liquid assets.
Contributions made from the value of housing assets held by clients entering the Scheme are a key
driver of the sustainability of the NHSS. With an increasing elderly population, any fall-off in
residential owner-occupier numbers has the potential to warrant a review of contribution
calculations. Only 1 in 3 private sector workers have pension coverage which could also change the
contributions of participants to the Scheme significantly going forward. However, the introduction of
auto-enrolment by 2022 may minimise this risk.
8. Appendix A Farms and Small Business – non-residential productive assets
Table 1 below shows that 30% of farm holders in Ireland are elderly (over 65). With 137,500 farms,
that’s 41,250 elderly owned farms. Using the Census figure of 4% of over 65’s are in nursing homes,
we get a proxy of 1,650 farm holders are in nursing home care.Table 1 Age of farm holders 2010, 2013, 2016
Age 2010 2013 2016 % of farm
holders in each
age bracket
(2016) State funding to additional farms and small business owners who decide to enter the scheme
under its new terms.
3% (688) of NHSS clients have a farm asset32. Of that, 36% (248) of them are in the scheme longer than
three years. 0.4% (100) of NHSS clients are small business owners with 36% (36) of them remaining
resident in the scheme longer than three years. Combined, this proposed policy change affects just
284 clients currently in the NHSS longer than 3 years with a productive asset.
New clients may be attracted into the scheme if farm and small business clients’ claims capped at 3
years. These new clients can come from wholly privately paid nursing homes switching into the NHSS
or from those not currently in care who are incentivised to enter.
The Department of Health and HSE forecast that this extension to the capitation will cost the State on
average €3.3m on annual basis from 2022 onwards.
Given that the average length of stay in the scheme is 3 years and has remained relatively consistent,
it would appear that only a small proportion of clients would be impacted by the proposed change.
The 3 million cost is nominal in comparison to the almost €1 billion budget allocation. However the
average length of stay is lower than this figure suggests if we take into account the legacy scheme
clients who may be skewing this figure. Their period in care is on average 9 years or higher.
As the effective average length of stay is less than 3 years, the majority of clients would not be getting
to the stage where they would enter the capitation stage where their productive asset would not be
accounted for in a financial contribution manner.
It is important that this policy uptake is monitored and measures are introduced to ensure it meets its
objective and doesn’t undermine the sustainability of the Scheme.
32
2017 figures (Department of Health)Quality Assurance Process
To ensure accuracy and methodological rigour, the author engaged in the
following quality assurance process.
Internal/Departmental
Line management
Spending Review Sub-group and Steering group
Other divisions/sections – Central Votes Section and the
Public Service Reform and Delivery Office.
Peer review (IGEES network, seminars, conferences etc.)
External
Other Government Department
External expert(s)You can also read