Carbon management for savannah ecosystems in Central Africa: a case study from Cameroon
←
→
Page content transcription
If your browser does not render page correctly, please read the page content below
Carbon management for savannah
                  ecosystems in Central Africa: a case study
                  from Cameroon
                   ..............................................................................................................................................................

                                                                                                                                                                                    Downloaded from https://academic.oup.com/ijlct/advance-article/doi/10.1093/ijlct/ctab050/6310596 by guest on 07 October 2021
                                   Djongmo Victor Awé1 , Noumi Valery Noiha1,2 and Louis Zapfack3
                                   1
                                     Department of Biological Sciences, Faculty of Science, University of Ngaoundere, P.O. Box
                                   454, Ngaoundere, Cameroon; 2 Higher Teacher Training College of Bertoua, Department of
                                   Life Science, University of Ngaoundere, P.O. Box 652, Bertoua, Cameroon; 3 Department of
                                   Biology and Plant Physiology, Faculty of Sciences, University of Yaoundé I. P.O. Box 812,
                                   Yaoundé, Cameroon
                                   .............................................................................................................................................
                                   Abstract
                                   The overall objective of this work is to assess the carbon sequestration potential and ecological service of
                                   savannah ecosystems in Cameroon. The destructive and non-destructive method was used to estimate the
                                   amount of carbon in different biomasses. The experimental setup used in this work is a random complete
                                   Fisher block device with four repetitions. The carbon stock in the aboveground biomass is ≥11.15 ± 2.41
                                   tC/ha in the two regions. The carbon stock in litter biomass is ≥0.15 ± 0.02 tC/ha in the two regions.
                                   The carbon stock in herbaceous biomass is ≥3.00 ± 1.02 tC/ha in the savannah ecosystems within the
                                   regions. The carbon stock in dead wood biomass is ≥2.26 ± 1.09 tC/ha in the savannah ecosystems within
                                   regions. The carbon stock in the root biomass is ≥1.62 ± 0.18 tC/ha in the savannah ecosystems within the
                                   regions. Soil carbon stock is ≥3.74 ± 1.40 tC/ha in the two regions. The total carbon stocks ranged from
                                   32.66 ± 3.05–71.06 ± 5.75 to 36.59 ± 3.50–69.85 ± 5.51 tC/ha in Adamawa and North regions, respectively.
                                   CO2 emissions are >100 tCO2 /ha in the savannah ecosystems within the regions. These results therefore
                                   confirm the contributing role of savannah ecosystems studied in the fight against the mitigation of climate
                                   change in the Adamawa and North region of Cameroon.

                                   Keywords: biomass; cameroon; carbon sink; savannah ecosystems; REDD+
*Corresponding author:
awevictor20@yahoo.fr               Received 22 April 2021; revised 24 May 2021; editorial decision 26 May 2021; accepted 26 May 2021
.................................................................................................................................................................................

1. INTRODUCTION                                                                           resources) and a demand (needs of all kinds) that follows the
                                                                                          population growth rate [1].
As the problems of desertification and environmental degradation                             Climate change is now recognized as a major threat to the
are far from being solved in the northern regions of Cameroon,                            achievement of poverty reduction goals in many African countries
the rational management of natural resources in general and forest                        as well as to the achievement of the Millennium Development
resources in particular remains a concern of the Cameroonian                              Goals (MDGs) [3, 4]. In general, climate change affects the human
State [1]. The “””FAO report on the assessment of Cameroon’s for-                         environment, affecting the livelihoods of many and the incomes
est resources indicates that for the period 1990–2010, Cameroon                           of nations [3]. Forests are the largest ecosystem that significantly
lost an average of 220,000 ha per year, which corresponds to ∼1%                          affects the global climate while at the same time being under its
of forest cover, one of the highest deforestation rates in the Congo                      influence [4].
Basin [2]. Thus, these processes of desertification and climate                              Forests also play a key role in climate change adaptation, for
change in the northern part of Cameroon are largely due to                                example, by increasing the resilience of rural communities and
uncontrolled agropastoral activities on the one hand and the use                          supporting the adaptation of species to changing climate and
of wood as the main source of domestic energy by the population                           abrupt weather events, providing refuges and migration corridors
on the other [1]. One of the crucial problems to be faced is                              for wildlife [5]. In addition, they indirectly support economies
the observed imbalance between a diminished supply (available                             to adapt to climate change by reducing the costs of negative

International Journal of Low-Carbon Technologies 2021, 00, 1–9
© The Author(s) 2021. Published by Oxford University Press.
This is an Open Access article distributed under the terms of the Creative Commons Attribution License (http://creativecommons.org/licenses/by/4.0/), which
permits unrestricted reuse, distribution, and reproduction in any medium, provided the original work is properly cited.
https://doi.org/10.1093/ijlct/ctab050                                                                                                                     1
Awé et al.
Downloaded from https://academic.oup.com/ijlct/advance-article/doi/10.1093/ijlct/ctab050/6310596 by guest on 07 October 2021
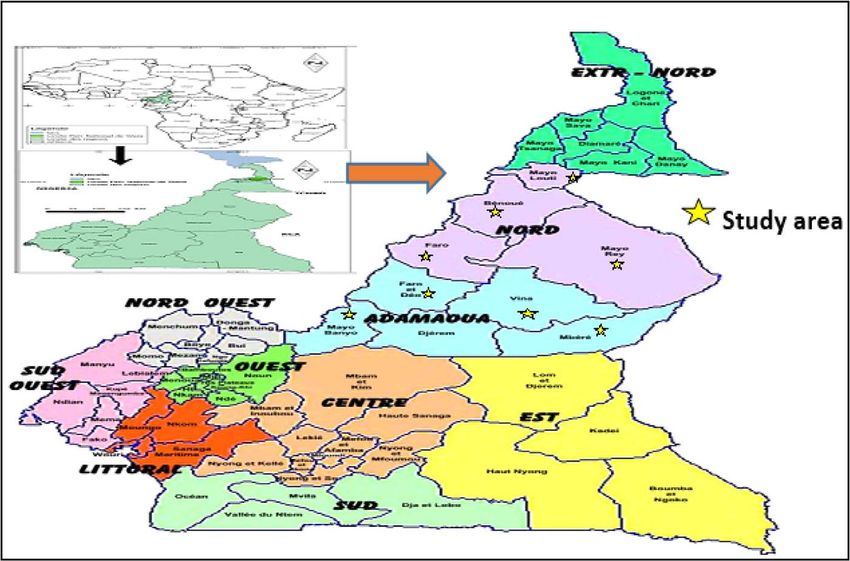
Figure 1. Geographic location of the study area.
climate-related impacts [6]. These savannah ecosystems also pro- Grassy savannah and Arborescent savannah). The experimen-
vide goods and services during extreme events and are major tal device installed is a block of randomized complete Fisher’s
assets in reducing vulnerability to the effects of climate change [7, with four replicates. The two regions (Adamawa and North) are
8]. Thus, the role of forests in regulating the water cycle should considered as primary treatments; the four savannah ecosystems
not be underestimated. In terms of mitigation, they have consid- selected in each region are considered as secondary treatments
erable potential for carbon sequestration through afforestation, and the four plots of 80 × 25 m as replicates.
reforestation, forest restoration and changes in forest management
practices [9–11]. Also included in forest mitigation measures is
the efficient use of forest products. Hence, the interest of this work 2.3. Data collection
is to provide quantitative data on their carbon potential in order to Transects 80-m long and 25-m wide were installed at each site,
better understand their contributory role in mitigating the adverse and each transect is spaced 10 m apart. A total of 4 transects was
effects of global warming in the Adamawa and North regions of installed for a total sampling area of 1 ha per site. Sampling strips
Cameroon. were established using compass, tape measure, GPS and twine.
At the ends of each strip, the stakes were planted equidistantly
20 m apart. Along the transects, all wooded trees in dbh ≥ 10 cm
were surveyed. For the calculation of the vegetation structure two
2. MATERIAL AND METHODS parameters were taken into account: the density of the wooded
plants and the basal area. Since the density of wooded plants, we
2.1. Study area applied the formula D = n/S where D is the density (in trees/ha),
The study took place in two agro-ecological zones of Cameroon: n is the number of trees present on the surface considered and S
Sudano-Guinean zone (Adamawa region) and Sudano-Sahelian is the surface considered (ha). For the basal area, we applied the
zone (North region). The Adamawa region lies between latitude formula S = π (Di2 /4) where S is the basal area (m2 /ha) and Di is
6◦ and 8◦ North and longitude 11◦ and 16◦ East with an area of the diameter (m).
63701 km2 [12]. The North region is located between latitude 9◦
18 ‘North and longitude 13◦ 23’ East with an area of 68 090 km2 [8]
(Figure 1). In each region four subdivisions have been selected. 2.3.1. Aboveground biomass
Data from the floristic inventory were used to estimate above-
ground biomass. The allometric equation developed by [13] was
2.2. Site selection criteria and experimental design used for biomass estimation. The equation is as follows:
The choice of study station was based on availability, area, density
of individuals, topography and geomorphology. Four savannah
AGB = ρexp[−0.667 + 1.784] In (D) + 0.207 In(D − 0.0281 In (D3 )]
2)
ecosystems were selected (Wooded savannah, Shrubby savannah,
2 International Journal of Low-Carbon Technologies 2021, 00, 1–9Carbon management for savannah ecosystems in Central Africa
In this formula, AGB is the aboveground biomass (kg), D is the of dead standing wood wascalculated using the formula used by
diameter at breast high (cm) and ρ is the specific wood density. [18]:V = π ∗ h ∗ f ∗ Dbh 2 where V is the volume of standing
2
From this biomass, the amount of carbon (tC/ha) is obtained by −1
dead wood (m .ha ), Dbh is the diameter breast height (m), h is
3
multiplying this biomass by a conversion factor of 0.475 [10, 12,
the height of standing dead wood (m) and f is the shape factor
14]; it is then converted into tons of carbon per ha.
(0.627). The transition from dry mass to carbon stock is made by
the following relation: carbon stock in dead wood = quantity of
2.3.2. Herbaceous and litter biomass dry matter (DM) × 0.5 [19].
The conventional clear cutting method was used for the quantifi-
cation of herbaceous biomass. On each elementary plot (2000 m2 ),
Downloaded from https://academic.oup.com/ijlct/advance-article/doi/10.1093/ijlct/ctab050/6310596 by guest on 07 October 2021
05 frames of 1 × 1 m were installed for the collection of herba- 2.3.4. Soil and root biomass
ceous plants using pruning shears. A total of 5 samples were taken In each 2000 m2 survey, soil samples were taken in 0.25 × 0.25 m
per 80 × 25 m sounding unit, which corresponds to a total of 20 frames. These samples are taken at 0–10 cm, 10–20 cm and 20–
samples per stand. A total of 160 samples (4 sites × 5 samples × 4 30 cm depth on the four elementary plots. Each level of soil depth
replicates × 2 areas) were collected for all 4 savannah ecosystems was sampled using a machete and trowel and then immediately
in the two regions studied. put in a closed bag in a cooler, in the shade to avoid evaporation. A
For the estimation of carbon stock in litter biomass, about 20 total of 3 samples were taken per drilling unit, which corresponds
square quadrats of 0.5 × 0.5 m2 each, spaced 20 m apart, were to a total of 12 samples per site and then homogenized to obtain
randomly installed within each site using the transect method. A an aggregate sample. A total of 96 samples (4 sites × 3 depths × 4
total of 5 samples were collected per 80 × 25 m sounding unit, replicates × 2 areas) for all 4 sites in the 2 regions studied were
which corresponds to a total of 20 samples per site. A total of dug into the soil to a depth of 30 cm. The roots were then manually
160 samples (4 sites × 5 samples × 4 replicates × 2 areas) were sorted and separated into three classes according to their diameter
collected for all four savannah ecosystems in the two regions stud- [20]: fine roots (x < 1 mm), medium roots (1 ≤ × < 5 mm) and
ied. For the determination of the moisture content, the samples large roots (x > 5 mm). These three groups were then weighed
are quickly returned to the laboratory where they are reweighed, and oven dried at a constant temperature of 70◦ C to a constant
dried at 65◦ C to constant weight and then reweighed. Samples dry weight, which was measured. When the weight became con-
of litter and herbaceous plants dried in an oven at 65◦ C for stant, it was deduced that all the water contained in the material
72 hours to constant weight and then reweighed and ground for had completely evaporated and the resulting mass was that of
the determination of organic carbon by the calcinations method. the biomass. A total of 288 samples (4 sites × 3 depths × 3
The carbon was determined by incineration in an oven at 525◦ C, diameters × 4 replicates × 2 areas) were collected from all four
after oven drying at 105◦ C for 48 hours. The percentage of dry sites in the two regions studied.
matter of herbaceous vegetation was determined according to NF Soil organic carbon was determined by Walkley and Black
ISO 11464 [15] using the following formula: MS = (PSE/PHE) ∗ method [21], which is an oxidation method with potassium bicar-
100 where MS is the percentage of dry matter (%), PSE is the dry bonate (K2 Cr2 O7 ) in an acidic medium (H2 SO4 ) according to
weight of the sample after 3 days in the oven at 65 ◦ C (g), PHE is NF ISO 14235 [22]. The determination was made by calorime-
the wet weight of the sample in the field (g) and the biomass using try. The organic matter content was obtained by multiplying the
the equation B = (PHT∗MS)/100 [11] where B is the biomass (g), organic carbon rate by the Sprengel factor, which is 1.724 for cul-
PHT is the total field wet weight (g) and MS is the percent dry tivated soils and 2 for uncultivated soils. Soil carbon (SCOS) = %
matter (%). The average herbaceous biomass was then converted TCO × Da × P [20; 23] where Da is the bulk density in tones/m3 ,
to tones per hectare. % TCO is the organic carbon content of the soil and p is the
depth m. The bulk density was determined by sampling a defined
volume of soil using a cylinder driven into the soil. After drying
2.3.3. Dead wood biomass the sample in an oven at 105◦ C for 48 hours according to NF ISO
On each elementary plot (2000 m2 ), 20 × 10 m strips have been 11464 [15], it was weighed again. The dry weight of the sample
installed for the collection of dead wood. In these strips, only P divided by the volume of the sample (V) gave the bulk density
the dead wood inside was measured. Unmarked dead wood from (Da) in g/cm3 . It is calculated using the formula Da = P/V.
outside the plot that fell inside the plot was not measured, while
unmarked dead wood from inside the plot that fell outside the
plot was measured. The following equation was used to calculate
2.3.5. Total carbon
of dead wood accumulated on the ground: V =
the volume
The total carbon stock was obtained by summing all assessed
π2 x di2
8L [16] where V is the volume of dead wood (m3 .ha−1 ), stocks: SCT = AGC + BGC + LC + HC + DWC + SOCS
Di is the diameter of each sampled tree debris (m) and L is the where SCT is the total carbon stock (tC/ha), AGC is the carbon
length of transect (m) = 80 m in the case of this study. The in aboveground biomass (tC/ha), BGC is the carbon in roots
formula for dead wood biomass is (t/ha) = volume × densities. biomass (tC/ha), LC is the carbon in litter biomass (tC/ha), HC is
The density of the wood used is 0.48 KgMS.m−3 [17]. The volume th carbon in herbaceous biomass (tC/ha), DWC is the carbon in
International Journal of Low-Carbon Technologies 2021, 00, 1–9 3Awé et al.
Table 1. Density within savannah ecosystems.
Regions Subdivisions Wooded savannah Shrubby savannah Grassy savannah Arborescent savannah
Adamawa Faro et Deo 320 ± 8.76c 210 ± 5.95c 48 ± 4.05c 180 ± 3.10a
(63,701 km2 ) Mayo Banyo 290 ± 6.89b 120 ± 2.90a 10 ± 0.76a 171 ± 3.05a
Mbere 150 ± 4.88a 150 ± 4.74b 28 ± 1.21b 173 ± 3.08a
Vina 450 ± 10.28d 350 ± 7.90d 82 ± 5.83d 192 ± 3.14a
Mean 302.5 ± 7.67A 207.5 ± 5.37A 42 ± 2.96A 179 ± 3.09A
North (68,090 km2 ) Benoue 314 ± 8.67c 206 ± 5.90c 50 ± 4.08c 190 ± 3.13a
Faro 270 ± 6.77b 129 ± 2.94a 12 ± 0.82a 181 ± 3.11a
Mayo Loutii 170 ± 4.96a 146 ± 4.43b 24 ± 1.29b 173 ± 3.08a
Downloaded from https://academic.oup.com/ijlct/advance-article/doi/10.1093/ijlct/ctab050/6310596 by guest on 07 October 2021
Mayo Rey 440 ± 10.08d 347 ± 7.87d 84 ± 5.90d 170 ± 3.05a
Mean 298.5 ± 7.62A 207 ± 5.28A 42.5 ± 3.02A 178.5 ± 3.09A
In each column, the values assigned the same letter are not statistically different (P > 0.05; Duncan test).
Table 2. Basal area within savannah ecosystems.
Regions Subdivisions Wooded savannah Shrubby savannah Grassy savannah Arborescent savannah
Adamawa Faro et Deo 13.54 ± 2.76a 10.05 ± 2.65a 1.88 ± 0.95a 10.90 ± 2.98a
(63,701 km2 ) Mayo Banyo 13.89 ± 2.89a 12.18 ± 3.90a 4.20 ± 2.76ab 11.51 ± 2.05a
Mbere 14.33 ± 3.98ab 15.23 ± 5.74a 3.11 ± 2.01b 13.53 ± 3.78a
Vina 18.50 ± 5.08b 10.54 ± 2.90a 1.24 ± 0.83a 10.00 ± 1.89a
Mean 15.06 ± 5.03A 12.48 ± 2.49A 2.60 ± 1.63A 11.49 ± 3.01A
North (68,090 km2 ) Benoue 14.78 ± 2.87a 13.65 ± 4.63a 1.94 ± 1.01a 10.02 ± 2.02a
Faro 17.40 ± 4.17a 12.39 ± 2.04a 2.70 ± 2.02a 10.21 ± 2.04a
Mayo Loutii 17.20 ± 4.76a 13.76 ± 3.43a 3.26 ± 2.09 13.54 ± 2.32a
Mayo Rey 15.50 ± 3.06a 12.64 ± 2.87a 1.54 ± 0.54a 12.20 ± 3.72a
Mean 15.89 ± 5.12A 13.11 ± 2.31A 2.36 ± 1.41A 11.49 ± 2.22A
In each column, the values assigned the same letter are not statistically different (P > 0.05; Duncan test).
dead wood biomass (tC/ha) and SOCS is the soil organic carbon (Table 1). Between the two regions, the wooded savannahs have
stock (tC/ha). the densities of the highest species (Table 1). The difference in
density between the ecosystems studied could be related to the
ecological characteristics of the study environments, including
2.3.6. Ecological services soil types, topography, climate and cover [20]. Our found results
The total carbon stock evaluated in tC/ha was converted to are contained within the 35–493 individuals/ha per ha found by
the equivalent amount of CO2 absorbed using the 44/12 ratio [25] in savannah agrosystems of Burkina-Faso.
corresponding to the CO2 /C ratio [24]. The determination Between the subdivisions, the wooded savannah of the Vina
of the ecological value was based on the following formula: has the largest basal area (18.50 ± 5.08 m2 /ha) (Table 2). Between
TéqCO2 = SCT × FCC where SCT is the total carbon stock and the two regions, the wooded savannahs have the largest basal
FCC is the conversion factor of carbon to CO2 equivalent = 44/12 areas (Table 2). The highest values of basal area are justified by
[10; 14]. the existence of trees with large diameters in this site. Among
the species in its undergrowth, some have a high shade rate. This
2.3.7. Data analysis could explain the high proportion of species that can provide
The data were encoded in EXCEL software and then analyzed shade in all seasons [26]. This result is higher than those of [27]
using STATGRAPHICS plus 5.0 and R software. Analysis of vari- in the savannah of Ngaoundéré (3.55 ± 0.007 m2 /ha), [10] in the
ance (ANOVA) was used to test the existence or not of a significant savannah of North Cameroon (5.81 ± 0.03 m2 /ha) but remains
difference in the difference parameters. Duncan’s 5% test was used lower than those of [24] in the savannah of Adamawa-Cameroon
to compare parameter means. (36.04 ± 0.00 m2 /ha).
3.2. Carbon stock in aboveground biomass
3. RESULTS AND DISCUSSION Between regions and subdivisions, the carbon stock in the above-
ground biomass is greater than or equal to 10 tC/ha (Table 3). It is
3.1. Density and basal area higher in the wooded savannah of Vina subdivisions with a value
Between the subdivisions, the wooded savannahs of the Vina of 28.50 ± 5.08 tC/ha (Table 3). The results obtained from the
have the highest density of species (450 ± 10.28 individuals/ha) carbon stocks in aboveground biomass in this study are contained
4 International Journal of Low-Carbon Technologies 2021, 00, 1–9Carbon management for savannah ecosystems in Central Africa
Table 3. Carbon stock in aboveground biomass.
Regions Subdivisions Wooded savannah Shrubby savannah Grassy savannah Arborescent savannah
Adamawa Faro et Deo 23.54 ± 2.76a 20.05 ± 2.65a 9.08 ± 2.05a 20.90 ± 2.98a
(63,701 km2 ) Mayo Banyo 23.89 ± 2.89a 22.18 ± 3.90a 15.20 ± 2.96a 21.51 ± 2.05a
Mbere 24.33 ± 3.98ab 25.23 ± 5.74a 12.11 ± 2.81a 23.53 ± 3.78a
Vina 28.50 ± 5.08b 20.54 ± 2.90a 8.24 ± 1.83a 20.03 ± 1.89a
Mean 25.06 ± 3.86A 22.48 ± 3.09A 11.15 ± 2.41A 21.49 ± 2.88A
North Benoue 24.78 ± 2.87a 23.65 ± 4.63a 8.84 ± 1.88a 20.00 ± 2.02a
(68,090 km2 ) Faro 27.40 ± 4.17a 22.39 ± 2.04a 11.70 ± 2.72a 20.21 ± 2.04a
Mayo Loutii 27.20 ± 4.76a 23.76 ± 3.43a 13.26 ± 2.89a 23.54 ± 2.32a
Downloaded from https://academic.oup.com/ijlct/advance-article/doi/10.1093/ijlct/ctab050/6310596 by guest on 07 October 2021
Mayo Rey 25.50 ± 3.06a 22.64 ± 2.87a 7.54 ± 1.54a 22.20 ± 3.72a
Mean 25.89 ± 4.58A 23.11 ± 3.32A 10.46 ± 2.25A 22.49 ± 2.16A
In each column, the values assigned the same letter are not statistically different (P > 0.05; Duncan test).
Table 4. Carbon stock in litter biomass.
Regions Subdivisions Wooded savannah Shrubby savannah Grassy savannah Arborescent savannah
Adamawa Faro et Deo 2.54 ± 0.76a 2.05 ± 0.65a 0.08 ± 0.00a 2.90 ± 0.98a
(63,701 km2 ) Mayo Banyo 2.89 ± 0.89a 2.18 ± 0.90a 0.20 ± 0.03a 2.51 ± 0.75a
Mbere 2.33 ± 0.58ab 2.23 ± 0.74a 0.11 ± 0.01a 2.53 ± 0.78a
Vina 2.50 ± 0.68b 2.54 ± 0.90a 0.24 ± 0.04a 2.00 ± 0.59a
Mean 2.56 ± 0.78A 2.15 ± 0.58A 0.15 ± 0.02A 2.49 ± 0.68A
North Benoue 2.78 ± 0.87a 2.65 ± 0.63a 0.34 ± 0.08a 2.02 ± 0.32a
(68,090 km2 ) Faro 2.40 ± 0.67a 2.39 ± 0.44a 0.70 ± 0.12a 2.21 ± 0.34a
Mayo Loutii 2.20 ± 0.76a 2.76 ± 0.49a 0.26 ± 0.06a 2.54 ± 0.58a
Mayo Rey 2.50 ± 0.86a 2.64 ± 0.57a 0.54 ± 0.11a 2.20 ± 0.32a
Mean 2.56 ± 0.77A 2.61 ± 0.67A 0.46 ± 0.09A 2.24 ± 0.55A
In each column, the values assigned the same letter are not statistically different (P > 0.05; Duncan test).
in the range 16.22 ± 0.56–45.03 ± 1.22 tC/ha found by [6] in the order of 2.6–3.8 tC/ha reported by [32] in the tropical forests
different vegetation types in Ngaoundéré (Adamawa-Cameroon). of Asia.
The highest values of carbon stock of the aboveground biomass
are observed in the wooded savannah of Vina subdivisions are
inferior to those of [6] in shrubby savannah (40.89 ± 1.09 tC/ha) 3.4. Carbon stock in herbaceous biomass
and wooded savannah (45.03 ± 1.22 tC/ha) of Ngaoundéré. It can Between regions and subdivisions, the carbon stock in the herba-
then be noted that the most significant differences between the ceous biomass is greater than or equal to 3.00 ± 1.02 tC/ha
carbon stocks of the different environments could lie in the size of (Table 5). It is higher in the grassy savannahs of Mayo-Loutii
their land surface, diameter at breast height (Dbh) and the sam- subdivisions with a value of 7.26 ± 3.09 tC/ha (Table 5). The
pling methodology and the type of allometric equation[27;28]. highest values of the carbon stock in herbaceous biomass are
observed in the grassy savannahs of Mayo-Loutii subdivisions, it
is explained by the fact that the closure of large trees negatively
influences the carbon stock in the herbaceous stratum. This result
3.3. Carbon stock in litter biomass is higher than those of [33] who found 0.30 tC/ha (herbaceous) in
Between regions and subdivisions, the carbon stock in the litter the wooded savannah of the Sudano-Guinean zone (Ngaoundéré-
biomass is greater than or equal to 0.08 ± 0.00 tC/ha (Table 4). It is Camroun). On the other hand, it is close to those of [33] who
higher in the arborescent savannah of Faro and Deo subdivisions found 3.15 tC/ha (herbaceous) in the shrubby savannah of the
with a value of 2.90 ± 0.98 tC/ha (Table 4).These results, except Sudano-Guinean zone (Ngaoundéré-Cameroon).
for the results obtained in grassy savannahs, are close to those
obtained by [29], which estimates the carbon content of dead
organic matter (litter) at 2.8 tC/ha and that this can vary between
2 and 3 tC/ha. These results, except the results obtained in grassy 3.5. Carbon stock in dead wood biomass
savannahs, are between 0.16–3.26 tC/ha obtained by [30] in India Between regions and subdivisions, the carbon stock in dead wood
and 2.1–3.2 tC/ha obtained by [31] in Costa Rica. The highest biomass is greater than or equal to 2.26 ± 1.09 tC/ha (Table 6).
values of carbon stock in litter biomass are observed in the It is higher in the arborescent savannahs of Mbere subdivisions
arborescent savannah of the Faro and Deo subdivisions are also of with a value of 13.73 ± 3.78 tC/ha (Table 6). These results are
International Journal of Low-Carbon Technologies 2021, 00, 1–9 5Awé et al.
Table 5. Carbon stock in herbaceous biomass.
Regions Subdivisions Wooded savannah Shrubby savannah Grassy savannah Arborescent savannah
Adamawa Faro et Deo 3.44 ± 1.06a 3.85 ± 1.15a 5.98 ± 2.15ab 3.50 ± 1.08a
(63,701 km2 ) Mayo Banyo 3.33 ± 1.09a 3.58 ± 1.10a 4.70 ± 1.06a 3.91 ± 1.05a
Mbere 3.89 ± 1.18ab 3.53 ± 1.04a 5.81 ± 2.10ab 3.73 ± 1.08a
Vina 3.48 ± 1.08b 3.34 ± 1.02a 4.64 ± 1.03a 3.93 ± 1.09a
Mean 3.53 ± 1.43A 3.65 ± 1.60A 5.28 ± 1.76A 3.76 ± 1.72A
North Benoue 3.78 ± 1.37a 3.65 ± 1.25a 4.34 ± 1.08a 3.00 ± 1.02a
(68,090 km2 ) Faro 3.40 ± 1.17a 3.39 ± 1.04a 5.70 ± 2.08ab 3.21 ± 1.04a
Mayo Loutii 3.20 ± 1.06a 3.76 ± 1.23a 7.26 ± 3.09bc 3.54 ± 1.32a
Downloaded from https://academic.oup.com/ijlct/advance-article/doi/10.1093/ijlct/ctab050/6310596 by guest on 07 October 2021
Mayo Rey 3.50 ± 1.36a 3.64 ± 1.27a 4.54 ± 1.24a 3.20 ± 1.02a
Mean 3.56 ± 1.45A 3.61 ± 1.54A 5.46 ± 1.87A 3.24 ± 1.34A
In each column, the values assigned the same letter are not statistically different (P > 0.05; Duncan test).
Table 6. Carbon stock in dead wood biomass.
Regions Subdivisions Wooded savannah Shrubby savannah Grassy savannah Arborescent savannah
Adamawa Faro et Deo 8.44 ± 2.76a 7.85 ± 2.65a 2.98 ± 1.05a 7.50 ± 2.98a
(63,701 km2 ) Mayo Banyo 5.33 ± 2.89a 10.58 ± 3.90a 3.70 ± 1.76a 5.91 ± 2.05a
Mbere 7.89 ± 3.98ab 6.53 ± 5.74a 2.81 ± 1.21a 13.73 ± 3.78b
Vina 9.48 ± 5.08b 6.34 ± 2.90a 3.64 ± 1.83a 5.93 ± 1.89a
Mean 8.53 ± 3.43B 8.32 ± 4.48A 3.28 ± 1.46A 8.51 ± 3.21A
North Benoue 6.78 ± 2.87a 11.65 ± 4.63a 2.34 ± 1.08a 12.02 ± 2.12a
(68,090 km2 ) Faro 8.40 ± 4.17a 5.39 ± 1.04a 3.70 ± 1.76a 8.21 ± 2.04a
Mayo Loutii 8.20 ± 4.76a 5.76 ± 3.43a 2.26 ± 1.09a 5.54 ± 1.32a
Mayo Rey 5.50 ± 3.06a 8.64 ± 2.87a 4.00 ± 1.94a 9.20 ± 3.72a
Mean 7.22 ± 3.18A 7.36 ± 4.16A 3.07 ± 1.46A 9.24 ± 3.21A
In each column, the values assigned the same letter are not statistically different (P > 0.05; Duncan test).
in the range 0.65 ± 0.10–14.24 ± 3.12 tC/ha reported by [20] 3.7. Soil carbon stock
in the savannah of northern Cameroon and in the range 0.003– Between regions and subdivisions, the soil carbon stock is greater
33.5 tC/ha reported by [34] in the swamp forests of Likouala than or equal to 5.70 ± 2.06 tC/ha (Table 8). It is higher in
(Northern Congo). The conditions required for dead wood sam- the wooded savannah of Benoue subdivisions with a value of
pling may also justify the low carbon stock obtained in this study 28.78 ± 2.87 tC/ha (Table 8). The results obtained from soil car-
in comparison with values found in the literature. Indeed, the bon stocks in this study are contained in the range 10.70 ± 1.04–
sampling method requires that the length of the line be defined 33.54 ± 5.54 tC/ha reported by [20] in savannah ecosystems of
over at least 100 m [34]. Thus, any dead wood that did not allow Northern Cameroon. Vegetation types can alter soil carbon stocks
these measurement conditions to be taken into account was not due to several key factors, including litter fall and root turnover,
sampled. In this study we used a transect line of only 80 m per soil chemistry, root exudates and microclimate [20].
study site, which was not the case in other studies in the tropics
[20, 35, 36].
3.8. Total carbon stock
Between regions and subdivisions, the total carbon stock is
3.6. Carbon stock in root biomass greater than 29 tC/ha (Table 9). It is higher in the wooded
Between regions and subdivisions, the carbon stock in the root savannah of Vina subdivisions with a value of 78.61 ± 5.98
biomass is greater than or equal to 1.62 ± 0.18 tC/ha (Table 7). It is tC/ha (Table 9).These results are in the range 27.35 ± 14.65–
higher in the wooded savannah of Vina subdivisions with a value 152.18 ± 43.76 tC/ha reported by [8] in savannah ecosystems
of 11.17 ± 2.38 tC/ha (Table 7). This result is higher than those of of Northern Cameroon. These results are also within the range
[10] in the savannah (2.74 ± 0.030 tC/ha) of North Cameroon. 13.69–164.84 tC/ha reported by [37] in wooded and shrubby
But remains lower than those of [6] in the shrubby savannah savannah of Ivory Coast. This is due to the diameter breast
(15.02 ± 1.31 tC/ha) and wooded savannah (15.78 ± 1.87 tC/ha). height (Dbh), basal area and higher tree density in the wooded
On the other hand, this result is in the range 8.44 ± 0.11– savannah of Vina subdivisions than in other savannah in
11.42 ± 0.67 tC/ha reported by [20] in savannah ecosystems of different study areas. This result is superior to those of [6]
Northern Cameroon. in the shrubby savannah (56.09 ± 1.16 tC/ha) and wooded
6 International Journal of Low-Carbon Technologies 2021, 00, 1–9Carbon management for savannah ecosystems in Central Africa
Table 7. Carbon stock in root biomass.
Regions Subdivisions Wooded savannah Shrubby savannah Grassy savannah Arborescent savannah
Adamawa Faro et Deo 9.23 ± 2.06a 7.86 ± 2.00a 3.87 ± 1.31a 8.19 ± 2,03a
(63,701 km2 ) Mayo Banyo 9.36 ± 2.08a 8.69 ± 2.10a 2.31 ± 1.06a 8.43 ± 2.05a
Mbere 9.54 ± 2.11a 9.89 ± 2.14a 4.88 ± 1.81a 9.22 ± 2.07a
Vina 11.17 ± 2.38ab 8.05 ± 2.05a 3.93 ± 1.43a 7.85 ± 2.01a
Mean 9.82 ± 2.27A 8.62 ± 2.17A 3.74 ± 1.40A 8.42 ± 2.16A
North Benoue 9.71 ± 2.27a 9.27 ± 2.03a 2.76 ± 1.64a 7.00 ± 2.02a
(68,090 km2 ) Faro 10.74 ± 2.37a 8.78 ± 2.04a 3.90 ± 1.35a 7.92 ± 2.03a
Mayo Loutii 10.66 ± 2.32a 9.31 ± 2.08a 2.94 ± 1.31a 9.23 ± 2.07a
Downloaded from https://academic.oup.com/ijlct/advance-article/doi/10.1093/ijlct/ctab050/6310596 by guest on 07 October 2021
Mayo Rey 10.00 ± 2.28a 8.87 ± 2.06a 1.62 ± 0.18a 8.70 ± 2.05a
Mean 10.27 ± 2.29A 9.05 ± 2.05A 2.80 ± 1.12A 8.42 ± 2.14A
In each column, the values assigned the same letter are not statistically different (P > 0.05; Duncan test).
Table 8. Soil carbon stock.
Regions Subdivisions Wooded savannah Shrubby savannah Grassy savannah Arborescent savannah
Adamawa Faro et Deo 20.44 ± 2.76a 25.85 ± 2.65a 10.98 ± 3.05c 26.50 ± 2.98a
(63,701 km2 ) Mayo Banyo 19.33 ± 2.89a 25.58 ± 3.90a 5.70 ± 2.06a 20.91 ± 2.05a
Mbere 25.89 ± 3.98ab 24.53 ± 5.74a 8.81 ± 2.21b 22.73 ± 3.78a
Vina 23.48 ± 5.08b 22.34 ± 2.90a 10.64 ± 3.23c 19.00 ± 1.89a
Mean 22.28 ± 3.78A 24.57 ± 5.08A 9.03 ± 2.71A 22.28 ± 3.32A
North Benoue 28.78 ± 2.87a 24,65 ± 4.63a 11.34 ± 3.08c 21.02 ± 2.02a
(68,090 km2 ) Faro 20.40 ± 4.17a 24.39 ± 2.04a 14.70 ± 2.72d 28.21 ± 2.04a
Mayo Loutii 24.20 ± 4.76a 21.76 ± 3.43a 14.26 ± 2.09d 19.54 ± 2.32a
Mayo Rey 24.50 ± 3.06a 23.64 ± 2.87a 17.54 ± 4.54de 20.20 ± 3.72a
Mean 24.56 ± 4.33A 23.61 ± 4.08A 14.46 ± 3.10B 22.24 ± 3.29A
In each column, the values assigned the same letter are not statistically different (P > 0.05; Duncan test).
Table 9. Total carbon stock.
Regions Subdivisions Wooded savannah Shrubby savannah Grassy savannah Arborescent savannah
Adamawa Faro et Deo 67.63 ± 5.76a 67.51 ± 5.68a 32.97 ± 3.05a 69.49 ± 5.38a
(63,701 km2 ) Mayo Banyo 64.13 ± 5.69a 72.79 ± 5.89a 31.81 ± 3.04a 63.18 ± 5.25a
Mbere 73.87 ± 5.84ab 71.94 ± 5.78a 34.53 ± 3.11a 75.47 ± 5.88a
Vina 78.61 ± 5.98b 63.15 ± 5.56a 31.33 ± 3.01a 58.74 ± 5.09a
Mean 71.06 ± 5.75A 68.84 ± 5.44A 32.66 ± 3.05A 66.72 ± 5.48A
North Benoue 76.61 ± 5.87a 75.52 ± 5.93a 29.96 ± 3.08a 65.06 ± 5.30a
(68,090 km2 ) Faro 72.74 ± 5.81a 66.73 ± 5.77a 40.40 ± 3.72a 69.97 ± 5.64a
Mayo Loutii 50.46 ± 5.00a 67.11 ± 5.73a 40.24 ± 3.69a 63.93 ± 5.32a
Mayo Rey 71.50 ± 5.76a 70.07 ± 5.74a 35.78 ± 3.54a 65.70 ± 5.42a
Mean 68.07 ± 5.26A 69.85 ± 5.51A 36.59 ± 3.50A 66.16 ± 5.37A
In each column, the values assigned the same letter are not statistically different (P > 0.05; Duncan test).
savannah (60.81 ± 1.42 tC/ha) of Ngaoundere. But remains lower teqCO2 /ha (Table 10). From these values, savannah ecosystems
than those of [33] in the shrubby savannah (81.48 tC/ha) and can compensate for carbon dioxide emissions from anthropogenic
wooded savannah (118.36 tC/ha) of the Sudano-Guinean zone activities. These results are contained in the range 103.09 ± 29.54–
(Ngaoundere-Cameroon). 427.17 ± 45.06 teqCO2 /ha reported by [8] in savannah ecosys-
tems of Northern Cameroon. The highest values of CO2 quantities
are observed in the wooded savannah of Vina subdivisions with
3.9. Ecological services a value of 288.49 ± 15.50 teqCO2 /ha. This result is higher than
Between regions and subdivisions, CO2 emissions are higher those of [27] in savannah of the Ngaoundere (99.00 tCO2 /ha),
than 100 teqCO2 /ha (Table 10). They are higher in the wooded [10] in the savannah of Ngong (48.28 tCO2 /ha) and [12] in the
savannah of Vina subdivisions with a value of 288.49 ± 15.50 savannah of Ngaoundere (50.05 tCO2 /ha).
International Journal of Low-Carbon Technologies 2021, 00, 1–9 7Awé et al.
Table 10. CO2 emissions.
Regions Subdivisions Wooded savannah Shrubby Savannah Grassy savannah Arborescent Savannah
Adamawa Faro et Deo 248.20 ± 12.83a 247.76 ± 12.65a 120.09 ± 11.19a 255.02 ± 12.08a
(63,701 km2 ) Mayo Banyo 235.35 ± 10.04a 267.13 ± 13.90a 116.74 ± 11.15a 231.87 ± 12.05a
Mbere 271.10 ± 13.93a 264.01 ± 12.74a 126.72 ± 11.41a 276.97 ± 12.78a
Vina 288.49 ± 15.50b 231.76 ± 12.10a 114.98 ± 11.04a 215.57 ± 12.00a
Mean 260.78 ± 12.44A 252.66 ± 12.05A 119.63 ± 11.19A 244.85 ± 12.08A
North Benoue 281.15 ± 15.08a 277.15 ± 13.03a 109.95 ± 11.30a 238.77 ± 12.02a
(68,090 km2 ) Faro 266.95 ± 13.80a 244.89 ± 12.04a 148.26 ± 13.65a 256.78 ± 12.64a
Mayo Loutii 188.85 ± 10.06a 246.29 ± 12.13a 147.68 ± 13.54a 234.62 ± 12.32a
Downloaded from https://academic.oup.com/ijlct/advance-article/doi/10.1093/ijlct/ctab050/6310596 by guest on 07 October 2021
Mayo Rey 262.40 ± 13.05a 257.15 ± 13.37a 131.31 ± 12.99a 241.12 ± 12.42a
Mean 249.83 ± 12.07A 256.37 ± 12.09A 134.30 ± 12.87A 242.82 ± 12.06A
In each column, the values assigned the same letter are not statistically different (P > 0.05; Duncan test).
4. CONCLUSIONS REFERENCES
The general objective of this work was to assess the carbon [1] Sofalne C, Kengne B, Carisey N, et al. Actions pour la Biodiversité et
Gestion des Terroirs, Plan d’Actions Forestier ABIOGeT (2016–2020),
sequestration potential and ecological service of savannah
Projet Jeunes Emploi-Vert: «05 millions d’arbres» [in French]. 2017; 55.
ecosystems in Cameroon. The results of this work showed that, [2] FAO (Food and Agriculture Organization). Base des données de la FAO
the carbon stock in the aboveground biomass ranged from 2011. http://faostat3.fao.org. Visité le 24 mars 2020 à 22 heures [in French].
11.15 ± 2.41–25.06 ± 3.86 tC/ha to 10.46 ± 2.25–25.89 ± 4.58 2014;254.
tC/ha in Adamawa and North regions, respectively. Carbon stock [3] Bosangi. Le magazine trimestriel de l’environnement, édition janvier-
février/N :49-Hyscam [in French]. 2017; 31.
in litter biomass ranged from 0.15 ± 0.02–2.56 ± 0.78 tC/ha to
[4] Bosangi . Le magazine trimestriel de l’environnement, édition janvier-
0.46 ± 0.09–2.56 ± 0.77 tC/ha in Adamawa and North regions, février/N :50-Hyscam [in French]. 2018; 38.
respectively. Carbon stock in herbaceous biomass is greater than [5] Zapfack L, Chimi DC, Noiha NV et al. Correlation between associated
or equal to 3.00 ± 1.02 tC/ha in the savannah ecosystems within trees, cocoa trees and carbon stocks potential in cocoa agroforests of
the regions. Carbon stock in dead wood biomass is greater than Southern Cameroon. Sustain Environ 2016;1:2470–6388.
[6] Tchobsala DND, Nyasiri J, Ibrahima A. Carbon storage of anthropoid’s
or equal to 2.26 ± 1.09 tC/ha in the savannah ecosystems within
vegetation on the Ngaoundéré escarpment (Adamawa, Cameroon). J Adv
regions. The carbon stock in the root biomass is greater than or Biol 2016;9:2347–6893.
equal to 1.62 ± 0.18 tC/ha in the savannah ecosystems within the [7] Awé DV, Noiha NV, Zapfack L et al. Vegetation structure, root biomass
regions. Soil carbon stock ranged from 3.74 ± 1.40–9.82 ± 2.27 distribution and soil carbon stock of Savannah Agrosystems in Sudano-
tC/ha to 2.80 ± 1.12–10.27 ± 2.29 tC/ha in Adamawa and Sahelian zone of Cameroon. J Bot Res 2019;2:71–80.
[8] Awé DV, Noiha NV, Carbon Storage ZL. Emission factor of savanna
North regions, respectively. The total carbon stocks ranged from
ecosystems in Sudano-Sahelian zone of Cameroon. J Bot Res 2020;
32.66 ± 3.05–71.06 ± 5.75 to 36.59 ± 3.50–69.85 ± 5.51 tC/ha 2:60–7.
in Adamawa and North regions, respectively. CO2 emissions are [9] Ibrahima A, Schmidt P, Ketner P, Mohren GJM. Phytomasse et cycle
greater than 100 tCO2 /ha in the savannah ecosystems within the des nutriments dans la forêt tropicale dense humide du sud Cameroun.
regions. Savannah ecosystems contain very remarkable carbon Tropenbos-Cameroon. Documents 2002;9:84.
[10] Noiha NV, Zapfack L, Awé DV et al. Floristic structure and sequestration
stocks and ecological services. In view of their social, ecological
potential of cashew agroecosystems in Africa: a case study from Cameroon.
and environmental importance to the neigh boring populations, J Sustain For 2017;36:277–88.
such ecosystems are considered as factors that reduce CO2 [11] Ibrahima A, Saolo PN, Fanta CA. Carbon stock as related to fallow age in
emissions and therefore contribute to the mitigation of climate the Sudano-Guinea savannahs of Ngaoundere, Adamawa, Cameroon. Int J
change in the Adamawa and North regions of Cameroon. Plant Soil Sci 2019;27:1–14.
[12] Noiha NV, Zapfack L, Hamadou MR et al. Floristic diversity, carbon stor-
age and ecological services of eucalyptus agrosystems in Cameroon. Agro-
forest Syst 2018;92:239–50. https://doi.org/10.1007/s10457-017-0130-5.
ACKNOWLEDGMENTS [13] Chave J, Andalo C, Brown S et al. Tree allometry and improved esti-
mation of carbon stocks and balance in tropical forests. Oecologia 2005;
The authors thank the reviewer whose contributions have been 145:87–99.
very significant for the improvement of this study. [14] Zapfack L, Noiha NV, Dziedjou KPJ et al. Carbon stocks in the surround-
ings of Lobéké National Park (Cameroon) in the Congo Basin. Environ Nat
Resources Res 2013;3:78–86.
[15] AFNOR. Qualité du sol et Prétraitement des échantillons pour analyses
CONFLICTS OF INTEREST physico-chimiques (NF ISO 11464) [in French]. 2006; 3.
[16] Awé DV, Noiha NV, Zapfack L et al. Carbon sequestration potential and
The authors declare that they have no known competing financial economic value in agroforestry parkland to Tectona grandis L. f. (Verbe-
interests or personal relationships that could have appeared to naceae) in Central Africa: a case study to Department of Poli northern
influence the work reported in this paper. region in Cameroon. Adv Res 2019;18:1–16.
8 International Journal of Low-Carbon Technologies 2021, 00, 1–9Carbon management for savannah ecosystems in Central Africa
[17] Ifo AS, Koubouana F, Jourdain C, Stock ND. Flow of Carbon in plant [28] Djomo AN, Picard N, Fayolle A et al. Tree allometry for estima-
Woody debris in two different types of natural forests in Bateke plateau, tion of carbon stocks in African tropical forests. Forestry 2016;89:
Central Africa. Open J For 2015;5:38–47. 446–55.
[18] Mund M. Carbon pools of European beech forests (Fagus sylvatica) under [29] IPCC (Intergovernmental Panel on Climate Change). 2003. Good
different silvicultural management. Thesis. Der Georg-August-Universität Practice Guidance for Land Use, Land-use Change and Forestry
Göttingen. Berichte des Forschungszentrums WaldökosystemeReihe A, (LULUCF). Hayama, Japan: Institute for Global Environmental Strategies.
Band 189. 2004;256. 45.
[19] Woldendorp G, Keenan RJ, Barry S, Spencer RD. Analysis of sampling [30] Mohanraj R, Saravanan J, Dhanakumar S. Carbon stock in Kolli forests,
methods for coarse woody debris. For Ecol Manag 2004;198:133–48. eastern Ghats (India) with emphasis on aboveground biomass, litters,
[20] Awé DV, Noiha NV, Zapfack L et al. Carbon stocks in dead wood woody debris and soil. For Biogeosci For 2011;4:61–5.
biomass of savannah ecosystems in northern region Cameroon. J Bot Res [31] Valentini. 2007. Evaluation de la séquestration de carbone dans des planta-
Downloaded from https://academic.oup.com/ijlct/advance-article/doi/10.1093/ijlct/ctab050/6310596 by guest on 07 October 2021
2019;2:60–70. tions agroforestières et des jachères issues d’une agriculture migratoire dans
[21] Walkley A, Black CA. An examination of the Degtjareff method for deter- les territoires autochtones de Talamanca au Costa [in French. Mémoire
mining soil organic matter and a proposal modification of the chromic acid présenté pour l’obtention du grade de Maître ès sciences (M. Sc). Faculté
titration method. Soil Sci 1934;37:29–38. des Sciences de l’Agriculture et de l’alimentation, Université Laval Québec.
[22] AFNOR. Qualité du sol et dosage du carbone organique par oxydation World Cacao Foundation. 140.
sulfochromique ou au bicarbonate de potassium (NF ISO 14235) [in [32] Brown S, Lugo AE. The storage and production of organic matter in
French]. 1998;3. tropical forests and their role in the global carbon cycle. Biotropica
[23] Bazezew MN, Soromessa T, Bayable E. Carbon stock in Adaba-Dodola 1982;14:161–87.
community forest of Danaba District, West-Arsi zone of Oromia region, [33] Ibrahima A, Abib FC. Estimation du stock de carbone dans les faciès
Ethiopia: an implication for climate change mitigation. J Ecol Nat Environ arborés et arbustifs des savanes soudano-guinéennes de Ngaoundéré,
2015;7:14–22. https://doi.org/10.5897/JENE2014.0493. Cameroun. Cameroon J Exp Biol 2008;4:1–11.
[24] Noiha NV, Zapfack L, Pelbara P et al. Afforestation/reforestation based on [34] Bocko YE, Ifo SA, Loumeto JJ. Quantification Des Stocks De Carbone
Gmelina Arborea (Verbenaceae) in tropical Africa: floristic and structural De Trois Pools Clés De Carbone En Afrique Centrale : Cas De La
analysis, carbon storage and economic value (Cameroon). Sustain Environ Forêt Marécageuse De La Likouala (Nord Congo) [in French. Eur. Sci. J
2018;3:2470–6388. 2017;13:1857–7881.
[25] Youl S. 2005. Dynamique et modélisation de la dynamique du carbone dans [35] Ifo AS. 2010. Apport de carbone au sol et stock dans deux types forestiers
un agrosystème de savane de l’Ouest du Burkina Faso. Thèse de doctorat (forêt galerie et forêt secondaire) des plateaux tékés [in French. Thèse,
unique, Université Polytechnique de Bobo Dioulasso (UPS) du Burkina Université-Marien-NGouabi, Brazzaville. 194.
Faso [in French. 144. [36] Carlson B. 2013. Gabon’s Overlooked Carbon. A tropical forest of coarse
[26] Noiha NV, Zapfack L, Ngueguim JR et al. Floristic diversity and structure woody debris. Master: Environmental Management degree, Duke Univer-
of cocoa agro-ecosystems in southeastern Cameroon. J Agricult Ecol Res sity. 38. https://dukespace.lib.duke.edu.
Int 2018;14:1–9. [37] Ouattara IZ. 2012. Suivi par télédétection de l’évolution des formations végé-
[27] Iddo T. 2017. Diversité floristique et stocks de carbone des plantations à tales et du stock de carbone de la réserve de faune d’Abokouamékro en vue
Mangifera indica (Anacardiaceae) : Cas du département de la Vina (Region de son intégration dans le mécanisme REDD+ [in French. Mémoire en vue
de l’Adamaoua). Mémoire de Master en Biologie des Organismes Végétaux, d’obtention du Diplôme d’Agronomie approfondie- Option eaux et forêts,
Université de Ngaoundéré [in French. 53. https://www.memoireonline. Institut national polytechnique Félix Houphouët-Boigny de Yamoussoukro
com. (Côte d’Ivoire). 54.
International Journal of Low-Carbon Technologies 2021, 00, 1–9 9You can also read