Nike versus New Balance: Trade Policy in a World of Global Value Chains
←
→
Page content transcription
If your browser does not render page correctly, please read the page content below
Volume 12
                                                                                                                                Issue 4
                                                                                                                         December 2014

    Nike versus New Balance: Trade Policy in a World of Global Value
    Chains
    Case prepared by Simon BRODEUR 1 and Professor Ari VAN ASSCHE 2

    United States Trade Representative (USTR) Michael Froman closed the door of his new office,
    walked to his window, and admired the glimmering Washington D.C. skyline. During his
    illustrious career as a government official, Froman had never wielded such power as he did now:
    he had just been nominated by President Obama to be the 11th USTR, serving as the president’s
    principal advisor, negotiator, and spokesperson on matters pertaining to international trade and
    investment. One of his main responsibilities would be to complete negotiations on the Trans-
    Pacific Partnership (TPP), an Asian-Pacific trading bloc built upon the pre-existing Trans-Pacific
    Strategic Economic Partnership Agreement between Brunei, Chile, New Zealand, and Singapore.
    As of 2013, numerous nations had participated in the TPP negotiations, namely the United States,
    Australia, Brunei, Canada, Chile, Japan, Malaysia, Mexico, New Zealand, Peru, Singapore and
    Vietnam (Exhibit 1).

    The TPP was the most promising trade liberalization initiative since the Doha round of world
    trade talks, which stalled in 2008, and would cover approximately 40% of the world’s GDP. 3 The
    multilateral talks could potentially deliver huge benefits for the U.S. economy, as the TPP would
    provide American companies with unprecedented market access to key players in the Asia-
    Pacific, the largest and fastest growing region in the world. 4 Furthermore, it would allow
    consumers and importers to enjoy wider and cheaper access to the goods and services of TPP
    countries.

    Froman knew that the TPP negotiations would have to be conducted with caution, however;
    reducing U.S. barriers to trade and investment would put additional pressure on the country’s
    already frail manufacturing sector. Between 1999 and 2012, while the total number of U.S. jobs
    had increased by 2.3%, U.S. production occupations had fallen by 31.9% (Exhibit 2). Import
    competition from and offshoring to Asian manufacturing nations such as China and Indonesia −
    and TPP negotiating partner Vietnam − were widely blamed for the decline of U.S. manufacturing.

    1   Simon Brodeur is an M.Sc. student at HEC Montréal.
    2   Ari Van Assche is an Associate Professor in the Department of International Business at HEC Montréal.
    3   “Free Trade Agreements: Opening Up the Pacific,” The Economist, November 12, 2011 (accessed October 17, 2013).
    4   International Bank for Reconstruction and Development / World Bank, East Asia and Pacific Economic Update – April 2013 –
        A Fine Balance, 2013 (accessed October 17, 2013).
    © HEC Montréal 2014
    All rights reserved for all countries. Any translation or alteration in any form whatsoever is prohibited.
    The International Journal of Case Studies in Management is published on-line (http://www.hec.ca/en/case_centre/ijcsm/), ISSN 1911-2599.
    This case is intended to be used as the framework for an educational discussion and does not imply any judgement on the
    administrative situation presented. Deposited under number 9 00 2014 001 with the HEC Montréal Case Centre, 3000, chemin de
    la Côte-Sainte-Catherine, Montréal (Québec) Canada H3T 2A7.
This document is authorized for use only in International Business by Maria Morfin Guttierrez at HEC Montréal from 2020/11/16 to 2021/06/01.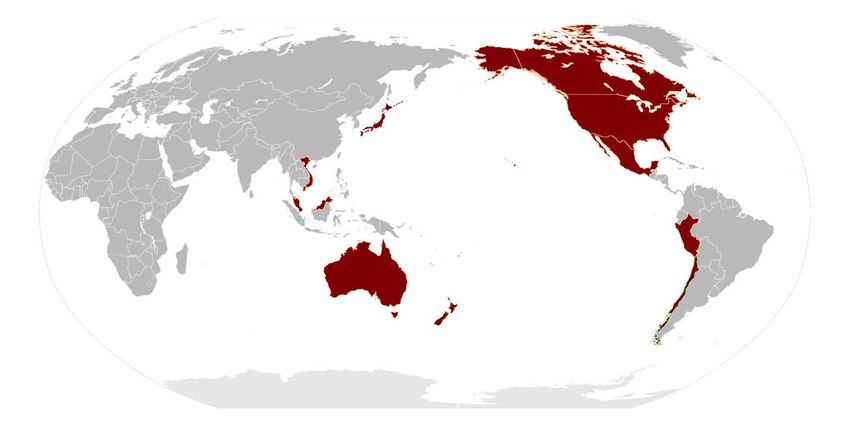
Nike versus New Balance: Trade Policy in a World of Global Value Chains

    When negotiating the TPP, it was therefore imperative for Froman to find the right balance
    between promoting American business interests abroad and protecting American interests at
    home.

    In recent months, industry activists and politicians had focused on the downside risks of the TPP
    negotiations for the American footwear industry. U.S. footwear manufacturing had contracted by
    almost a third in the last decade due to increased import competition from China and Vietnam,
    and tariff reductions on Vietnamese imports would likely accelerate this decline.

    Froman was aware that the footwear industry would be a major sticking point in the TPP
    negotiations. After consulting with various U.S. footwear lobby groups earlier that day, he knew
    that even among American companies, there was disagreement on the position the U.S. should
    adopt. The divide was especially wide between two major footwear companies: Nike Inc. and
    New Balance. On the one hand, New Balance was strongly opposed to the removal of tariffs on
    shoes from Vietnam, as they believed this would endanger footwear manufacturing activities in
    the U.S. On the other hand, Nike Inc. was adamant that the tariffs on footwear imports from
    Vietnam were detrimental to the U.S. economy. According to Nike, tariffs have led to higher
    footwear prices, which harm U.S. consumers and reduce the competitiveness of U.S. firms. If
    tariffs were eliminated, U.S. footwear manufacturers would be able to save on production costs
    and reinvest those savings in modern, high-value-added jobs in America. 1

    When he was sworn in as USTR, Froman had promised to use every tool at his disposal to level
    the playing field so that Americans could compete and win in the global economy. 2 Yet
    discussions with representatives from New Balance and Nike had shown him that identifying the
    best negotiating strategy would be complex and require in-depth analysis of the impact of tariff
    elimination on the various footwear industry stakeholders. His stance on the TPP footwear
    dilemma required urgent deliberation, as the president had summoned all of his advisors to a
    conference call later that evening and expected them to advise him on the position the United
    States should adopt during the TPP negotiations.

    The U.S. footwear industry

    Froman had to first consider the U.S. footwear market and industry to determine the impact of the
    TPP on the domestic economy. The challenges facing the footwear manufacturing industry were
    similar to those of the U.S. manufacturing sector as a whole. Rising wages and heavy competition
    from low-cost countries were putting a strain on U.S. shoe factories. In 2012, only 13,290 people
    were employed in the footwear manufacturing industry, down from 19,440 in 2003. This
    decrease was due largely to a 41% decline in the number of production workers (Exhibit 3). In
    comparison, office and administrative support occupations in the footwear industry had dropped
    by just 25%, and management occupations had almost returned to 2003 levels.

    1   Eric Martin, “New Balance Wants Its Tariffs. Nike Doesn’t,” BloombergBusinessWeek, May 3, 2012 (accessed October 17,
        2013).
    2   Office of the United States Trade Representative, “Statement by United States Trade Representative Michael Froman,” 2013:
        http://www.ustr.gov/about-us/press-office/press-releases/2013/june/amb-froman-statement (accessed October 17, 2013).

    © HEC Montréal                                                   2
This document is authorized for use only in International Business by Maria Morfin Guttierrez at HEC Montréal from 2020/11/16 to 2021/06/01.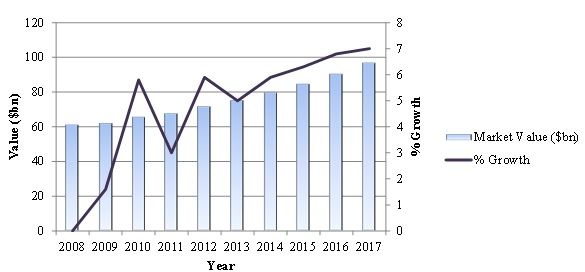
Nike versus New Balance: Trade Policy in a World of Global Value Chains

    The decrease in U.S. footwear manufacturing activities contrasts sharply with the steady growth
    of the U.S. footwear market. It is the world’s largest, valued at $71.7 billion in 2012, accounting
    for 27.9% of the global footwear market, and projected to continue developing in the short to
    medium term (Exhibit 4).

    The main reason for America’s manufacturing decline is growing import competition from low-
    wage countries. Currently, almost 99% of the footwear sold in the United States is imported from
    low-cost manufacturing locations, especially in East and Southeast Asia. 1 China alone accounted
    for 71.9% of U.S. footwear imports in 2012, while TPP negotiating partner Vietnam, a rapidly
    developing footwear behemoth, accounted for 10.1% of those imports (Exhibit 5). The pace of
    Vietnam’s growth in the footwear market is staggering: exports to the U.S. jumped an astounding
    23.8% annually between 1997 and 2012, and that trend is expected to continue over the short
    term as wages in China continue to rise.

    Vietnamese footwear industry

    Ever since Vietnam signed the U.S.-Vietnam Bilateral Trade Agreement in 2001 establishing
    “normal trade relations,” 2 it has been an increasingly important source of footwear products. In
    just fifteen years, Vietnam grew into America’s second largest supplier of footwear imports
    (Exhibit 5). In 2012, about 13% of its exports to the U.S. were footwear products, making this a
    strategic industry for Vietnam. 3

    Vietnam has a clear footwear production cost advantage over the U.S. A New Balance
    spokesperson estimated that producing a pair of shoes in the U.S. costs 25-35% more than in
    Vietnam, 4 while a Nike representative estimated that it costs around US$20-25 to produce a pair
    of Nike running shoes in a Vietnamese factory. 5

    Low wages are a key driver of this production cost advantage. Earnings in Vietnam are more than
    20 times lower than in the U.S. A study by the Congressional Research Service concluded that
    wages in Vietnam’s footwear and apparel manufacturing sector averaged US$0.51 an hour in
    2012. 6 This is significantly lower than in China. 7

    In addition to low wages, low labour and environmental standards help Vietnamese companies
    keep their production costs down. Vietnam has ratified eighteen conventions with the

    1   Timothy Aeppel, “New Balance Sweats Push to End U.S. Shoe Tariffs,” The Wall Street Journal, February 27, 2013, (accessed
        October 17, 2013).
    2   Embassy of the United States, Hanoi, Vietnam, “The U.S.-Vietnam Bilateral Trade Agreement (BTA) – Resources for
        Understanding,” n.d. (accessed October 17, 2013).
    3   United States Census Bureau, “U.S. Imports from Vietnam by 5-digit End-Use Code, 2003 – 2012,” 2012 (accessed October 17,
        2013).
    4   See Aeppel, op. cit.
    5   Jim Landers, “Vietnam Trade Deal Sparks a Running Battle on Shoe Tariffs,” The Dallas Morning News, December 27, 2012
        (accessed October 17, 2013).
    6   Michaela D. Platzer, U.S. Textile Manufacturing and the Trans-Pacific Partnership Negotiations, Congressional Research
        Service, October 5, 2012 (accessed October 17, 2013).
    7   See Aeppel, op. cit.

    © HEC Montréal                                                   3
This document is authorized for use only in International Business by Maria Morfin Guttierrez at HEC Montréal from 2020/11/16 to 2021/06/01.
Nike versus New Balance: Trade Policy in a World of Global Value Chains
International Labour Organization (ILO). 1 However, labour unions in Vietnam are not
independent from the ruling communist party, and workers are not free to create or join unions.
Furthermore, official strikes are rendered almost impossible due to government requirements.
While collective bargaining exists, it is a relatively new concept and has yet to take root in the
country. Finally, child labour, forced labour, and long hours are still a problem in Vietnam as the
government struggles to enforce laws prohibiting such working conditions. 2
Government support of the country’s strategic footwear sector also strengthens Vietnamese firms.
Vietnam is officially still a communist country, and its footwear sector is dominated by large
state-owned enterprises that enjoy large government subsidies and extensive support. For
example, Vinatex, the state-owned textile and apparel consortium, is the tenth largest garment
producer in the world and currently accounts for 40% of the country’s apparel production, 60%
of its textile production, and close to 20% of its total apparel and textile exports. 3 According to
the National Council of Textile Organizations, Vinatex benefits from eleven different
government subsidy programs that include low-cost loans and free land. 4
A final advantage of Vietnam’s footwear industry is its heavy reliance on cheap imported yarn
from China. Like Vietnamese footwear, Chinese yarn is predominantly produced by large state-
owned enterprises that receive dozens of direct and indirect subsidies from the government. The
allegedly unfair practices of Chinese yarn producers has led many countries, including those in
the European Union, to impose antidumping tariffs on yarn originating from China. 5
U.S. trade protectionism
Compared to other industries, the U.S. footwear sector is highly protected by import tariffs.
While U.S. import tariffs on consumer goods average about 1.5%, the average tariff on imported
footwear is approximately 10%. 6 Moreover, they can run as high as 48% of the “free on board”
(FOB) value of imported shoes, that is, the commercial value of the shoes before transportation
costs are added to the price (Exhibit 6). These tariff rates substantially affect production costs; for
instance, of their US$20-25 overall production costs, current tariffs on athletic shoes add US$3 to
US$5 to the cost of midrange running shoes from Vietnam, increasing production costs by as
much as 25%. 7
While the United States has signed numerous free trade agreements (FTA) over the years, it has
generally been reluctant to completely eliminate tariffs on footwear and has systematically
1 International Labour Organization, “International Labour Standards,” n.d. (accessed October 17, 2013).
2 Embassy of the United States, Hanoi, Vietnam, “International Labor Standards – Critical To Successful Economic Development
– Workers’ Rights and Labor Standards,” n.d. (accessed October 17, 2013).
3 See Platzer, op. cit.
4 National Council of Textile Organizations, “Fact Sheet – Trans-Pacific Partnership Negotiations,” 2012 (accessed October 17,
2013).
5 Jonathan Steams, “China Faces Five-Year EU Tariffs on Automotive Yarn,” Bloomberg, November 29, 2010 (accessed October
17, 2013).
6 Erik Siemers, “Blumenauer: Footwear Tariffs Hurt Nike, Drive Up Costs,” Portland Business Journal, April 20, 2012 (accessed
October 17, 2013).
7 See Aeppel, op. cit.
© HEC Montréal 4
This document is authorized for use only in International Business by Maria Morfin Guttierrez at HEC Montréal from 2020/11/16 to 2021/06/01.Nike versus New Balance: Trade Policy in a World of Global Value Chains
imposed a “yarn forward rule” to these FTAs. This rule of origin requires that the yarn used in
shoe manufacturing be produced within the FTA countries to qualify for the reduced duties
agreed upon in the trade agreements. 1 This serves to protect the U.S. textile industry, a battered
yet significant component of the manufacturing sector. Textiles are a US$53 billion industry that
employed almost 240,000 workers in 2011. However, its prominence has declined steadily in
recent years, with almost 300,000 fewer people working in the textile industry than in 2001. 2
New Balance versus Nike Inc.
While Vietnam was pressuring the U.S. to reduce tariffs on imported footwear, interest groups
inside the country were also pressuring Froman and the U.S. negotiators. Froman’s meetings with
various lobby groups revealed that the widest divide was between American footwear companies
New Balance and Nike Inc. On the one hand, New Balance argued that reductions in import
tariffs would be detrimental to U.S. footwear workers and smaller footwear manufacturing
companies. On the other hand, Nike Inc. contended that reducing tariffs on footwear would
strengthen U.S. companies, create high-value footwear jobs in the United States, and lower
consumer prices. Froman was particularly intrigued by this disagreement: which of the two
companies was really defending American economic interests?
New Balance Athletic Shoe, Inc.
New Balance, an American firm headquartered in Boston, Massachusetts, has been a player in the
footwear industry for many years. 3 It was founded in 1906 under the name New Balance Arch
Support Company by William J. Riley, a British immigrant who had the idea of designing arch
supports shaped like a chicken’s three-clawed foot to maximize comfort, mostly for policemen
and waiters. He later added ancillary products, and, in 1938, designed his first athletic shoe made
of lightweight kangaroo leather with crepe soles for the Brown Bag Harriers Running Club in
Belmont, MA. The company continued to grow and was bought in 1972 by Jim Davis, an
entrepreneur and marathoner who still owns the firm. By 2012, his business acumen had led New
Balance to becoming the fourth largest athletic footwear and apparel company in the world with
annual sales of $2.4 billion in over 120 countries. In addition to its eponymous footwear and
clothing brand, the New Balance family also includes the brands Avaron, Cobb Hill, Dunham,
PF-Flyers, Brine, and Warrior.
Throughout its history, New Balance has focused on footwear innovation, resulting in a number
of industry firsts: the first athletic shoe available in multiple widths; the first running shoe made
exclusively for women; and the first shoe to incorporate flared heels for stability. More recently,
the company has focused on custom shoes and its “Made in America” businesses. For US$115, a
consumer can order a custom pair of shoes that is made in the United States, choosing any
combination of twenty-six leather colours and five fabric colours for nine different shoe parts.
And the company is taking customization much further than just the shoe’s appearance: it is
1 See Platzer, op. cit.
2 Ibid.
3 Information concerning the company’s history and statistics was obtained from New Balance’s Web sites and Responsible
Leadership Report: http://www.newbalance.com/Overview/about_overview,default,pg.html (accessed October 17, 2013).
© HEC Montréal 5
This document is authorized for use only in International Business by Maria Morfin Guttierrez at HEC Montréal from 2020/11/16 to 2021/06/01.Nike versus New Balance: Trade Policy in a World of Global Value Chains
introducing a track-specific running shoe that uses 3-D printing to create a plate on the sole of the
shoe that is supposed to enhance performance with every step. These custom shoes can be
delivered in as little as four days and are a growing part of the firm’s sales.
Over the years, this focus on innovation has consolidated New Balance’s reputation: in 1976, the
New Balance 320 was voted the best running shoe by Runner’s World, and the 990 “Made in the
USA” series, produced in the company’s five U.S. factories, has been increasingly popular
among U.S. consumers ever since it was launched in 1982. In 2008, New Balance inaugurated a
state-of-the-art research lab next to its Lawrence, MA, factory that is exclusively dedicated to
research into athletic footwear.
Unlike most of its competitors, New Balance does not outsource all of its footwear production to
foreign contractors. Rather, it uses a hybrid system of insourcing and outsourcing. In New
England, for example, New Balance owns five manufacturing plants that primarily produce for
local markets: 90% of their output is for American consumers, accounting for about a quarter of
the company’s total U.S. sales. 1 While New Balance is currently the sole U.S. athletic footwear
manufacturer to produce a portion of its shoes in the United States, it also relies heavily on
foreign contractors in China, Indonesia, and Vietnam. 2
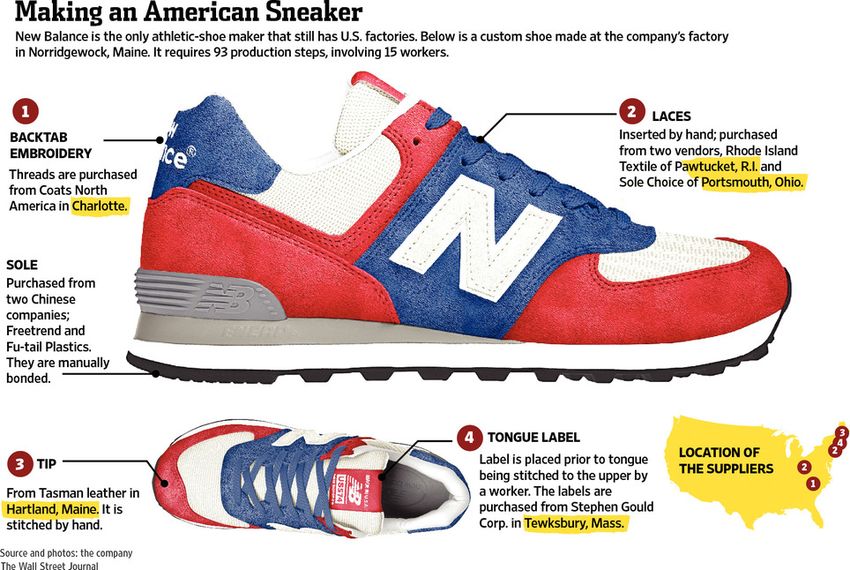
New Balance has a number of U.S. suppliers for parts it does not manufacture itself, such as
embroidery thread or the leather used in certain shoes (see Exhibit 7 for the various shoe parts).
These suppliers, for which New Balance is a major client, employ an estimated 7,000 people in
the U.S. 3 Moreover, its factories in small U.S. cities are vital to local economies: for instance, in
Skowhegan, Maine, a town of 8,500, it is the largest employer in the region and its presence
supports a wide range of small businesses, such as restaurants. The fate of whole towns and
communities is tied to the manufacturing presence of New Balance in their region. 4
During the consultation meetings with Froman, New Balance reps expressed fierce opposition to
tariff reductions on Vietnamese imports. According to their spokesperson, Matt LeBretton, it is
already 25% to 35% more expensive to produce in the United States than in Vietnam. A tariff
reduction is not necessary to make manufacturing activities viable in Vietnam and would only
chip away at the tariff buffer that allows New Balance to produce in America. 5 This, in turn,
would force New Balance to close its U.S. factories and move all of its production facilities
overseas. Thousands of jobs would be lost, in addition to hurting the company’s U.S. contractors
and the small communities in which the company has manufacturing operations.
1 See Aeppel, op. cit.
2 See Martin, op. cit.
3 New Balance Athletic Shoe, Inc., “Made in the USA,” n.d. (accessed October 17, 2013).
4 See Martin, op. cit.
5 See Aeppel, op. cit.
© HEC Montréal 6
This document is authorized for use only in International Business by Maria Morfin Guttierrez at HEC Montréal from 2020/11/16 to 2021/06/01.Nike versus New Balance: Trade Policy in a World of Global Value Chains
Nike Inc.
Nike Inc. is a public company headquartered in Beaverton, Oregon, and the largest athletic
footwear and athletic apparel company in the world in terms of sales, 1 with over $24 billion in
revenues for a total gross profit of over US$10 billion in 2012. 2 Its high profit margins (43.4% in
2012) have been reflected in the price of its shares, whose value increased an average of 17%
annually between 2003 and 2013. 3 Nike Inc. offers a wide variety of products in seven key
categories: running, basketball, soccer, men’s training, women’s training, action sports, and Nike
Sportswear. 4 In addition to the Nike brand, it also owns a few other highly popular apparel and
sporting equipment brands such as Hurley, Converse, and Bauer Nike Hockey. Nike Inc. directly
employs 37,715 people worldwide, but indirectly employs a much larger workforce in factories
owned by contractors who may manufacture products for numerous companies including Nike
Inc. 5
Nike Inc. was founded in 1964 as Blue Ribbon Sports by two partners, Phil Knight and Bill
Bowerman. They started as distributors of Japanese-made Tiger (now Asics) running shoes, but
as the relationship between the firm and its Japanese supplier began to sour in the early 1970s,
Knight and Bowerman decided it was time to start manufacturing their own shoes. The new line
of Nike shoes debuted in 1972 for the U.S. Track & Field Trials, where Bowerman’s innovative
design – a very light outsole with waffle-type nubs for traction – was a great success. Then, in
1979, Nike Inc. innovated once more by introducing its Nike Air technology in running shoes,
paving the way for its IPO a year later. The firm quickly grew to become the industry leader;
however, unlike New Balance, Nike Inc. didn’t position itself in the booming fitness sector and
thus lost ground to its competitors.
These difficulties were overcome by major marketing campaigns in the mid-eighties − first in
1985, when Michael Jordan, a young NBA rookie at the time, endorsed the company, and then in
1987, when the iconic Air Max commercial featuring the Beatles song Revolution was aired. By
the end of the eighties, Nike Inc. had regained its title of largest footwear company in the world.
Marketing then became a large part of Nike Inc.’s business strategy: in 1995, the firm sponsored
the Brazil National Soccer Team and supplied its uniforms. One year later, a young golfer named
Tiger Woods was signed for a reported annual compensation of $5 million. The company
continued to expand, innovate, and skilfully market its products throughout the next decade. In
2012, it became the official sponsor of the National Football League (NFL). 6
None of Nike Inc.’s 37,715 employees, roughly half of whom work in the United States, 7 are
factory workers. Rather, they are mostly involved in providing headquarter services, designing
and engineering new equipment, promoting products, and selling them in Nike stores. As with
1 Barbara Brenner, Bodo B. Schlegelmilch, and Björn Ambos, “Inside the NIKE matrix,” in The New Role of Regional
Management, Björn Ambos and Bodo B. Schlegelmilch (Ed.), Hampshire, Palgrave Macmillan, 2010.
2 Yahoo! Finance, “Nike, Inc. (NKE),” 2013 (accessed October 17, 2013).
3 Google Finance, “Nike Inc (NYSE:NKE),” 2013 (accessed October 17, 2013).
4 NYSE Euronext, “Nike Inc.,” 2013 (accessed October 17, 2013).
5 Nike Inc., Corporate Responsibility Report, 2012 (accessed October 17, 2013).
6 Nike Inc., “History & Heritage,” n.d. (accessed October 17, 2013).
7 Nike Inc., Corporate Responsibility Report, 2009 (accessed October 17, 2013).
© HEC Montréal 7
This document is authorized for use only in International Business by Maria Morfin Guttierrez at HEC Montréal from 2020/11/16 to 2021/06/01.Nike versus New Balance: Trade Policy in a World of Global Value Chains
most U.S. footwear companies (with the notable exception of New Balance), shoe manufacturing
has been almost completely outsourced to foreign contractors in Mexico, Brazil, Argentina, Italy,
Bosnia, India, China, South Korea, Japan, Indonesia, Taiwan, and Vietnam. 1 In August 2013, it
was estimated that Nike’s external contractors employed more than a million people in
774 factories in 42 countries. Vietnam supplies the most workers to Nike, with over 310,000
people producing footwear, apparel, and sporting equipment, followed by China and Indonesia,
where contractors employ about 260,000 and 175,000 people respectively. Three quarters of
Nike’s global workforce is located in these three countries (see Exhibit 8).
Contrary to New Balance, Nike Inc. was a strong supporter of reducing import tariffs, predicting
that U.S. footwear manufacturers would be able to save on production costs and reinvest their
savings in modern, high-value-added jobs in the United States. As Erin Dobson, a Nike Inc.
spokesperson said, “The question comes down to, is one kind of job more important than
another? What are the jobs for the 21st century? They’re not necessarily jobs that existed 30 years
ago.” 2
Nike Inc. also argued that being able to offshore footwear production without being penalized by
tariffs would help to offset rising foreign labour and material costs, which would in turn make
footwear more affordable to U.S. consumers. As argued by Oregon’s Representative Earl
Blumenauer, whose constituency is home to Nike employees as well as the U.S. headquarters of
Adidas, keeping the tariffs taxes millions of Americans on their footwear purchases to keep a few
thousand manufacturing jobs. 3 This argument is especially compelling when one considers that
99% of the footwear purchased in the U.S. is produced in other countries.
Eliminating Footwear Tariffs – A Blessing or a Curse?
Through his numerous meetings with lobbyists, industry spokespeople, and activists, Froman was
able to map the major arguments for and against the elimination of footwear import tariffs under
the TPP. While his determination to level the playing field so that Americans could compete in
the global economy never faltered, it became obvious to him that no decision would have a
purely positive impact on every stakeholder. Numerous realities and potential impacts had to be
considered since adopting the wrong position could have ripple effects throughout the U.S.
economy.
As the daylight faded, Froman was still pondering the various statistics and viewpoints. Should
he side with New Balance and insist that footwear tariff reductions be kept off the negotiating
table? Or would the elimination of tariffs as advocated by Nike Inc. be more beneficial to U.S.
interests? Should the United States impose conditions on Vietnam for reducing footwear tariffs?
His phone rang, and the numbers were still dancing in his head as he heard the beep indicating
that he had joined the conference call.
2014-11-14
1 Nike Inc., “Global Manufacturing,” 2013 (accessed October 17, 2013).
2 See Martin, op. cit.
3 Ibid.
© HEC Montréal 8
This document is authorized for use only in International Business by Maria Morfin Guttierrez at HEC Montréal from 2020/11/16 to 2021/06/01.Nike versus New Balance: Trade Policy in a World of Global Value Chains
Exhibit 1
The 12 Negotiating Parties to the Transpacific Partnership
Source: Office of the United States Trade Representative, “The United States in the Trans-Pacific Partnership,” 2011
(accessed October 17, 2013)
© HEC Montréal 9
This document is authorized for use only in International Business by Maria Morfin Guttierrez at HEC Montréal from 2020/11/16 to 2021/06/01.Nike versus New Balance: Trade Policy in a World of Global Value Chains
Exhibit 2
Production Occupations and Total Employment in the U.S., 1999-2012
Source: Bureau of Labor Statistics, “Occupational Employment Statistics,” 2013 (accessed October 17, 2013)
© HEC Montréal 10
This document is authorized for use only in International Business by Maria Morfin Guttierrez at HEC Montréal from 2020/11/16 to 2021/06/01.Nike versus New Balance: Trade Policy in a World of Global Value Chains
Exhibit 3
U.S. Occupations in the Footwear Industry, 2003-2012
Office and
Production Management
Total administrative
occupations occupations
support occupations
Average Average Average Average
# # # #
Year hourly hourly hourly hourly
workers workers workers workers
wage wage wage wage
2003 19,440 12.26 14,040 10.48 1,900 12.25 620 43.72
2004 19,170 13.14 12,120 10.35 2,410 12.79 810 42.77
2005 18,410 13.24 12,170 10.81 2,350 13.00 620 43.38
2006 17,340 13.77 12,300 11.31 1,930 13.51 600 44.66
2007 15,760 13.87 12,150 11.75 1,170 13.42 470 44.14
2008 16,290 14.40 12,650 12.21 1,100 14.47 490 46.56
2009 15,420 14.43 12,030 12.32 980 15.06 440 48.14
2010 13,790 15.89 9,770 12.56 1,170 15.73 470 54.62
2011 13,650 16.25 9,600 12.76 1,260 15.81 470 56.50
2012 13,290 17.61 8,340 12.70 1,420 15.87 590 56.23
Source: Bureau of Labor Statistics, “Occupational Employment Statistics,” 2013 (accessed October 17, 2013)
© HEC Montréal 11
This document is authorized for use only in International Business by Maria Morfin Guttierrez at HEC Montréal from 2020/11/16 to 2021/06/01.Nike versus New Balance: Trade Policy in a World of Global Value Chains
Exhibit 4
U.S. Footwear Market Value and Growth, 2008
Source: Marketline, U.S. Footwear in the United States, March 2013
© HEC Montréal 12
This document is authorized for use only in International Business by Maria Morfin Guttierrez at HEC Montréal from 2020/11/16 to 2021/06/01.Nike versus New Balance: Trade Policy in a World of Global Value Chains
Exhibit 5
Growth of U.S. Footwear Imports, by Country of Origin, 1997-2012
Share of U.S.
footwear imports
U.S. Footwear imports
(US$ Millions) Compound Annual (%)
Growth (%)
Country 1997 2012 1997-2012 1997 2012
China 7,737 17,876 5.74 53.03 71.90
Vietnam 102 2,512 23.83 0.70 10.11
Italy 1,244 1,230 -0.07 8.53 4.95
Indonesia 1,139 982 -0.99 7.81 3.95
Mexico 393 497 1.57 2.69 2.00
Rest of the world 3,560 1,233 3.62 27.24 7.09
Source: United Nations Comtrade Database: http://comtrade.un.org/
© HEC Montréal 13
This document is authorized for use only in International Business by Maria Morfin Guttierrez at HEC Montréal from 2020/11/16 to 2021/06/01.Nike versus New Balance: Trade Policy in a World of Global Value Chains
Exhibit 6
Import Duty on a Pair of Athletic Shoes That Do Not Cover the Ankles with
Outer Soles of Rubber, Plastics, Leather or Composition Leather, and Have a
F.O.B. Value of More Than $6.50
Tariff Rate
Harmonized Most
Textile KORUS
System Favoured NAFTA
Upper FTA
Code Nation
F.O.B. value 20% + 90
6404.11.89 0% 0%
< $12 cents per pair
F.O.B. value
6404.11.90 20% 0% 20%
> $12
Leather
6403.99.90 10% 0% 0%
upper
Source: United States International Trade Commission, “Harmonized Tariff Schedule of the United States,” 2013
(accessed October 17, 2013)
© HEC Montréal 14
This document is authorized for use only in International Business by Maria Morfin Guttierrez at HEC Montréal from 2020/11/16 to 2021/06/01.Nike versus New Balance: Trade Policy in a World of Global Value Chains
Exhibit 7
A New Balance Shoe Made in the United States
Source: Timothy Aeppel, “New Balance Sweats Push to End U.S. Shoe Tariffs,” Wall Street Journal, February 27,
2013 (accessed October 17, 2013)
© HEC Montréal 15
This document is authorized for use only in International Business by Maria Morfin Guttierrez at HEC Montréal from 2020/11/16 to 2021/06/01.Nike versus New Balance: Trade Policy in a World of Global Value Chains
Exhibit 8
Nike Inc.’s Manufacturing Network
(data as of August 2013)
Global production Footwear production
Number Number Workers
Country Workers of Workers of (Nike
factories factories brand)
Vietnam 312,828 70 231,420 29 193,169
China 263,108 213 129,920 38 119,654
Indonesia 174,259 42 131,958 20 117,452
United States 13,670 65 77 2 0
Total (including
1,005,547 774 528,509 163 459,307
other countries
Source: Nike Inc., “Global Manufacturing,” 2013 (accessed October 17, 2013)
These statistics do not indicate the number of workers that are employed by Nike Inc., but rather the number
of workers that are involved in the production of Nike Inc. products.
© HEC Montréal 16
This document is authorized for use only in International Business by Maria Morfin Guttierrez at HEC Montréal from 2020/11/16 to 2021/06/01.You can also read