Investor Update FY18 Half-Year Presentation - Toyota Australia
←
→
Page content transcription
If your browser does not render page correctly, please read the page content below
Investor Update
FY18 Half-Year Presentation

                              Toyota Kluger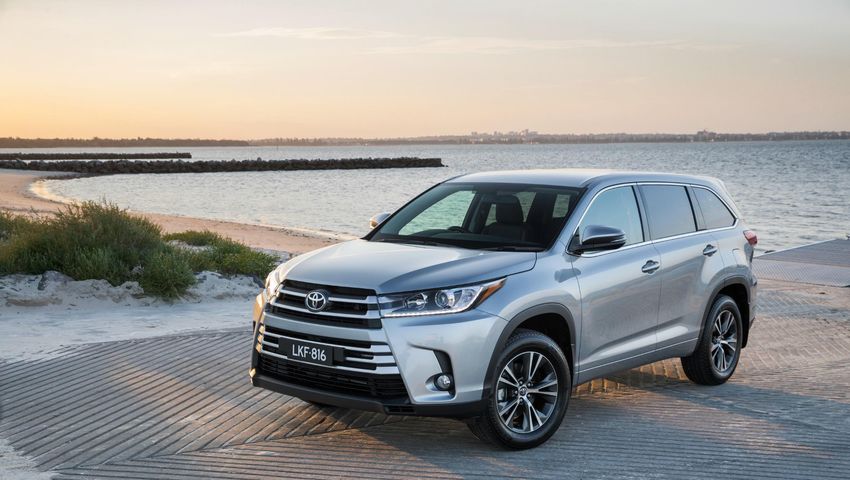
Investor Relations           Agenda

Page |     Topic

3    |     Disclaimer

6    |     The Global Toyota Group

13   |     Toyota in Australia

21   |     Toyota Finance Australia

34   |     Investment Highlights

                                               Toyota Corolla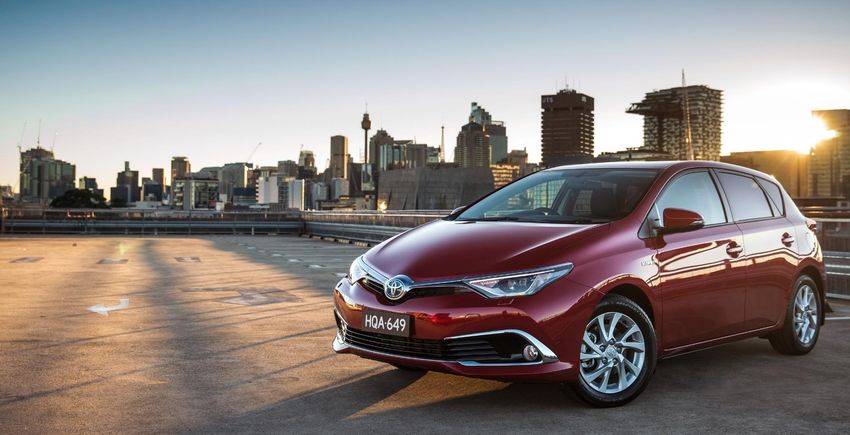
Disclaimer

The information in this presentation is an overview of certain information relating to Toyota Motor Corporation (“TMC”) and its subsidiaries (including Toyota Finance Australia
Limited (ABN 48 002 435 181) (“TFA”) and Toyota Motor Corporation Australia Limited (“TMCA”)) (together, the “Toyota Companies”). It has been prepared, and is authorised, by
TFA and TMCA. TFA is expressly not responsible for information in this presentation relating to TMCA.

This presentation is being provided solely for your information, and may not be distributed to any other person, and may not be reproduced in any form, in whole or in part. Failure
to comply with this restriction may constitute a violation of applicable securities laws. No reliance may be placed for any purposes whatsoever on the information contained in this
presentation or any other material discussed verbally or on its completeness, accuracy or fairness. No representation or warranty, expressed or implied, is given by, or on behalf of,
the Toyota Companies or any of the Toyota Companies’ directors, officers or employees or any other person as to the accuracy or completeness of the information or opinions
contained in this document and no liability whatsoever by the Toyota Companies or any of the Toyota Companies’ directors, officers or employees or any other person for any loss
howsoever arising, directly or indirectly, from any use of such information or opinions or otherwise arising in connection therewith. The information in this presentation is subject
to verification, completion and change.

This presentation is not a prospectus or offering document and does not constitute or form part of and should not be construed as, an offer to sell or issue or the invitation or
solicitation of an offer to buy or acquire securities or other financial products of any of the Toyota Companies (including TFA) in any jurisdiction or an inducement to enter into
investment activity in any jurisdiction. Neither this presentation nor any part thereof, nor the fact of its distribution, shall form the basis of, or be relied on in connection with, any
contract or commitment or investment decision whatsoever. Investors and prospective investors in the securities or other financial products of any of the Toyota Companies
(including TFA) are required to make their own independent investigation and appraisal of the business and financial condition of the Toyota Companies and the nature of the
securities and other financial products. This presentation does not constitute a recommendation regarding securities or other financial products of any of the Toyota Companies
(including TFA). Any prospective purchaser of securities or other financial products of any of the Toyota Companies (including TFA) is recommended to seek its own independent
financial advice.

The distribution and use of this presentation may be restricted by law in certain jurisdictions and is not provided to any person in any jurisdiction where it is unlawful to do so.
Recipients of this presentation should inform themselves about them and observe any such restrictions. TFA does not represent that this presentation may be lawfully distributed
in compliance with any applicable registration or other requirements in any such jurisdiction where action for that purpose is required, or under an exemption available in that
jurisdiction, nor does it assume any responsibility for facilitating any such distribution. In particular, no action has been taken by TFA or any other person which would permit
distribution of this presentation in any jurisdiction where action for that purpose is required.

3

Disclaimer

This presentation is intended for distribution only to financial institutions and professional investors only in circumstances where disclosure is not required under Part 6D.2 or 7.9
of the Corporations Act 2001 of Australia (the “Corporations Act”), and otherwise only as may be permitted by applicable law. The information must not, and is not intended to be,
given to any “retail client” within the meaning of section 761G of the Corporations Act. The information in this presentation is a summary only and is not complete. It does not
amount to an express or implied recommendation or a statement of opinion (or a report or either of those things) with respect to any investment in any of the Toyota Companies
nor does it constitute financial product advice.

No action has been made or will be taken that would permit a public offering of any securities described herein. This presentation is made to and directed only at (i) persons outside
the United Kingdom, (ii) qualified investors or investment professionals falling within Article 19(5) and Article 49(2)(a) to (d) of the Financial Services and Markets Act 2000
(Financial Promotion) Order 2005 (the “Order”), (iii) high net worth individuals, and other persons to whom it may lawfully be communicated, falling within Article 49(2)(a) to (d) of
the Order, (iv) persons who are “qualified investors” within the meaning of Article 2(1)(e) of the Prospectus Directive (Directive 2003/71/EC as amended by Directive 2010/73/EU)
(“qualified investors”), (such persons at (i) through (iv) collectively being referred to as “Relevant Persons”). Any person who acquires securities in any offer or to whom any offer
of any securities is made will be deemed to have represented and agreed that it is a Relevant Person. By receiving or accessing this presentation you acknowledge that you will be
solely responsible for your own assessment of the market and the market position of the Toyota Companies and that you will conduct your own analysis and be solely responsible
for forming your own opinion of the potential future performance of the Toyota Companies’ business and in all cases are capable of being categorised as a Professional Client or
Eligible Counterparty for the purposes of the UK Financial Conduct Authority’s conduct of business rules (such persons being referred to as “Relevant Persons”). This presentation
must not be acted or relied on by persons who are not Relevant Persons.

This presentation is an advertisement and not a prospectus and investors should not subscribe for or purchase any securities of TFA issued under its Euro Medium Term Note
Programme referred to in this presentation or otherwise, except on the basis of information in the base prospectus of Toyota Motor Finance (Netherlands) B.V., Toyota Credit
Canada Inc., Toyota Finance Australia Limited and Toyota Motor Credit Corporation dated 8 September 2017, as supplemented from time to time, together with the applicable final
terms which are or will be, as applicable, available on the website of the London Stock Exchange plc at www.londonstockexchange.com/exchange/news/market-news/market-
news-home.html.

Neither this presentation nor any copy of it, nor the information contained herein, in whole or in part, may be taken or transmitted into, or distributed, directly or indirectly to the
United States or to any U.S person (as defined under Regulation S under the U.S. Securities Act of 1933, as amended (“the Securities Act”). Any failure to comply with this
restriction may constitute a violation of U.S. securities laws. This presentation does not constitute, and should not be construed as, an offer to sell or the solicitation of an offer to
buy securities in the United States as defined in Regulation S under the Securities Act or to any U.S. person. No securities of TFA have been, or will be, registered under the
Securities Act or the securities laws of any state of the United States.

4

Disclaimer

Matters discussed in this presentation may constitute forward-looking statements. Forward-looking statements are statements other than in respect of historical facts. The
words “believe”, “expect”, “anticipate”, “intends”, “estimate”, “will”, “may”, "continue”, “should” and similar expressions identify forward-looking statements. Forward-looking
statements include statements regarding: objectives, goals, strategies, outlook and growth prospects; future plans, events or performance and potential for future growth; liquidity,
capital resources and capital expenditures; economic outlook and industry trends; developments of the Toyota Companies’ markets; the impact of regulatory initiatives; and the
strength of the Toyota Companies’ competitors. The forward-looking statements in this presentation are based upon various assumptions, many of which are based, in turn, upon
further assumptions, including without limitation, management’s examination of historical operating trends, data contained in the Toyota Companies’ records and other data
available from third parties. Although TFA believes that these assumptions were reasonable when made, these assumptions are inherently subject to significant known and
unknown risks, uncertainties, contingencies and other important factors which are difficult or impossible to predict and are beyond its control. Such risks, uncertainties,
contingencies and other important factors could cause the actual results, performance or achievements of the Toyota Companies or industry results to differ materially from those
results expressed or implied in this presentation by such forward-looking statements.

The information, opinions and forward-looking statements contained in this presentation speak only as at the date of this presentation, and are subject to change without notice.
The Toyota Companies and their agents, employees or advisers do not intend to, and expressly disclaim any duty, undertaking or obligation to, make or disseminate any supplement,
amendment, update or revision to any of the information, opinions or forward-looking statements contained in this presentation to reflect any change in events, conditions or
circumstances. By attending any presentation to which this document relates or by accessing this presentation you will be taken to have represented, warranted and undertaken
that (a) you are a Relevant Person (as defined above), and (b) you have read and agree to comply with the contents of this notice.

In this presentation, TFA presents certain financial measures which are not defined under Australian Accounting Standards and Interpretations issued by the Australian Accounting
Standards Board as well as the Corporations Act and comply with the International Financial Reporting Standards (“IFRS”) as issued by the International Accounting Standards
Board but are key indicators used by management to assess operational performance. These measures are presented because TFA believes that they and similar measures are
widely used in the Toyota Companies’ industry as a means of evaluating operating performance. Accordingly, this information has been presented to permit a more complete and
comprehensive analysis of TFA’s operating performance, consistent with how the Toyota Companies’ business performance is evaluated by management. However, these
measures may not be comparable to similarly titled measures used by other companies and are not measurements under IFRS or any other body of generally accepted accounting
principles, and thus should not be considered substitutes for the information contained in TFA’s audited consolidated financial statements for the year ended 31 March 2017 and
TFA’s interim financial statements for the half year ended 30 September 2017.

This presentation includes references to credit ratings and, accordingly, this presentation should not be distributed to or accessed by any persons who are not able to receive such
information in accordance with applicable law. Credit ratings provided by third-party credit rating agencies may not reflect all risks of an investment in securities or other financial
products and may be subject to revision or withdrawal at any time.

5
The Global Toyota Group

                          Toyota 86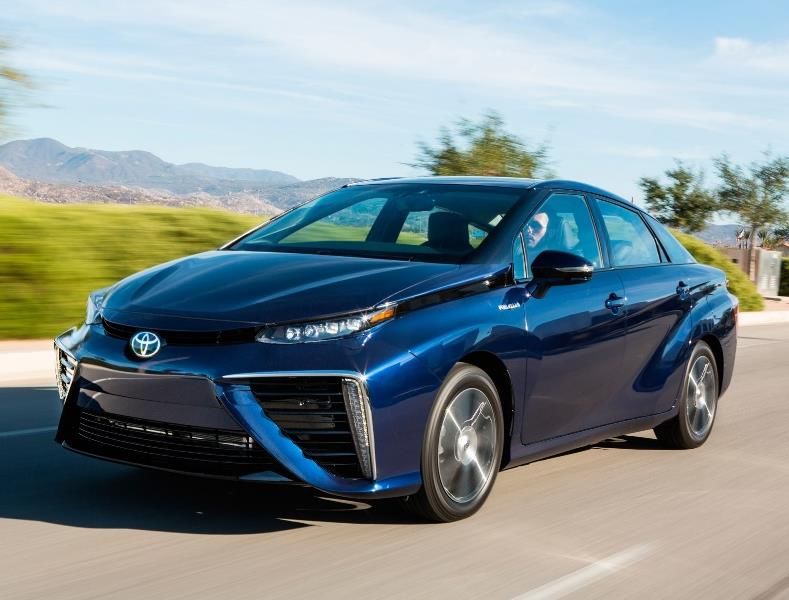
Toyota Motor Corporation                                  Vision and group structure

                                                              Toyota Global Vision
| Toyota will lead the way to the future of mobility, enriching lives around the world with the safest and most responsible ways of moving people

| Through our commitment to quality, constant innovation and respect for the planet, we aim to exceed expectations and be rewarded with a smile

| We will meet our challenging goals by engaging the talent and passion of people, who believe there is always a better way

  7
Toyota Motor Corporation                                                        Toyota vehicle production

Toyota today
Ι     Operating for over 80 years and a global leader in mobility

Ι     Toyota vehicle sales reached a high of 9.2 million units in 2016

Ι     Continued expansion in vehicle manufacturing capabilities

Ι     Global manufacturing presence and extensive sales network

    Source:
       8 http://www.toyota-global.com/pages/contents/company/profile/overview/pdf/companyprofile_2017e.pdf as at June 2017
Toyota Motor Corporation                                          Consolidated Financial Results

                                                                              Fiscal Year Ended March 31,

             (JPY Billions)                                      2015            2016            2017       2018 H1
             Net revenues                                       27,234.5        28,403.1       27,597.2     14,191.2

             Operating income                                   2,750.6         2,854.0         1,994.4     1,096.5

             Net income                                         2,173.3         2,312.7         1,831.1     1,071.3

Source:
   9 TMC FY2015, FY2016, FY2017 & FY2018 Q2 Financial Summary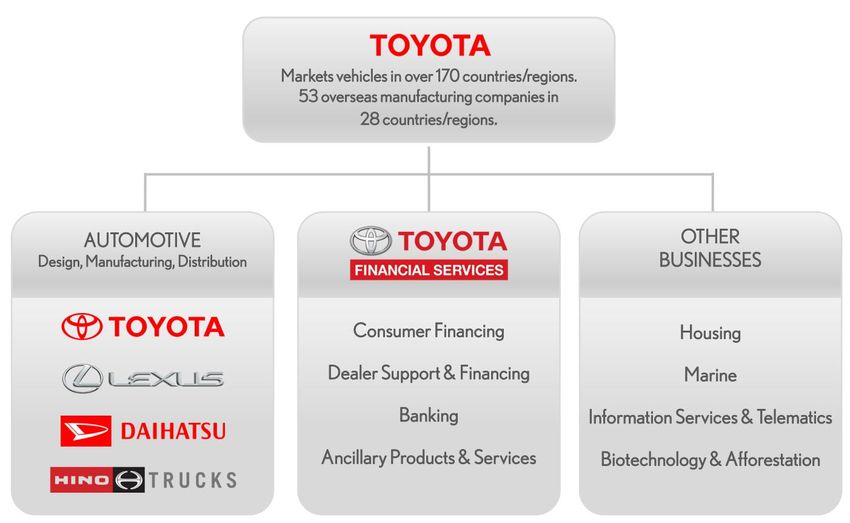
Toyota Motor Corporation                                       Consolidated Balance Sheet

                                                                                  Fiscal Year Ended March 31,
   (JPY Billions)
                                                                 2015               2016              2017      2018 H1

   Current assets                                               17,936.4           18,209.6          17,833.7   18,125.7

   Noncurrent finance receivables (net)                         9,202.5            8,642.9           9,012.2    9,563.9

   Investment & other assets                                    11,295.2           10,834.7          11,707.2   12,179.3

   Property, plant & equipment (net)                            9,295.7            9,740.4           10,197.1   10,384.2

   Total assets                                                 47,729.8           47,427.6          48,750.2   50,253.0

   Total liabilities                                            30,082.5           29,339.4          30,081.2   30,846.8

   Total equity*                                                17,647.3           18,088.2          18,669.0   19,406.2

   Total liabilities & equity                                   47,729.8           47,427.6          48,750.2   50,253.0

*Total equity = Total shareholders’ equity + Mezzanine equity
Source:
  10 TMC FY2015, FY2016, FY2017 & FY2018 Q2 Financial Summary
Toyota Financial Services Global presence
Europe/Africa Asia/Pacific Americas
Germany Czech Australia Vietnam United States of America (U.S.A)
United Kingdom (U.K.) Denmark New Zealand India Puerto Rico
Finland Hungary Thailand Japan Canada
Italy Spain Malaysia Brazil
Norway Slovakia Philippines Venezuela
France Russia Taiwan Mexico
Sweden Kazakhstan China Argentina
Poland Portugal Korea
South Africa Netherlands Indonesia
11Toyota Financial Services Select entities
TMC
Toyota Motor Corporation
TFSC
Toyota Financial Services
Corporation
TFSIC TCCI TMFNL TFA
Toyota Financial Services Toyota Motor Finance Toyota Finance Australia
International Corporation Toyota Credit Canada Inc.
Netherlands B.V. Limited
TMCC
Toyota Motor Credit
Corporation
Ι TMCC, TCCI, TMFNL and TFA are named issuers under the €50,000,000,000 Euro Medium Term Note Programme.
Ι TMCC, TMFNL and TFA are named issuers under the A$10,000,000 Debt Issuance Programme.Toyota in Australia
13
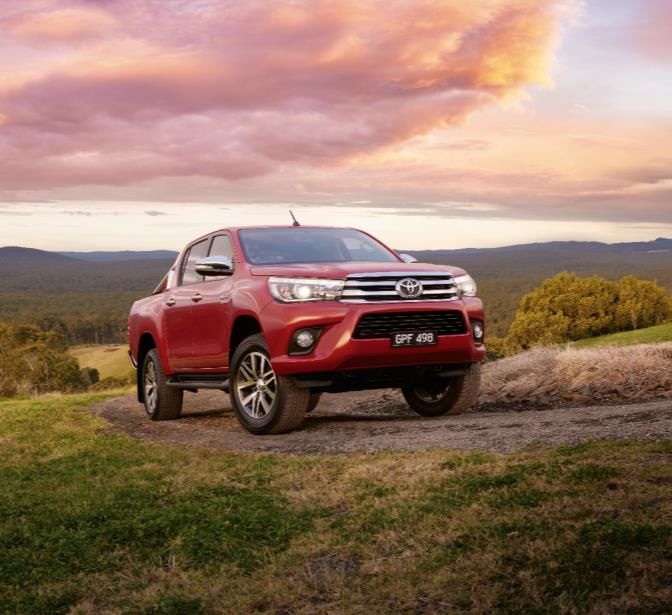
Toyota HiluxToyota in Australia Value chain
Toyota Motor Corporation Australia Limited
Ι Sales , marketing & distribution
Ι Manufacturing* & purchasing
Ι Product planning & development
ONE
Toyota Finance Australia Limited
Ι Retail and wholesale finance & insurance
TOYOTA Ι
Ι
Fleet management
Guest experience
Toyota Dealer Network
Ι New and used vehicle sales
Ι Servicing & repairs
Ι Guest experience
* Australian
14 Manufacturing operations ceased in October 2017Toyota Motor Corporation Australia Australian market trend
Ι Australian vehicle market has shown solid long-term growth
Ι 2016 Market an all time record above 1.17 million vehicles sold
Ι 2017 YTD performance continue to demonstrate the industry’s strength
1,400,000
1,155K 1,178K
1,200,000 1,112K 1,136K 1,113K
1,050K 1,036K
988K 1,012K 1,008K
New Vehicle Sales (units)
956K 963K 937K
1,000,000
800,000
692K
600,000
640K
637K
609K
609K
598K
597K
592K
582K
577K
574K
570K
566K
559K
541K
535K
531K
516K
486K
400,000
449K
443K
415K
413K
397K
382K
379K
376K
364K
200,000
-
2004 2005 2006 2007 2008 2009 2010 2011 2012 2013 2014 2015 2016 2017
(YTD)
Passenger Commercial
Source:
15 Actual and 2017 calendar year-to-date data based on VFACTS Industry Reports to October 2017 published by Federal Chamber of Automotive IndustriesToyota Motor Corporation Australia Toyota’s market leadership
Ι Toyota* remains the market leader in an industry demonstrating long term growth Market Share – YTD
Toyota*
Mazda
Ι 15 consecutive years as Australia’s top selling brand Hyundai 19.6%
19.1%
Holden
Ι 19.1% YTD Market Share as at October 2017
Ford
Mitsubishi 3.8%
9.9%
Volkswagen 4.5%
Nissan 4.7%
Kia 8.3%
4.8%
Subaru
Honda 4.8% 7.1%
6.6% 6.7%
Other
Australian Vehicle Sales
350
300
246
245
Units Sold ('000)
225
222
221
219
215
211
250
207
188
188
200
150
147
100
133
130
126
120
118
115
114
112
108
106
105
104
103
103
102
102
101
100
98
97
97
95
94
92
91
90
88
87
87
85
50
82
81
80
80
80
78
78
70
70
66
63
50
45
-
2007 2008 2009 2010 2011 2012 2013 2014 2015 2016 2017
Toyota* Mazda Hyundai Holden Ford (YTD)
* Toyota includes Toyota and Lexus marques
16 VFACTS Industry Reports to October 2017 published by Federal Chamber of Automotive Industries
Source:Toyota Motor Corporation Australia Overview
Key Facts Closure of Manufacturing operations
Employees 4,129* Ι Toyota Australia closed the Altona Manufacturing
plant in October 2017
Net profit after tax $99m
Ι Business transition to a sales & distribution company
Net sales $8.7b
Community investment $3.8m Ι Workforce expected to reduce to approx. 1,300
Vehicles manufactured 87,466
Vehicles sold 209,995**
Vehicles exported 55,445
Ι The DRIVE program provides employees with
information, resources and access to training and
Toyota Australia Production (1963 – 2017) further education. It also provides job seeking and
preparation support for employment post October
Camry 2,168,104
2017.
Corolla 601,104
Ι Employee career choices include:
Corona 336,197 Ι Transport and warehousing 24%
Ι IT and telecommunications 19%
Aurion 184,180 Ι Healthcare 18%
Ι Property and construction 16%
Other 161,530
Ι Hospitality and retail 13%
Total 3,451,115 Ι Education and training 10%
Source: Toyota Sustainability Report 2017
Source: http://www.toyota.com.au/news/toyota-australia-closes-manufacturing-operations
Figures stated are for the period 1 April 2016 to 31 March 2017, except greenhouse gas emissions which is for 1 July 2015 to 30 June 2016
* Full time equivalent including contractors.
** 17
Toyota and Lexus branded vehiclesToyota Motor Corporation Australia Top selling vehicle models
TOYOTA CAMRY
Ι Australia’s best-selling mid-size car for 23 consecutive years
Ι 2016 Segment share of 51.8%
Ι 2017 YTD Segment Share of 58.3%
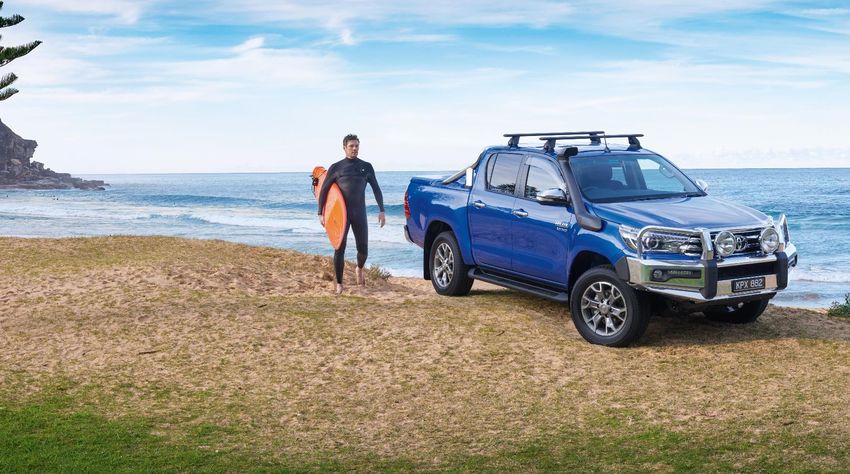
TOYOTA HILUX
Ι Top selling vehicle in Australia in 2016
Ι First time a commercial vehicle secured top seller
Ι Australia’s best-selling 4WD vehicle for 11 consecutive years
TOYOTA COROLLA
Ι Top selling vehicle in Australia for the previous 3 years (2013 - 2015)
Ι #2 selling car in Australia in 2016
Ι Best selling passenger vehicle in 2016
18 VFACTS Industry Reports to October 2017 published by Federal Chamber of Automotive Industries
Source:Toyota Motor Corporation Australia New to Australia in 2017
| C-HR Manual 2WD | | C-HR CVT 2WD | | C-HR CVT AWD | | Koba 2WD | | Koba AWD |
Design Performance Technology
Ι Driver-focused cockpit Ι Finely-tuned performance Ι Information at a glance
Ι Stylish alloys all around Ι Advanced turbo engine Ι Premium technology is standard
Ι Turns heads Ι Dynamic handling
19Toyota Motor Corporation Australia Vehicle innovation
Ι Toyota’s Global Environment Challenge 2050 is to reduce
vehicle CO2 emissions by 90 per cent by 2050, in comparison
with 2010 levels
Ι In 2017 Toyota sold its ten millionth hybrid car globally,
including 96,822 Toyota and Lexus hybrid vehicles sold in
Australia to date (as at 1 April 2017)
Toyota Mirai - fuel cell vehicle
Ι Powered exclusively by hydrogen
Ι Only emits water vapour
Ι Cruising range approx. 550kms
Ι Sold in Japan, the United States and Europe
in areas supported by a refuelling
infrastructure
Ι Australia does not currently have the
infrastructure to support fuel cell vehicles
20
Source: Toyota Sustainability Report 2016 and 2017Toyota Finance Australia Overview
Products and Services Business Highlights
Ι Established in 1982, TFA is a leading provider of
Retail Finance Fleet Management automotive finance and insurance in Australia
•Consumer Loans •Finance products Ι TFA is a captive financier with dominant market share that
•Commercial Finance •Fleet Management continues to drive strong revenue and vehicle sales
•Guaranteed Future •Vehicle Maintenance
Value •Novated Leasing Ι Increase in earning assets year on year to over A$16b
•Salary Packaging
Ι Pre-tax income averaging A$187m over the past 5 years(1)
Ι Growing profitability in the Fleet Management segment
with a portfolio of over 100,000 vehicles(2)
Dealer Finance Insurance
•Wholesale •Comprehensive
•Real Estate •Extended Warranty
•Working Capital •Finance Protection
•Revolving Credit Lines •Finance Gap
•Roadside Assistance
(1) For the five year period from FY13 through FY17; A$142m + $215m + $198m + $227m + $154m = $936m
(2) Australian Fleet Lessor Association as at June 2017
21Toyota Finance Australia Toyota network in Australia
Sales Network
Ι 230 Dealers (208 Toyota and 22 Lexus)
Ι 307 Physical Dealership sites
Ι TMCA HQ, 4 Regional Offices and Toyota WA
Toyota Finance Australia Coverage
Ι 6 Regional Offices
Ι 99% of the Toyota network
Ι 100% of the Lexus network
Ι 100% of the Hino network
| Toyota, your essential partner throughout Australia |
All 22
figures as at November 2017Toyota Finance Australia Asset composition
Segment Assets in AUD billions Retail Fleet Other
(Net of Provisions)
17.49
16.81
15.43 15.62 1.47
1.77
14.10
1.88 1.77 2.61
13.02 2.42
0.81
2.54 2.34
2.57
2.54
12.61 13.42
10.72 11.00 11.51
10.17
2013 2014 2015 2016 2017 2018 H1
Retail segment is comprised of loans and leases to personal and commercial customers including wholesale finance consisting of loans and bailment facilities to motor vehicle dealerships.
Fleet segment is comprised of loans and leases to small business and fleet customers consisting of medium to large commercial clients and government bodies.
Source: TFA Annual Financial Reports 2013, 2014, 2015, 2016, 2017 and Interim Financial Statements for the Half Year ending 30 September 2017
Note:
23 Numbers displayed may not add due to rounding.Toyota Finance Australia Retail segment
Products and Services Overview
Ι One of Australia’s leading vehicle financiers with 35 years experience
Consumer
Ι Fixed rate consumer loan Ι Dominant finance provider for both Toyota and Non-Toyota(2) vehicles
Ι Toyota Access (GFV) and Franchises
Ι Novated lease(1)
Ι Long standing partnership with the Australian Dealer Network
Commercial Ι Strong market share and finance penetration
Ι Business vehicle loan
Ι Toyota Access (GFV)
Ι Focused on Guest experience and retention
Ι Lease products(1)
Toyota Access
Wholesale
Ι Real estate capital loans
Ι Bailment facilities and insurance
Ι Working capital
Insurance
Ι Motor vehicle insurance
Ι Extended warranty
Ι Finance protection
Ι Finance gap
Ι Roadside assistance
(1) Lease products (Novated Lease, Finance Lease) are administered through Toyota Fleet Management
24 (2) TFA’s Power Torque brand was established for non-Toyota Franchises in 2008Toyota Finance Australia Fleet segment
Products and Services Overview
Ι Largest Fleet Management business of the Toyota Group
Ι Australia’s only end-to-end fleet solution through One Toyota
Ι Variety of distribution channels
Ι Ongoing development of innovative products such as Forcefield
Telematics, Car Sharing and the DriverDirect app
Ι Diversified fleet customer portfolio across various industries
25Toyota Finance Australia Financial performance Income Statement* Fiscal Year Ended March 31, A$ millions 2013 2014 2015 2016 2017 2018 H1 Financing revenue & similar revenue 842 859 1,106 1,067 1,055 540 Less: Financing expense & similar charges (556) (504) (717) (672) (724) (347) Net Financing revenue 286 355 389 395 331 194 Plus: Other income 23 31 32 34 23 26 Net Operating income 309 386 421 428 354 220 Profit before income tax 142 215 198 227 154 133 Net profit after tax 102 154 141 159 107 94 * TFA does not hedge account. Changes in the fair value of derivatives are recognized immediately in profit or loss. This may, to the extent that derivatives are not offset by the translation of the items economically hedged, introduce volatility in profit or loss and produce anomalous results Source: TFA Annual Financial Reports 2013, 2014, 2015, 2016, 2017 and Interim Financial Statements for the Half Year ending 30 September 2017 26
Toyota Finance Australia                                                                Asset quality

                                             Credit Risk                                                  Overview
                        Total impairment loss                        Provision for impairment
                                                                                                          Ι        Credit losses averaging A$56.1m over the past 5 years
  250M
                                                     204M
                                                                         194M
  200M
                168M               173M
                                                                                          190M
                                                                                                          Ι        Provision for impairment established on objective evidence

  150M                                                                                                    Ι        Credit Risk Committee is responsible for risk assessment,
  100M                                                87M
                                                                                                                   ongoing management, collection, enforcement and write-off
                 54M                                                     58M                                       monies lent by the company
                                    43M                                                    40M
   50M

     0M
                2013               2014              2015                2016             2017

                          Arrears (61-90 days past due exposure)                                                                         Arrears (over 90 days past due exposure)
                                                   Retail    Fleet                                                                                             Retail   Fleet

  100M                                                                                                              100M                                          87M
                                                                                                                                                                                71M    67M
   80M                                                63M                                                            80M
                                                                                                                                                         58M
                                                                          51M               49M                                    51M
   60M                              45M                                                                              60M

   40M           26M                                                                                                 40M

   20M                                                                                                               20M

    0M                                                                                                                 0M
                2013               2014               2015                2016             2017                                   2013               2014        2015           2016   2017

Arrears measured as amount past due exposure on loans and receivables which includes unimpaired and impaired amounts. Values displayed in AUD millions
Source:
   27 TFA Annual Financial Reports 2013, 2014, 2015, 2016 and 2017
Toyota Finance Australia Credit decisioning & collections
Ι TFA has been a leader in automotive industry in application scorecards since 2001
Ι Use of scorecards ensure consistent underwriting produced in the Retail portfolio
AML/CTF/PEPS/
Sanctions
Fraudcheck Behaviour Score
Existing Customers Comprehensive
Bureau Tools
Application
Requesting Finance
Credit Decision
New Customers
Fraud Score
Application Score
Ι Fleet and Dealer applications assessed by Underwriters with industry expertise
Ι Automation of Collections Activities (new collections system implemented in Nov 14) improves efficiency as well as
reinforces compliance with guidelines and regulations
Ι Continuous optimisation strategies that enable loss mitigation include a risk based collection segmentation model
and Champion/Challenger testing
28Toyota Finance Australia Funding overview
Overview (1) (2) Total Debt by product in A$m (1)(*)
Ι Issuing into domestic and international capital markets Domestic commercial paper 968
Euro commercial paper 1,456
Ι Diverse currency mix including: AUD, HKD, USD, GBP, NZD
US commercial paper 1,033
Ι Range of tenors to match assets (1 month to 5+ years) Euro medium term note 5,831
Ι Established presence in Uridashi markets Domestic medium term note 1,298
Bank Loans & Other * 2,564
Ι Access to Private Securitisation programs
Securitisation * 3,146
Frequent Issuer - Capital Markets Issuances (2)
A$250m A$119m A$300m US$315m A$250m HK$276m US$40m A$150m
5yr EMTN 4yr Uridashi 5yr DMTN 1.5yr EMTN 1yr DMTN 5yr EMTN 1yr EMTN 5yr EMTN
Feb-17 Apr-17 May-17 Jun-17 Jul-17 Aug-17 Oct-17 Nov-17
US$79.5m / US$30m / US$108.2m /
A$127.7m GB£25m HK$400m Ongoing CP
A$95.6m
3.5yr Uridashi 1yr EMTNs 5yr EMTN issuance
4yr Uridashi Oct-17
Mar-17 Apr-17 Aug-17
2017
* Refers
29 to debt measured as at 31 March 2017. All other debt measured as at 30 September 2017. Values are displayed in AUD millions.
Source(1): TFA Annual Financial Report 2017 and Interim Financial Statements for the Half Year ending 30 September 2017.
Source(2): BloombergToyota Finance Australia Credit Support Agreements
Ι Securities* issued by TFA (and various other TFSC subsidiaries) have the benefit of a
Toyota Motor Corporation credit support agreement with TFSC
(TMC)
Ι TFSC will continue to own 100% of TFA
Ι TFSC will cause TFA to maintain a tangible net worth of at least A$150,000 as long as
covered securities are outstanding
Ι If TFA determines it will be unable to meet its payment obligations on any covered securities,
TFSC will make sufficient funds available to TFA to ensure that all payment obligations are
paid as due
Toyota Financial Services Corporation Ι Agreement cannot be terminated until (1) repayment of all outstanding covered securities or
(TFSC) (2) each rating agency requested by Toyota to provide a rating has confirmed no change in
rating of all such securities
Ι TFSC in turn has the benefit of a credit support agreement with TMC
Ι Same key features as TFSC/TFA credit support agreement
Ι TMC will cause TFSC to maintain a tangible net worth of at least JPY 10 million as long as
covered securities are outstanding
Toyota Finance Australia Limited Ι TFSC’s and/or TMC’s credit support obligations will rank pari passu with all other
(TFA) senior unsecured debt obligations
* “Securities”
30 defined as outstanding bonds, debentures, notes and other investment securities and commercial paper, but does not include asset-backed securities issued by TFA’s securitisation trusts.Toyota Finance Australia Credit ratings
Standard & Poor’s Moody’s
Long Term Short Term Long Term Short Term
Toyota Motor Corporation AA- A-1+ Aa3 P-1
Toyota Finance Australia Limited
AA- A-1+ Aa3 P-1
Outlook Stable Stable
Source:
31 Bloomberg Credit Rating Profile as at 20 November 2017.Toyota Finance Australia Funding strengths
Ι Exceptional liquidity supported by strong balance sheet
| Diverse
Ι Access to US$15b syndicated bank credit facility
| Sustainable
Ι Diverse and sustainable funding program
Ι Maintaining funding diversity via access to domestic and international
markets
| Relationships
Ι Demonstrated capacity to securitise assets
Ι Issuing into strong demand with attractive deals
Ι Responding quickly to opportunities and finesse in execution
Ι Identifying & developing new markets and investor relationships
Ι Long-term approach to maintaining strong business and
stakeholder relationships
32Toyota Finance Australia Liquidity
Master Credit Facility (US$15 billion) | Resilient
Ι Access to US$5 billion 364 day syndicated bank credit facility
Ι Access to US$5 billion 3 year syndicated bank credit facility
Ι Access to US$5 billion 5 year syndicated bank credit facility | Strong
Commercial Paper Program
Ι A-1+ / P-1 rated domestic, euro and US commercial paper programs | Stable
Securitisation Program
(1)
Ι A$1.2 billion of available liquidity from private securitisation programs
Cash and Cash Equivalents
(2)
Ι A$1.3 billion in short-term liquidity and investments
Debt Capital Markets & Intercompany Lending
Ι Access to various domestic and international capital markets
Ι Credit Support Agreements from TMC – TFSC - TFA
Source: TFA Annual Financial Report 2017, TFA Annual Securities Report 2017
(1) Unutilised limit as at March 31, 2017
(2)33
Cash and cash equivalents as at March 31, 2017Toyota Finance Australia Investment highlights
Strength of One Toyota
Ι Established business model and consistent market leader
Ι Strategic coordination on a local and global scale
Ι Continued financial strength and strong operating performance
Ι Ongoing investment in technology, facilities and risk management
Ι Part of a world class company and a global leader
Ι Operates under the renowned ‘Toyota Way’ principles
Our stakeholder management
Ι Focused on guest retention and customer satisfaction
Ι Engaged workforce and experienced leadership team
Ι Sustainable approach to our stakeholder relations be it our
business partners, our communities or our investors
34Contact
Email: Investorrelations@Toyota.com.au
Website: www.toyota.com.au/finance
Toyota CorollaYou can also read