The state of Aboriginal, Torres Strait Islander, Māori and Pacific Peoples research - Clarivate
←
→
Page content transcription
If your browser does not render page correctly, please read the page content below
September 2020

The state of Aboriginal, Torres
Strait Islander, Māori and
Pacific Peoples research
Table of contents

Introduction .......................................................................................................................... 2
Citation analysis and bibliometric methodologies in research assessment .......................... 3
Metric definitions ................................................................................................................. 4
   Number of Web of Science documents......................................................................................... 4
   Percentage of documents in top 1% ............................................................................................. 4
   Percentage of documents in the top 10% ..................................................................................... 4
   Category Normalised Citation Impact (CNCI) ................................................................................ 4
   Percentage of International Collaborations .................................................................................. 5
   Percentage of documents in Q1 journals ...................................................................................... 5
   Percentage all open access documents......................................................................................... 5
   Journal Impact Factor ................................................................................................................... 5
The current state of Indigenous Research ............................................................................ 6
Organisational breakdown ................................................................................................... 7
   How do academic organisations compare in Indigenous Research? ............................................. 7
   What do organisational co-authorship networks look like in Indigenous Research? .................... 9
   How do the states perform in Indigenous Research? ................................................................. 10
Researcher breakdown ....................................................................................................... 12
   People in Australia and New Zealand publishing in Indigenous Research .................................. 12
   What do author networks look like for people publishing in Indigenous Research? .................. 14
Which fields of research are publishing Indigenous Research? .......................................... 15
Which journals are publishing Indigenous Research?......................................................... 17
The new field of research schema for Indigenous Research ............................................... 19
   Topic level mapping of articles in Indigenous Research .............................................................. 19
   Bibliographic coupling and co-citation analysis for clustering articles in Indigenous Research... 21
Summary ............................................................................................................................ 23
About Clarivate................................................................................................................... 23

                                                                                                                                            1
Introduction
In 2019, the Australian and New Zealand Standard Research Classification (ANZSRC) was reviewed
and the classification of research disciplines changed, creating new Field/Objective (6-digit), Group
(4-digit), and Division (2-digit) Fields of Research (FoR) codes, released 30 June 2020. One of the
major considerations of the review was whether the previous FoR classification of Aboriginal, Torres
Strait Islander, Māori and Pacific Peoples research was sufficient or appropriate to broadly classify
and analyse Indigenous research. After consultation, the Australian Research Council (ARC),
Australian Bureau of Statistics, Stats NZ and the Ministry for Business, Innovation and Employment
(MBIE) have jointly reviewed the ANZSRC. The review provided a comprehensive assessment of the
research classification and revised it where appropriate to reflect current practice and changes in
the sector. It highlighted several key findings which included:

    -   lack of visibility, and therefore recognition, of Aboriginal, Torres Strait Islander, Māori and
        Pacific Peoples research, impeding strategy, policy and funding decisions in this area.
    -   a reduced ability for people of Indigenous communities to identify and therefore access
        research and data that focuses on them.
    -   noteworthy growth in Indigenous Research and the previous classifications significantly
        under-represents the breadth and scope of emerging Aboriginal, Torres Strait Islander,
        Māori and Pacific Peoples research.

To address the key findings, the new FoR code classification includes a new Division (2-digit) of code
titled “45 – Indigenous Studies” allowing for flexibility for Aboriginal, Torres Strait Islander, Māori
and Pacific Peoples research to be captured. The classifying Groups (4-digit) codes are structured so
that 20 groups now exist starting with a 45, with 18 of these groups organised such that 1)
Aboriginal, Torres Strait Islander, 2) Māori and 3) Pacific Peoples research can be classified into one
of the six areas below.

    •   Culture, Language and History (4501, 4507, 4513)
    •   Education (4502, 4508, 4514)
    •   Environmental Knowledges (4503, 4509, 4515)
    •   Health and Wellbeing (4504, 4510, 4516)
    •   Society and Community (4505, 4511, 4518)
    •   Sciences (4506, 4512, 4517)

The final two codes include Indigenous research otherwise not captured, “4519 – Indigenous Data,
Methodologies and Global Indigenous Studies” and “4520 – Other Indigenous Studies”. Finally, a much
wider range (320 in total) of Fields (6-digit) were designed to reflect the unique methodologies and
approaches to Indigenous Research.

The aim of this report is to provide an overview of the current trends in Indigenous Research across
the Australia, New Zealand and Pacific Region. We look at the academics, affiliate institutions and
regions that are contributing largely to this body of work and in which journals this research is being
published. We also consider the networks that exist between authors and institutions in Indigenous
research. The report then evaluates how the new FoR classifications will perform in structuring
Indigenous Research for assessment.

                                                                                                          2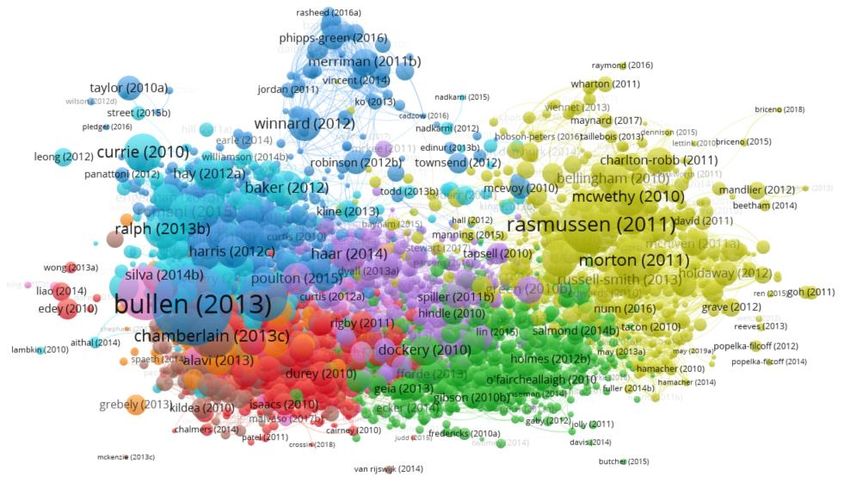
Citation analysis and bibliometric methodologies in research
assessment
Every research paper can be considered a countable end product of research in its final and public
form, citing the work of other researchers as an indicator of scientific impact. The term ‘citation
analysis’ refers to the analysis of data derived from several references cited in various bibliographies
and/or footnotes of academic publications.
Citation analysis has proved to be a powerful and popular method of examining and mapping
intellectual impact at various levels, including that of a paper, individual researcher,
faculty/department, institution or region. Citation analysis can be used across all academic content
but generally holds more value when used within a specific area of research.
This report takes content from the Web of Science Core Collection™ topic search performed in
August 2020, which included any Article, Review, Meeting Abstract or Proceeding Paper indexed in
the Web of Science Core Collection with a publication date between 2010-2019. The search criteria
included a topic search that comprises the title, abstract or keywords of each article. It should also
be noted that this search took a very unadventurous approach to capturing Indigenous Research.
After consultation with the Australian research sector, it was decided that a search criteria would be
used that only captures research relevant to the new FoR codes rather using broader search terms
(capturing more work) and then individually removing articles that are not within the intended
scope for the new Indigenous FoR codes.
Topic = "Indigenous Australia" OR "Indigenous New Zealand" OR “Māori” OR “Aboriginal” OR "Torres
Strait"
Publication Year = 2010-2019
Document Type = Article, Review, Meeting Abstract or Proceedings Paper
Country Region of at least one Author Affiliation = “Australia” OR “New Zealand”

Note: Records published outside of journals considered by the Australian Research Council (ARC) in
the 2018 Excellence in Research for Australia (ERA) journal list were not considered in this report.
Also, 21 records were removed manually as they focused on subject matter unrelated to the focus of
research within this report e.g. ‘Maori Potato Starch’ or similar. This left a total of 8,427 publications
in the dataset (see Appendix for a list of individual articles)

 In 2019 around 66% of Indigenous
 Australians aged 20-24 years had attained
 Year 12 or equivalent compared to around
 90% for non-Indigenous Australians.
                                                        – Closing the Gap report, Australian Government 2020

                                                                                                         3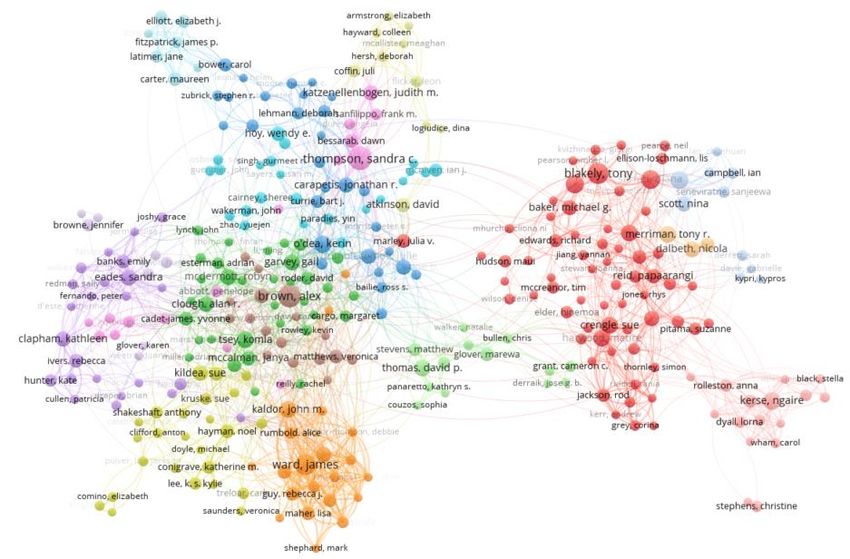
Metric definitions
The following metrics will be used throughout the report to help shape insight into the state of
Indigenous Research across the Australian, New Zealand or Pacific Region.

Number of Web of Science documents
Total volume of publication is often an indication of the size of an organisation or region. In
this report, volume output is the total number of articles, reviews, meeting abstracts or
proceedings published from 2010-2019, unless otherwise specified.

Percentage of documents in top 1%
The % documents in top 1% indicator reflects the top one percent most cited documents in a given
subject category, year and publication type divided by the total number of documents in a given set
of documents, displayed as a percentage. A higher value is considered to be higher performance. A
value of 1 for a set of documents indicates that one percent of the publications in that set are in the
top one percent of the world regardless of subject, year and document type and would therefore be
considered to be performing at the same level as world average.

A value above 1 indicates that more than one percent of papers in the set are in the top one percent
of the world, and a value of less than 1 would indicates that less than one percent of the papers in
the set are in the top one percent of the world. For this report we have normalised using the
traditional FoR 2-Digit Divisions for subject areas unless otherwise specified.

Percentage of documents in the top 10%
The % documents in top 10% indicator is the top ten percent most cited documents in a given
subject category, year and publication type divided by the total number of documents in a given set
of documents, displayed as a percentage. The % documents in top 10% is very similar to the %
documents in top 1% simply with a threshold of 10 percent instead of one percent. For this report
we have normalised using the traditional FoR 2-Digit Divisions for subject categories unless
otherwise specified.

Category Normalised Citation Impact (CNCI)
The Category Normalised Citation Impact of a document is calculated by dividing the actual count of
citing items by the expected citation rate for documents with the same document type, year of
publication and subject area. When a document is assigned to more than one subject area an
average of the ratios of the actual to expected citations is used. The CNCI of a set of documents, for
example the collected works of an institution or country/region, is the average of the CNCI values for
all the documents in the set.

CNCI is a valuable and unbiased indicator of impact irrespective of age, subject focus of document
type. A CNCI value of 1 represents performance at par with world average, values above 1 are
considered above average and values below 1 are considered below average. For this report we
have normalised using the traditional FoR 2-Digit Divisions for subject areas unless otherwise
specified.

                                                                                                      4
Percentage of International Collaborations
The % of international collaborations measured by co-authorships is the number of international
Collaborations for an entity divided by the total number of documents for the same entity
represented as a percentage. In assigning papers to Australia and New Zealand as a whole or to any
of its component regions, this analysis employed whole counting, rather than fractional counting.
That is, any nation, author, or institution listed on a given paper receives equal publication and
citation credit, as opposed to any fractional-counting scheme that attempts to weigh specific levels
of contribution.
“The term ‘Indigenous’ is problematic, in
that it appears to collectivize many
distinct populations whose experiences
under imperialism have been vastly
different”
– Linda Tuhiwai Smith, Decolonizing Methodologies: Research and Indigenous Peoples.
Percentage of documents in Q1 journals
The Journal Impact Factor quartile is the quotient of a journal’s rank in the Web of Science category
(X) and the total number of journals in the category (Y). A journal in Quartile 1 (Q1) has a percentile
less than 0.25. The % of documents that appear in a journal of a particular Journal Impact Factor
Quartile, is the ratio of documents appearing in this quartiles journal over the whole set (displayed
as a percentage). Note that the % of documents or records published in Q1 journals is generally
larger than 25% as top journals generally publish more records.
Percentage all open access documents
Open access status is provided across the Web of Science platform as a result of a partnership with
ImpactStory, a not-for-profit organization that recently launched a knowledgebase of Open Access
(OA) content. This knowledgebase makes it possible to discover and link to legal Gold or Bronze (free
content at a publisher's website) and Green (e.g., author self-archived in a repository) OA versions.
The % of Open Access Documents includes any document that can be found freely and legally
through these means as a proportion of the total number of documents
Journal Impact Factor
The Journal Impact Factor™ is defined as all citations to the journal in the current JCR year to items
published in the previous two years, divided by the total number of scholarly items (these comprise
articles, reviews, and proceedings papers) published in the journal in the previous two years.
5The current state of Indigenous Research
Looking at the set of Indigenous Research produced across the Australian, New Zealand and Pacific
region in the last 10 years, there are several stand out indicators. To begin with, the total proportion
of research that is produced by the Australian and New Zealand region and is considered as directly
related to Indigenous Research by this report, makes up just over 1% (1.04%) of the total output
(Table 1). The proportion of research that is considered Indigenous does vary depending on the
origin of the research (see Table 3).
Examining the citation impact, when normalising Indigenous Research across 2 Digit FoR codes,
Indigenous Research has a significantly lower citation impact than global or regional baselines.
Indigenous Research has a Category Normalised Citation Impact (CNCI) of 0.65 when the baseline
CNCI for Australian and New Zealand research is more than twice that in the 2010-2019 period
(1.34). This trend is also evident when looking at the percentage of documents in the top 1 or 10% of
documents. Only 4.4% of Indigenous Research is in the top 10% of documents globally whereas the
region produces about 12.6% of their research in the top 10%.
When reading through this report it is important to recognise that the proportion of research we
consider to be ‘Indigenous Research’ is relatively small compared to all scholarly research. Further,
as the citation impact indicators of Indigenous Research are generally lower than global averages,
there should be a realignment of expectations in the report’s content of the bibliometric impact of
this research. This report’s scope will look only at the citation impact of Indigenous Research,
although the author recognises that there are many forms of impact from novel research, this report
only considers and assesses citation impact.
# of Times % Docs % in Q1 % Docs in % Docs in % Inter % Open
Name Docs Cited CNCI Cited Journals Top 1% Top 10% Collab Acc Docs
INDIGENOUS RESEARCH 8427 61188 0.65 79.03 30.04 0.13 4.41 15.36 29.48
AUSTRALIA 5936 43647 0.67 78.37 28.95 0.10 4.82 15.26 30.88
NEW ZEALAND 2829 21355 0.63 81.23 34.88 0.25 4.03 25.42 27.08
ALL RECORDS 917901 1,4090669 1.34 75.84 53.34 1.78 12.61 47.29 29.71
AUSTRALIA 810865 12687120 1.36 75.74 53.88 1.84 12.94 47.62 30.16
NEW ZEALAND 127965 1961850 1.36 77.77 50.86 1.78 11.63 53.95 28.31
COMPARISON 1.04% 0.43% 0.69 3.19 23.30 1.65 8.20 31.93 0.23
AUSTRALIA
Proportion / Delta 0.73% 0.34% 0.69 2.63 24.93 1.74 8.12 32.36 0.72
NEW ZEALAND
Proportion / Delta 2.21% 1.09% 0.73 3.46 15.98 1.53 7.60 28.53 1.23
Table 1. Displays basic bibliometric indicators on two regions outputs across the Indigenous Research set and compares the
volume and performance to all areas of research within each region. Note The ‘Number of Docs’ and ‘Times Cited’ comparisons
are proportions whereas the rest are showing a change (red = down, green = up) from All Research to Indigenous Research.
6Organisational breakdown
How do academic organisations compare in Indigenous Research?
Comparing organisations across the Australian and New Zealand region that produce
Indigenous Research, there are 21 organisations that have contributed more than 200
documents to this research in the last 10 years (Table 2). The University of Auckland,
University of Sydney and University of Otago have produced the largest portion of research
by volume and have received more citations to their records than any other organisation.
With regards to the bibliometric impact, University of Waikato, Griffith University, James
Cook University, and Monash University have not only produced over 200 documents, but
also, these institutes stand out as having the most impactful research with over 6.0% of
their documents in the top 10%, compared to a dataset average of 4.4% (Figure 1). All also
have a CNCI greater than 0.75 compared with a global baseline of the set of 0.65.
Although this area of research does not generally have a large international network,
organisations based in New Zealand and the University of Queensland tend to collaborate
more often with overseas entities. Charles Darwin University is the fourth biggest producer
of this content (with 696 documents) but more fascinatingly, CDU is the most open with
their research in this area, with almost 50% of their documents freely and legally available
to readers, without paid subscriptions (Table 2).
Monash University
James Cook University
Griffith University
University of Waikato
University of Queensland
University of Western Australia
University of Sydney
Charles Darwin University University of Auckland
University of Otago
Figure 1. Displays total research output (x-axis) of academic organisations when publishing in Indigenous Research (2010-
2019). Also displayed are the % of documents in the top 10% (y-axis) and the % of documents published in a Q1 journal (point
radius). When assessing the volumes of research output at the institutional and/or national level, certain factors need to be
considered, such as the publication practices and the field of research or focus for the institution or country.
7# of Times % Docs % in Q1 % Docs in % Docs in % Inter % Open
Name Country Docs Cited CNCI Cited Journals Top 1% Top 10% Collab Acc Docs
All Records (Indigenous Research) …….. 8427 61188 0.65 79.03 30.04 0.13 4.41 15.36 29.48
University of Auckland NEW ZEALAND 1064 9824 0.75 84.59 34.38 0.38 4.98 25.56 29.51
University of Sydney AUSTRALIA 840 7377 0.74 79.29 30.61 0.12 5.48 19.76 40.36
University of Otago NEW ZEALAND 827 8538 0.74 84.64 41.33 0.36 4.72 30.11 35.79
Charles Darwin University AUSTRALIA 696 6812 0.77 84.34 37.10 0.14 5.32 13.07 47.70
University of Western Australia AUSTRALIA 689 6332 0.76 80.84 34.17 0.15 5.52 12.48 38.32
University of Queensland AUSTRALIA 634 5283 0.75 80.13 31.85 0.16 5.84 23.82 34.70
University of Melbourne AUSTRALIA 571 5056 0.75 83.36 30.38 0.18 5.08 18.04 35.90
University of New South Wales Sydney AUSTRALIA 559 4774 0.72 79.07 29.18 0.36 5.19 15.03 36.67
James Cook University AUSTRALIA 466 4348 0.84 86.05 30.53 0.64 7.30 15.02 43.78
Australian National University AUSTRALIA 414 2868 0.76 81.16 25.48 0.24 5.56 16.91 30.68
Flinders University South Australia AUSTRALIA 370 2337 0.65 79.73 27.42 0.00 3.78 10.54 38.92
Monash University AUSTRALIA 351 3006 0.94 83.48 33.59 0.57 7.98 16.81 34.19
Massey University NEW ZEALAND 344 2273 0.63 81.98 41.82 0.29 4.36 26.45 28.49
University of Adelaide AUSTRALIA 302 2474 0.70 78.48 33.08 0.33 5.30 17.88 33.77
University of South Australia AUSTRALIA 281 2346 0.71 83.99 31.65 0.00 2.85 12.81 45.20
Curtin University AUSTRALIA 278 2590 0.72 84.89 31.44 0.36 5.40 11.51 32.73
Griffith University AUSTRALIA 254 2141 0.80 80.71 36.65 0.00 7.09 20.87 41.34
Victoria University Wellington NEW ZEALAND 252 1548 0.63 80.95 25.00 0.00 4.37 28.57 21.43
University of Newcastle AUSTRALIA 243 2132 0.63 76.13 25.62 0.00 4.12 13.99 41.98
University of Waikato NEW ZEALAND 229 1392 0.78 80.79 29.46 0.87 6.11 23.14 28.38
Auckland University of Technology NEW ZEALAND 223 1380 0.57 72.65 40.27 0.45 3.14 27.35 26.01
La Trobe University AUSTRALIA 172 1054 0.72 72.09 29.79 0.00 8.72 13.95 29.07
Macquarie University AUSTRALIA 165 1237 0.80 80.61 28.70 0.00 7.88 20.61 21.82
Western Sydney University AUSTRALIA 148 872 0.61 85.14 19.83 0.00 2.03 23.65 44.59
University of Wollongong AUSTRALIA 148 1101 0.68 79.73 31.93 0.00 4.73 8.78 42.57
Table 2. The number of documents published by each university (top 25 by volume) in Indigenous Research since 2010 in the Australia and New Zealand
region and performance indicators on the dataset.
8What do organisational co-authorship networks look like in Indigenous Research?
In this section we explore the relationships between institutions, and those organisations’ authors
that have affiliated themselves on Indigenous Research records. Simply considering the prevalence
of co-authorship of organisations on these records, and displaying a high prevalence with a close
proximity, we can immediately see organisations within each of the two nations (Australia and New
Zealand) clustering separately, displaying a geographic divide (Figure 2).
It may be that there is an expected divide between the nations’ academic organisations and the way
they collaborate, particularly in Indigenous Research; however of the 600 most prominent
relationships between these organisations, more than 50 of these relationships cross the Tasman
Sea and exist between institutions based in distinct countries.
It is also clear that the organisations that are central to the networks that exist in Indigenous
Research are University of Sydney, James Cook University and Charles Darwin University.
These universities appear at the ‘heart’ of the Australian body of Indigenous Research and seem to
generally be at the centre of Indigenous Research’s development. The same can be said for the
University of Auckland, University of Waikato and University of Otago in the New Zealand. These
universities seem to be at the centre of the Indigenous Research ecosystem of each of the
corresponding countries (Figure 2).
There are several organisations outside of the university sector that appear to be an essential part of
the Indigenous Research ecosystem. These include several research institutes, including the Baker
Heart and Diabetes Institute and the South Australian Health and Medical Research Institute
(SAHMRI). There are also a few hospitals that are engrained in this network including Auckland City
Hospital and Starship Children’s Hospital in New Zealand and Royal Children’s Hospital Melbourne
and Royal Brisbane & Woman’s Hospital in Australia.
Figure 2. Displays the relationships between organisations in the Indigenous Research set of publications. An organisation must
have been by-lined on at least 15 documents from the set to be displayed (leaving 142 organisations in total). Collaborative lines
are drawn between the 600 most common organisational collaborations across the set of publications. Image produced using
VoSviewer 2020
9How do the states perform in Indigenous Research?
Two of the major considerations for the development of the new Indigenous Fields of Research
codes is that:
• there is noteworthy growth in Indigenous Research and
• the previous classifications significantly under-represented the breadth and scope of
emerging Aboriginal, Torres Strait Islander, Māori and Pacific Peoples research.
It is true that in the last ten years, the volume of Indigenous Research produced in both Australia
and New Zealand has almost doubled (Figure 3). 604 documents were produced in this set in 2010
and a total of 1155 were published in 2019 (91% increase). Australia has gone from 416 documents
in 2010 to 814 documents in 2019 (96% increase) whereas New Zealand has gone from 211
documents published in 2010 to 391 documents in 2019 (85% increase). This can be compared to all
research, where Australia has increased by 70% and New Zealand by 45%.
All states and regions of Australia and New Zealand contribute to Indigenous Research; however, the
volume and impact of the research varies across each region. Even more variability exists in the
proportion of the total scholarly output that has been dedicated to Indigenous Research from each
region. New Zealand (considered as a region in of itself) has produced a larger number of research
outputs in Indigenous Research than any one of the Australian states of territories. This may be a
result of New Zealand having a larger Māori population than Aboriginal Australia. In the 2010-2019
period, New Zealand dedicated 2.21% of its research outputs to Indigenous Research (Table 3). This
proportion is larger than any of the Australian states or territories except for the Northern Territory,
where 29.5% of the population is Indigenous Australian, which in the same period dedicated 12.96%
of its research. The Northern Territory also makes this research freely and legally available to
readers more often with 43.0% of their outputs open access.
Figure 3. Displays the trend in number of documents in Indigenous Research produced across state and country regions in the
2010-2019 period.
10# of Times % Docs in % Inter % Open % Total % Indigenous
State/Region Docs Cited CNCI Top 10% Collab Acc Docs Research Population
NEW ZEALAND 2829 21355 0.63 4.03 25.42 27.08 2.21 16.5 (Māori)
NSW 2182 17126 0.70 5.13 16.59 33.78 0.75 3.5
QLD 1726 14639 0.75 5.97 18.83 37.43 1.04 4.6
VIC 1468 11550 0.75 5.65 17.57 33.11 0.57 0.9
WA 1043 8620 0.74 5.75 13.42 35.76 1.15 3.9
NT 960 9037 0.71 4.58 11.77 43.02 12.96 29.5
SA 911 6912 0.69 3.84 15.26 38.86 1.17 2.5
ACT 581 4332 0.77 5.85 17.04 30.46 1.01 1.9
TAS 155 1281 0.63 3.23 22.58 33.55 0.66 5.5
Table 3. The number of documents published by each region in Indigenous Research since 2010 and performance and proportion
indicators on the set. Note The proportion of total research is taken in comparison to total research outputs published from each
region according to Web of Science, and the proportion of Indigenous Population is taken from the 2016 Census (Aus) or 2018
Census (NZ).
When looking at the proportion of high impact research, generally New Zealand’s Indigenous
Research performs less well than the Australian states. A larger portion of the research produced by
New Zealand in Indigenous Research tends to have a below average CNCI (between 0 – 0.5) than any
of the Australian states (Figure 4). So, although New Zealand generally produces more Indigenous
Research, it could be argued that the normalised citation metrics of this research are not generally
performing as well as Australian regions publishing Indigenous related research.
Figure 4. Displays the impact profile of each of the top 5 states or regions (by volume) in Indigenous Research. The proportion
of research produced by each state is broken down into the percentage of the research is either ‘Uncited’ or falls into windows
of Normalised Citation Impact.
11Researcher breakdown
People in Australia and New Zealand publishing in Indigenous Research
There are 25 people based in Australia or New Zealand who have co-authored more than 35
documents within the dataset produced at the start of the report (Table 4). Professor Alex Brown,
currently based at the University of Adelaide and the South Australian Health and Medical
Research Institute (SAHMRI), has contributed to the largest number of documents (84 in total). Of
the top 25 researchers (by volume output) 12 of them are female and 13 of them male. Although
this analysis considers documents across the course of researcher’s careers, the University of
Western Australia currently employs 4 of the top 25 researchers, while the University of Auckland,
University of Otago and University of Adelaide currently each employ 3 of the top 25 (Table 4).
In general, when normalised across their categorised 2-Digit Divisions, the citation metrics of
Indigenous research does not perform above average levels overall. There are two researchers in
this group that stand out as having both a CNCI and a % of documents in the top 10% above the
global averages, they are Professor Jonathan Carapetis of University of Western Australia and
Professor Nicola Dalbeth of the University of Auckland (Figure 5).
Prof Nicola Dalbeth
Prof Jonathan Carapetis
Prof Wendy Hoy
Prof Sandra Eades Prof Alex Brown
Figure 5. Displays total research output (x-axis) at Australian or New Zealand researchers when publishing in Indigenous
Research (2010-2019). Also displayed are the total number of documents in the top 10% (y-axis) and the % of documents with
an international collaborator (point radius). When assessing the volumes of research output at the institutional and/or national
level, certain factors need to be considered, such as the publication practices and the field of research or focus for the institution
or country.
12# of Times % Docs % in Q1 % Docs in % Docs in % Inter % Open
Name Institution Docs Cited CNCI Cited Journals Top 1% Top 10% Collab Acc Docs
All Records …….. 8427 61188 0.65 79.03 30.04 0.13 4.41 15.36 29.48
Brown, Alex University of Adelaide/SAHMRI 84 1015 0.87 90.48 36.14 0.00 4.76 23.81 59.52
Eades, Sandra University of Melbourne 67 851 0.78 89.55 40.32 0.00 4.48 19.40 64.18
Ward, James SAHMRI 59 546 0.54 89.83 21.82 0.00 0.00 1.69 47.46
Blakely, Tony University of Otago 59 973 0.98 96.61 67.35 0.00 5.08 40.68 49.15
Bailie, Ross University of Sydney 58 739 0.86 94.83 26.92 0.00 5.17 6.90 70.69
Hoy, Wendy E. University of Queensland 56 394 0.76 69.64 12.73 0.00 8.93 7.14 39.29
Thompson, Sandra University of Western Australia 50 706 0.79 88.00 36.17 0.00 4.00 8.00 64.00
Sibley, Chris G. University of Auckland 48 514 0.80 91.67 40.00 0.00 8.33 20.83 14.58
Sarfati, Diana University of Otago 47 620 0.79 91.49 47.22 0.00 4.26 34.04 40.43
Carapetis, Jonathan R. University of Western Australia 46 853 1.69 95.65 48.89 2.17 13.04 13.04 52.17
Katzenellenbogen, Judith University of Western Australia 43 350 0.80 76.74 39.53 0.00 4.65 2.33 44.19
Kerse, Ngaire University of Auckland 42 343 0.54 88.10 36.67 0.00 4.76 33.33 38.10
Garvey, Gail Charles Darwin University 41 170 0.59 85.37 45.71 0.00 2.44 17.07 41.46
Guy, Rebecca J. University of New South Wales 40 470 0.67 95.00 23.08 0.00 0.00 0.00 37.50
Lawrenson, Ross University of Waikato 40 318 0.64 95.00 35.71 0.00 0.00 30.00 45.00
Atkinson, David University of Western Australia 40 348 0.55 72.50 33.33 0.00 0.00 10.00 52.50
Clough, Alan R. James Cook University 37 295 0.74 83.78 25.00 0.00 5.41 24.32 64.86
Brimblecombe, Julie Monash University 37 297 0.71 89.19 27.27 0.00 5.41 10.81 70.27
Jamieson, Lisa University of Adelaide 37 226 0.33 78.38 31.43 0.00 0.00 37.84 43.24
Dalbeth, Nicola University of Auckland 37 696 1.15 83.78 57.14 0.00 16.22 45.95 54.05
Kildea, Sue University of Queensland 36 428 0.92 80.56 61.76 0.00 8.33 8.33 33.33
Rumbold, Alice R. University of Adelaide 36 334 0.73 86.11 41.18 0.00 2.78 0.00 33.33
Baker, Michael G. University of Otago 36 457 0.70 88.89 50.00 0.00 2.78 38.89 27.78
Thomas, David P. Charles Darwin University 36 296 0.68 91.67 55.56 0.00 2.78 5.56 52.78
Tsey, Komla James Cook University 35 422 0.87 94.29 6.90 0.00 2.86 8.57 54.29
Table 4. The number of documents published by Australian or New Zealand based authors (top 25 by volume) in Indigenous Research since 2010 and
performance indicators on the set of documents. Note: the number of publications and publication metrics are not based on each person’s entire list of
publications but are limited to those that appear in the original set of 8427 publications.
13What do author networks look like for people publishing in Indigenous Research?
Here we explore the researcher and co-author relationships between the people producing
Indigenous Research. Simply considering the prevalence of co-authorship on these records, and
displaying a high prevalence with a close proximity, we can see (similarly to the organisation clusters
on Page 10) that researchers are clustered by location.
There are two distinct clusters, each with researchers based in the two nations (Australia and New
Zealand) clustering separately, demonstrating a geographic divide (Figure 6). It may be that there is
an expected divide between academics based in each nation the influences the way they
collaborate, particularly in Indigenous Research. However, of the 2000 most prominent collaborative
relationships between these academics, 48 co-author relationships exist across the Tasman Sea
within the top 325 authors. Unlike the organisational clusters, here we are able to see clustering of
research at a group level and many of the names that appear in the top 25 researchers (Table 4)
seem to be largely connected within their research group and at the centre of their own research
group’s ecosystem.
Figure 6. Displays the relationships between academics in the Indigenous Research set of publications. An
academic must have been an author on at least 10 documents from the set to be displayed and must be co-author
to at least one other author within the set (leaving 325 academics in total). Collaborative lines are drawn between
the 2000 most common collaborators across the set of publications. Image produced using VoSviewer 2020
14Which fields of research are publishing Indigenous Research?
There are a number of different methodologies used to classify research into ‘Subject Areas’. As
presented in the introduction to this document, the Australian and New Zealand Governments use a
schema known as Field of Research (FoR) codes to classify research outputs. Traditionally (ANZSRC
2008) this classification is done across thousands of academic journals by mapping a journal output
into one or more 2-digit ‘Divisions’ or 4-digit ‘Groups’. This section of the report looks only at the
research traditionally classified in a 4-Digit FoR code based on their journal of publication. It also
could look to guide interested parties into how these outputs should be mapped into the updated
schema and the 20 newly developed 4-Digit Groups aimed specifically at Indigenous Research.
Most of this body of research has been published in the ANZSRC 2008 “11 based” FoR codes
including 1117 Public Health & Health Services, 1103 Clinical Sciences and 1110 Nursing. (Table 5).
It is however apparent that Australian and New Zealand based Indigenous research performs much
higher in the 20 or 21 based FoR codes (ANZSRC 2020) than the global average in the areas of 2103
Historical Studies, 2003 Cultural Studies and 2004 Linguistics (Figure 7).
Figure 7. Displays the top ANZSRC 2008 4-Digit Field of Research codes publishing Indigenous Research by
volume. The bar graph shows the CNCI when this research is normalised across the year of publication, article
type and 4-Digit FoR code.
15# of Times % Docs % in Q1 % Docs in % Docs in % Inter % Open
Name Docs Cited CNCI Cited Journals Top 1% Top 10% Collab Acc Docs
All Records (4 Digit FoR Code) 6940 49948 0.72 78.49 29.01 0.17 6.07 14.96 30.75
1117 PUBLIC HEALTH AND HEALTH SERVICES 2917 25563 0.59 81.62 28.30 0.07 2.98 16.08 46.11
1103 CLINICAL SCIENCES 1287 10855 0.58 74.28 28.24 0.08 4.04 18.57 30.92
1110 NURSING 588 3949 0.83 78.74 28.60 0.00 5.61 9.69 56.29
1701 PSYCHOLOGY 564 4020 0.56 79.08 35.60 0.18 3.37 16.49 19.50
1303 SPECIALIST STUDIES IN EDUCATION 493 2629 0.60 78.90 14.06 0.20 2.43 9.33 23.94
1608 SOCIOLOGY 492 3306 0.79 84.15 35.77 0.00 5.08 9.76 28.46
2103 HISTORICAL STUDIES 489 1671 1.65 67.48 8.20 1.02 16.56 6.34 6.75
1605 POLICY AND ADMINISTRATION 433 3171 0.78 87.99 7.24 0.00 4.62 9.01 38.11
2101 ARCHAEOLOGY 417 2051 0.69 75.06 17.59 0.00 4.32 16.79 11.75
1114 PAEDIATRICS AND REPRODUCTIVE MEDICINE 311 3082 0.71 87.46 27.27 0.00 4.50 20.26 29.58
2002 CULTURAL STUDIES 310 1316 1.06 72.58 19.35 0.00 8.39 5.16 12.58
1402 APPLIED ECONOMICS 293 2442 0.77 89.08 10.31 0.00 4.10 11.95 40.27
1702 COGNITIVE SCIENCES 271 2104 0.51 84.13 24.75 0.00 2.21 16.24 12.55
1301 EDUCATION SYSTEMS 256 1035 0.55 76.56 21.88 0.00 1.56 8.59 17.19
1601 ANTHROPOLOGY 241 1357 0.73 79.25 17.49 0.00 4.56 7.88 15.35
1801 LAW 228 862 0.92 69.74 23.53 0.44 6.14 8.77 16.67
1102 CARDIORESPIRATORY MEDICINE & HAEMATOLOGY 222 1656 0.51 69.37 22.64 0.00 2.25 20.27 23.87
1302 CURRICULUM AND PEDAGOGY 217 1063 0.67 76.96 29.17 0.00 2.30 14.29 31.34
1699 OTHER STUDIES IN HUMAN SOCIETY 203 650 0.46 69.46 2.72 0.00 1.48 5.91 13.30
1607 SOCIAL WORK 174 1023 0.81 82.18 40.15 0.00 5.17 12.07 13.22
2004 LINGUISTICS 162 853 1.06 83.33 17.65 0.00 6.17 15.43 17.90
1604 HUMAN GEOGRAPHY 159 1451 0.80 87.42 56.15 0.00 5.03 19.50 19.50
1606 POLITICAL SCIENCE 153 716 0.58 77.78 27.37 0.00 3.92 7.84 13.07
1112 ONCOLOGY AND CARCINOGENESIS 122 776 0.43 61.48 32.74 0.00 0.82 21.31 29.51
0807 LIBRARY AND INFORMATION STUDIES 111 916 0.88 82.88 1.06 0.00 6.31 7.21 72.97
Table 5. The number of documents published in each traditional ANZSRC 2008 Field of Research code (top 25 by volume) in Indigenous Research since 2010
and performance indicators on the set of documents. Note: Documents are counted across multiple 4 Digit FoR codes if the journal is mapped to multiple
codes.
16Which journals are publishing Indigenous Research?
The academic publishing landscape is undergoing major changes. Publishers are rapidly making the
transition from print to electronic format, while business models are also being turned upside down.
Since the early 1990s licensing of electronic resources has been common, although an important
trend is developing: Open Access.
In Open Access publishing a journal article is made available free to all on the web by the publisher
at the time of publication. Generally, open journals are funded by the author who pays an article
processing charge on the article’s acceptance, thereby shifting the fees from the reader (or
institution supporting the reader) to the researcher (or the funding agency supporting the
researcher). Here we look at the current trends in Indigenous Research and the links with academic
publishing in general.
Two journals have published over 150 articles meeting our search criteria relating to Indigenous
Research. These two journals are New Zealand Medical Journal and Australian and New Zealand
Journal of Public Health (Figure 8). Of the top 10 journals (by volume outputs) that have produced
this research, Medical Journal of Australia has the highest Impact Factor = 6.11. The only journal of
the top 20 that has a greater than average Category Normalised Citation Impact to Indigenous
Research when normalised across classical 2-Digit FoR Divisions is Australian Archaeology.
Figure 8. Displays the number of records being published in Indigenous Research in the top 25 journals (by volume) from 2010
- 2019.
17There are several journals that publish many Australian and New Zealand Indigenous related
research (over 75 documents in the set) that are entirely Open Access, including BMC Public Health,
BMC Open, PLoS One, and BMC Health Services Research. These journals make 100% of their
published records freely and legally available online (Gold Open Access). Other journals including
Medical Journal of Australia and Australian and New Zealand Journal of Public Health make more
than 50% of this research sets content freely and legally accessible (Table 6).
Journal
# of Times % Docs Journal Impact % Open
Name Docs Cited CNCI Cited Quartile Factor Acc Docs
NEW ZEALAND MEDICAL JOURNAL 277 1520 0.36 85.92 n/n n/a 0.00
AUST AND NZ JOURNAL OF PUBLIC HEALTH 191 1565 0.71 88.48 Q2 2.08 53.40
BMC PUBLIC HEALTH 130 1441 0.59 92.31 Q2 2.52 100.00
BMJ OPEN 118 749 0.55 76.27 Q2 2.50 100.00
MEDICAL JOURNAL OF AUSTRALIA 116 1751 0.89 96.55 Q1 6.11 50.86
AUST JOURNAL OF INDIGENOUS EDUCATION 105 375 0.37 74.29 n/a n/a 7.62
ALTERNATIVE AN INTER J OF INDIGENOUS PEOPLES 105 418 0.92 75.24 n/a n/a 10.48
PLOS ONE 102 1194 0.49 87.25 Q2 2.74 100.00
AUSTRALIAN JOURNAL OF PRIMARY HEALTH 98 439 0.36 75.51 Q4 0.98 19.39
JOURNAL OF PAEDIATRICS AND CHILD HEALTH 92 884 0.51 93.48 Q3 1.71 4.35
AUSTRALIAN JOURNAL OF RURAL HEALTH 79 431 0.40 81.01 Q2 1.46 15.19
AUSTRALIAN ABORIGINAL STUDIES 78 191 0.46 61.54 Q4 0.52 0.00
BMC HEALTH SERVICES RESEARCH 78 763 0.66 84.62 Q3 1.99 100.00
INTERNAL MEDICINE JOURNAL 74 392 0.59 58.11 Q3 1.68 8.11
DRUG AND ALCOHOL REVIEW 73 336 0.47 45.21 Q2 2.47 5.48
AUSTRALIAN ARCHAEOLOGY 70 362 1.35 78.57 Q3 0.78 4.29
AUST AND NZ JOURNAL OF PSYCHIATRY 70 449 0.43 28.57 Q1 4.66 2.86
JOURNAL OF PRIMARY HEALTH CARE 67 370 0.38 100.00 n/a n/a 100.00
INTERNATIONAL JOURNAL FOR EQUITY IN HEALTH 64 565 0.88 82.81 Q1 2.60 100.00
RURAL AND REMOTE HEALTH 63 426 0.53 80.95 Q4 1.15 100.00
AUSTRALIAN HEALTH REVIEW 61 474 0.82 91.80 Q4 1.32 37.70
WOMEN AND BIRTH 58 203 0.44 50.00 Q1 2.31 6.90
JOURNAL OF AUSTRALIAN STUDIES 55 152 0.10 67.27 Q2 0.55 1.82
AUSTRALASIAN PSYCHIATRY 55 210 0.27 81.82 Q4 1.03 5.45
NEPHROLOGY 47 117 0.86 44.68 Q3 1.75 8.51
Table 6. The number of documents published by each journal (top 25 by volume) in Indigenous Research since 2010 and
performance indicators on the set. Note A ‘Journal Impact Factor’ and ‘Quartile’ metric is not available where the journal is not
indexed in either the Science Citation Expanded or the Social Science Citation Index (denoted with a ‘n/a’).
18The new field of research schema for Indigenous Research
Topic level mapping of articles in Indigenous Research
Indigenous Research from across the Australian and New Zealand Region is published across many
journals and research areas. There are, however, very few journals that publish Indigenous related
research from the Australian and New Zealand region exclusively. Therefore, when categorising this
body of research, a schema based simply at a journal level is not appropriate.
Using multiple details of each article, one can make an accurate estimation of where each of the
8427 articles in this body of research will be remapped into the new ANZSRC 2020 Fields of Research
(see Appendix for individual articles mapping). The updated FoR mapping for each document has
been produced based on the journal of publication, the title of the article and the Author Address
locations. Based on this approach, the volumes of research in the new categories show that most of
the Indigenous Research is published in the area of Health and Wellbeing, followed by Society and
Community, which is then followed by Culture Language and History (Table 7).
# of
Code Name Docs
45 Indigenous Studies 454
4501 Aboriginal and Torres Strait Islander culture, language and history 985
4502 Aboriginal and Torres Strait Islander education 351
4503 Aboriginal and Torres Strait Islander environmental knowledges and management 255
4504 Aboriginal and Torres Strait Islander health and wellbeing 2807
4505 Aboriginal and Torres Strait Islander peoples, society and community 1208
4506 Aboriginal and Torres Strait Islander sciences 13
4507 Te ahurea, reo me te hītori o te Māori (Māori culture, language and history) 347
4508 Mātauranga Māori (Māori education) 158
4509 Ngā mātauranga taiao o te Māori (Māori environmental knowledges) 146
4510 Te hauora me te oranga o te Māori (Māori health and wellbeing) 1192
4511 Ngā tāngata, te porihanga me ngā hapori o te Māori (Māori peoples, society and community) 508
4512 Ngā pūtaiao Māori (Māori sciences) 3
Table 7. The number of documents estimated to be categorised into each of the new ANZSRC 2020 Indigenous FoR codes from
the original set of 8427 publications.
Furthermore, considering the individual topics mentioned in the records and their co-occurrences in
the keywords section of each article we can determine two things:
1) the proximity of these topics to others
2) the frequency of the occurrences of the keywords across the set.
Basically, this sets up a topic network of Indigenous Research. This approach could also be used to
map research at an article level into more defined categories like the new FoR code schema
generated recently. It can be seen from this type of analysis that keywords like Indigenous,
Australia, Māori, and Aboriginal are at the heart of the topic map. This is largely because these
keywords were used to create the set. More interestingly, moving around the periphery of the topic
cluster (Figure 9), one can see the topics emerging organically from the records. Starting from the
top right of the cluster we see words relating to both environmental development (biodiversity,
climate change and conservation) but also the history of Indigenous populations (settlement,
archaeology, and heritage).
19Moving further around the cluster, we move into social aspects of Indigenous Research (politics,
culture, and education). This moves further into society and community with keywords like youth,
home, and experience becoming emergent. From the bottom of the keyword cluster around the
left-hand side we start to see health related terms emerging. From the bottom we see the social and
society-based keywords develop into population health and epidemiological references (screening,
drug, mental-health, and primary-care). From here the final quadrant (top-left) of keywords is
dominated by the terms related to more acute instances of health including diagnosis,
hypertension, pneumonia and infections.
Figure 9. Displays the relationships between topics in the ‘Keywords’ section of each record in the Indigenous
Research set. A Keyword must have at least 15 occurrences across the set to be displayed. (leaving 575 topics in
total). Co-occurrence lines are drawn between the 2000 most common links between topics mentioned on the
same publication. Image produced using VoSviewer 2020
20Bibliographic coupling and co-citation analysis for clustering articles in Indigenous
Research
‘Bibliographic coupling’ occurs when two articles reference a common third article in their
references. Two articles are said to be bibliographically coupled if they cite one or more documents
in common. The coupling strength can be determined by the number of references that the two
records shares.
Using a minimum number of shared references of three, the largest group of records within the
Indigenous Research set that are connected by bibliographic coupling is 4845 records in total (Figure
10). The analysis reveals articles related to acute health (light blue) clustering near to
epidemiological or population health studies (dark blue). The small cluster of articles at the top of
Figure 10 in dark blue relate to arthritis or gout in the Māori community specifically.
Moving around the analysis shows clusters largely relating to mental health (red), society and
education (purple) and ecology and the environment (green). Finally, the large portion of
publications left in the set generally relate to Indigenous Research in archaeology, culture and
history (yellow). Similarly, bibliographic coupling could be performed at a journal level, or on the
authors contributing to the research. This could then be used to find relationships of clusters within
any set of research, but this is outside the scope of this report.
Figure 10. 4845 Indigenous Research related articles visualised using bibliographic coupling. The proximity of the documents
and colour clusters reveals the strength of the bibliographic coupling between articles. The point radius for each record is
reflective of the total number of times it has been cited. Image produced using VoSviewer 2020
Where bibliographic coupling looks for links between two research articles, (or journals, or people)
that both cite the same document, co-citation analysis looks for links between two research articles
(or journals or people) that are both cited by the same document. Performing co-citation analysis on
the original set of documents obviously looks to a second set of documents that are one citation
generation earlier than the set of records analysed throughout this report.
Using a citation threshold of at least 10 citations, the largest set of connected records is 2058
documents. The most cited work by the original set of Indigenous Research is a book published in
211999 and titled Decolonizing Methodologies: Research and Indigenous Peoples, by Linda Tuhiwai
Smith. This book has been cited a total 343 times by the original 8427 articles. Further to this, the
republished version of the same book in 2012 is the 4th most cited reference in the set (137 citations
in total). These two references can be seen at the centre of the co-citation mapping as two large
overlaid circles in the centre of the co-citation analysis (Figure 11).
Similarly to the bibliographic coupling analysis, there is a small set of records relating to arthritis
(pink) clustered near to public health related records (dark blue). Other records pertaining to both
areas of acute health issues (cardiovascular etc.) and epidemiological studies or public health studies
are clustered near to one another (orange, light blue, green and brown). Issues then relating to
social fairness, nursing and employment equality are clustered in yellow. Moving further around the
co-citation analysis, documents pertaining to education and societies tend to cluster together (red)
with a bordering cluster concerning the history and archaeology of Indigenous societies (purple)
found somewhat removed from the core clustering.
Figure 11. 2058 records that have been cited by records in Indigenous Research, visualised using co-citation analysis. The
proximity of the documents and colour clusters reveals the strength of the co-citation coupling between articles. The point radius
for each record is reflective of the total number of times it has been cited. Image produced using VoSviewer 2020
22Summary
We hope you have found the information here to be insightful and of practical use. By delivering
reliable data on research performance and complementing it with baseline statistics for
benchmarking against peers and inspirational peers, Clarivate enables research leaders like you to
make confident and informed decisions.
Whatever your institution’s requirements are – whether it’s a one-off performance report, a fully
integrated platform for ongoing evaluation or a more in-depth personalised consultation and
analysis – Clarivate has a solution to fit.
For more information about our solutions for evaluating and managing research at your institution,
please contact our team using the information provided below.
About Clarivate
Clarivate™ is a global leader in providing trusted information and insights to accelerate the pace of
innovation. We offer subscription and technology-based solutions coupled with deep domain
expertise that cover the entire lifecycle of innovation – from foundational research and ideas to
protection and commercialization. Today, we’re setting a trail-blazing course to help customers turn
bold ideas into life-changing inventions. Our portfolio consists of some of the world’s most trusted
information brands, including the Web of Science™, Cortellis™, Derwent™, CompuMark™,
MarkMonitor™ and Techstreet™. For more information, please visit clarivate.com.
The Web of Science™, part of Clarivate, organizes the world’s research information to enable
academia, corporations, publishers and governments to accelerate the pace of research. It is
powered by the world’s largest publisher-neutral citation index and research intelligence platform.
23For more information please contact
Anthony Dona PhD
Solutions Consultant
Australia, New Zealand and the Pacific
Clarivate
Jack Wan
Director of Communications, Asia-Pacific
Clarivate
Our team is here to answer any questions
General inquiries
clarivate.com/webofsciencegroup/solutions/contact-us/
Media contacts
clarivate.com/contact-us/media-contacts/
Document expiry date: September 10, 2021
© 2020 Clarivate. All rights reserved. Republication or redistribution of Clarivate content, including by framing or similar means,
is prohibited without the prior written consent of Clarivate. Clarivate and its logo, as well as all other trademarks used herein are
trademarks of their respective owners and used under license.
24You can also read