Analysis of paint traces to determine the ship responsible for a collision
←
→
Page content transcription
If your browser does not render page correctly, please read the page content below
www.nature.com/scientificreports
OPEN Analysis of paint traces
to determine the ship responsible
for a collision
H. Lee*, D. Lee & J. M. Seo
Although there have been many instances of ship collision at sea in recent times, not much research
has been conducted on the topic. In this study, paint from an actual site of ship collision was collected
and analyzed as evidence. The amount of evidence collected from the ships involved in the collision
is either small or has inconsistent morphology. In addition, the contaminants and samples are often
mixed in this evidence, making its analysis difficult. Paint traces of the damaged ship and the ship
suspected to be responsible for the collision were compared through scanning electron microscopy
with energy dispersive X-ray spectroscopy (SEM–EDS), attenuated total reflection–Fourier transform
infrared spectroscopy (ATR–FTIR), thermogravimetry (TG) and derivative thermogravimetry (DTG),
and pyrolysis–gas chromatography/mass spectrometry (Py–GC/MS) analyses. The ship responsible
for the collision could be identified by characterization and by performing a comparative analysis of
the extracted paint. Among the methods used in this study, Py–GC/MS can sensitively analyze even
similar paints, and identified styrene and phthalic anhydride as the most prominent components of
the paint used as evidence. The results obtained can be used to investigate the evidence collected
from collision sites and to determine the ship responsible for the collision.
Increase in the global marine transportation has also increased the maritime traffic volume, leading to accidents
at sea1. Marine accidents can be of various types such as ship collision, capsizing, grounding, and fl ooding2.
Among them, ship collision is typically caused by inefficient operation, and may cause death, injury, and spillage
of pollutants3. According to the Statistics Yearbook of Maritime Distress Accidents issued by the Korea Coast
Guard in 2019, 372 collision accidents were reported in 2 0184.
A vessel traffic service (VTS) system is used to identify the ships suspected to be involved in the collision.
Based on the track recorded on the VTS, the operation record of the vessel passing through the sea area at the
time of the collision is checked. Evidence must be collected to prove the damage caused to a ship in the case of
a collision. Ship paint is an important and general physical evidence of a collision5. Paint can be collected from
the body of each ship as evidence. Depending on the type of accident, we can find either little or no paint marks,
or a large amount of paint, on the surface of a ship. If the impact area has only a few paint marks, it becomes dif-
ficult to collect the evidence because the common analysis methods cannot be applied. Therefore, an appropriate
analysis method should be developed.
Analysis of marine paint material is essential to develop an appropriate paint analysis technology so that the
authorities can quickly respond to marine accidents in the future. However, very few studies have been conducted
on the topic, because it is difficult to collect paint material from the collision site as general public does not have
easy access to ships involved in collisions. They also do not have the permission to collect samples. Recently,
microplastics—a marine pollutant—has become an active research topic, and many studies have been performed
to analyze the paint fallen off the ship surfaces6,7. Turner et al. analyzed antifouling paint particles obtained
from abandoned structures and grounded ships using inductively coupled plasma-mass spectrometry (ICP-MS)
and inductively coupled plasma optical emission spectrometry (ICP-OES). They reported that the paint chiefly
comprised 35% Cu, 15% Zn, and Ba, Cd, Pd, Sn, and Ni trace m etals8. Moreover, the elemental composition of
marine paints is diverse. By identifying the constituent elements, the suspected ship can be identified.
Various techniques for the analysis of paints have been developed in the automotive field owing to the large
number of road accidents or hit-and-run cases. In the case of a car accident, such as a ship collision, a thin layer
of collision marks form, which is then analyzed. We believe that the techniques used for analyzing paints in the
automotive sector can also be used for investigating marine accidents. Attenuated total reflection–Fourier trans-
form infrared spectroscopy (ATR–FTIR) is one of the most common methods for automotive paint analysis9–11.
Korea Coast Guard Research Center, Korea Coast Guard Academy, Korea Coast Guard, Cheonan 31254, Korea.
*
email: heejinlee0608@korea.kr
Scientific Reports | (2021) 11:134 | https://doi.org/10.1038/s41598-020-80088-5 1
Vol.:(0123456789)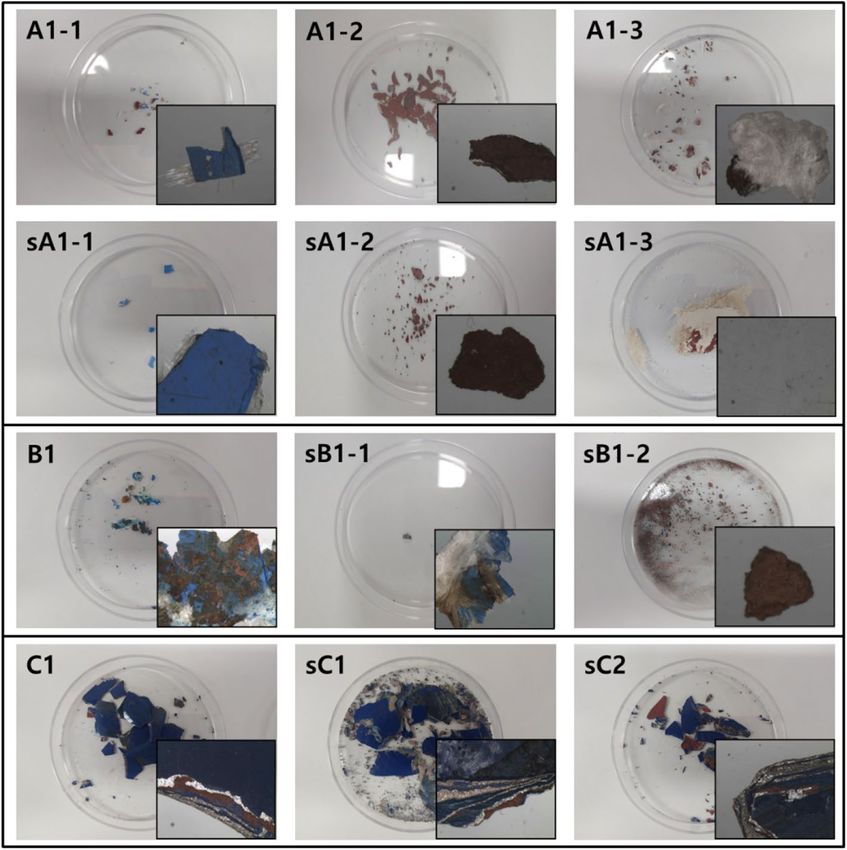
www.nature.com/scientificreports/
Sample
Accident date Ship color Damaged ship Suspected ship
Blue A1-1 sA1-1
Case I 2020.06 White A1-2 sA1-2
Brown A1-3 sA1-3
Blue B1-blue sB1-1
Case II 2020.03
Brown B1-brown sB1-2
Case III sC1
2020.03 Blue C1
(two suspected ships) sC2
Table 1. Paint collected from the collision site.
However, if the paint contains similar polymer binders, more sensitive analysis methods are r equired12. The
chemical components of paint can be identified through pyrolysis–gas chromatography/mass spectrometry
(Py–GC/MS)12–14. The binder type can be identified even when the topcoat paint sample is only in micrograms,
making it useful in criminal investigations12.
The paint used on ships is different from that used on cars. This is because the hull is immersed in sea water
and is exposed to waves and strong ultraviolet rays. Malek et al. reported that alkyd paint, polyoxyethylene resin
paint, phenolic paint, and amino alkyd paint are used to paint ship deck15. Almeida et al. described the typical
paint systems used to paint the sides, superstructures, decks, tanks, and cargo of a s hip16. Ship paint mainly
comprises bisphenol A, toluene, benzene, and xylene17,18. Therefore, it is important to confirm the detection of
these paint components, instead of analyzing the contaminants. The suspected ship was judged as the major
offending ship based on blue samples collected from the same ship. Firstly, based on the analysis of the paint
traces, the dominant offender was identified, and secondly, the facts of the accident were determined through
investigations by the shipowner and the shipping company. This investigation is beyond the scope of our study.
In this study, the paint collected as evidence from three actual ship collision events occurring in 2020 was
analyzed. Very few studies have investigated paint as the evidence of actual maritime accidents. Therefore, the
aim of this study is to identify the offending ship through paint traces and to confirm the applicability of the
collected data to similar accidents in the future.
Materials and methods
Sample preparation. Paint samples were collected from three cases of ship collisions. Evidence samples
were collected differently depending on the position and condition of the vessel. The samples were taken from
various collision sites, including the deck, guardrails, port-side, and starboard. A representative sample was
selected by comparing the paint colors. Table 1 lists information such as the accident date, ship color, and sample
name. Figure 1 presents the state of the paint evidence. The bottom right of each image was magnified using an
optical microscope. In Case I, the samples were taken from three collision sites of the damaged ship and the ship
suspected to be involved in the collision. In Case II, one sample of a mixture of blue and brown paint was taken
from the damaged ship and two samples from the suspected ship. In Case III, one sample was collected from the
damaged ship and one sample each from the two suspected ships.
Analytical methods. To confirm the paint surface morphology and elemental composition, field emission
scanning electron microscopy (FE-SEM) images were obtained using a JEOL JSM-7500F microscope (Tokyo,
Japan) equipped with an x-act 6 EDS microanalysis detector (Oxford Instruments, United Kingdom). The
images of the samples (5,000 × magnification) were obtained using an accelerating voltage (5 kV).
In situ attenuated total reflection-Fourier transform infrared (ATR‐FTIR) spectroscopy was performed using
an FT/IR-6100 instrument (JASCO, Japan) with KBr disks to determine the paint binder type. The spectra were
collected between 4000 and 650 cm−1. For each sample, the spectrum represented a collection of 40 scans at a
spectral resolution of 4 cm−1.
In the present study, Py–GC/MS analysis was conducted to compare the properties of each sample using a
Py-2020iD pyrolyzer (Frontier Lab, Japan) attached to a SHIMADZU 2010 gas chromatograph (Kyoto, Japan)
coupled with a Shimadzu QP2010 Plus mass spectrometer (Kyoto, Japan). A paint sample was first placed in
a metal sample cup and then in a 600 °C furnace with an interface of 350 °C under a helium atmosphere. The
product gas was transferred to a metal capillary column (UA-5, 30 m × 0.25 mm id, 0.25 µm) for separation. The
oven temperature program was set at 42 °C for 1.3 min, and then ramped at 5.5 °C/min to 325 °C. The compounds
were identified by referring to the NIST 5th MS library.
Thermogravimetric (TG) analysis was performed to determine the thermal behavior of the paint using a
TGA N-1000 analyzer (SINCO, Korea). To this end, 7 mg of the sample was nonisothermally heated from room
temperature to 600 °C at a heating rate of 20 °C/min under nitrogen atmosphere.
Results and discussion
Case I: Ship collision in June 2020. Twelve samples were collected from the collision site. Of these, six
were selected for a comparative analysis. The ship painted brown was the damaged ship, and the ship painted
in white and blue was the suspected ship. The SEM surface images of the blue paint samples collected from the
Scientific Reports | (2021) 11:134 | https://doi.org/10.1038/s41598-020-80088-5 2
Vol:.(1234567890)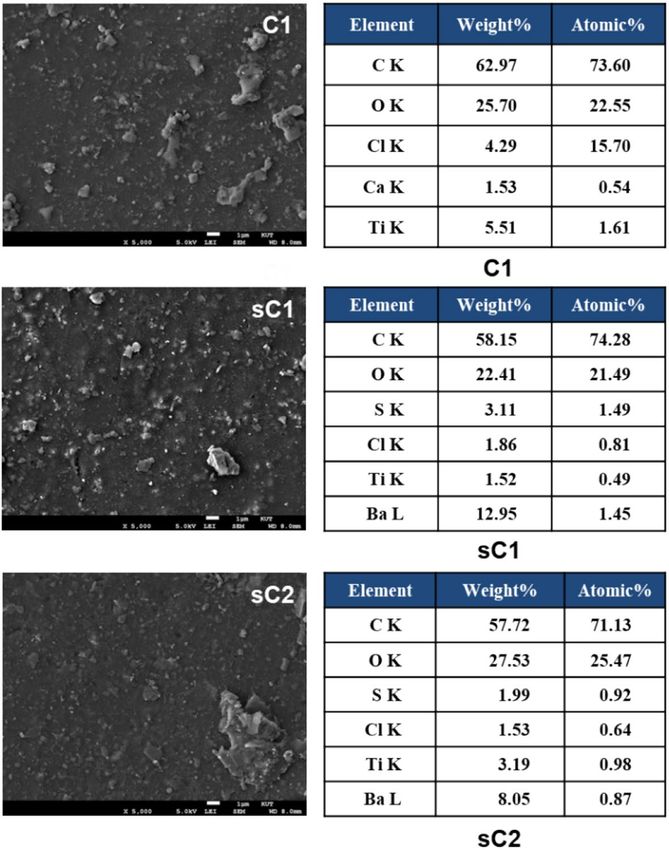
www.nature.com/scientificreports/
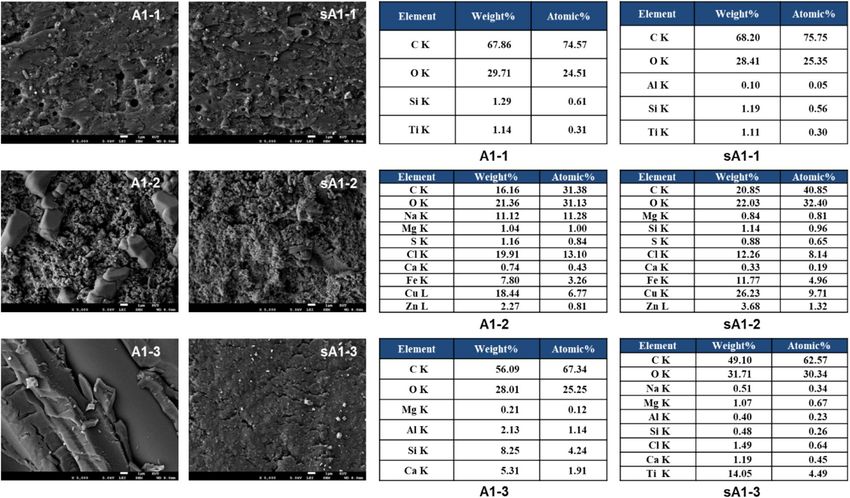
Figure 1. Paint collected from the actual collision site.
port of the damaged ship (A1-1) and the starboard deck of the suspected ship (sA1-1) are similar to each other
(Fig. 2). In addition, the surface images of the brown traces of A1-2 and sA1-2 collected from the backside of the
port and the part of the fore deck were similar. However, the surface images of the white paint collected from the
port (A1-3) and starboard center (sA1-3) were different. C, O, Si, and Ti were observed in the blue fragments,
while C, O, Cl, Fe, and Cu were detected as the main elements in the brown paint samples (EDS images, Fig. 2).
However, more atomic elements were distributed in the white paint collected from the suspected ship than that
collected from the damaged ship. In the damaged ship sample, C, O, Si, and Ca were detected as the principal ele-
ments, while Ti and Cl were also detected in the suspected ship sample. It is not possible to accurately determine
why the analysis results of the white paint samples of the damaged ship and the offending ship are different. The
analysis results may differ because of the contaminants or other traces. Optical microscopy and SEM analysis
results are shown in Figs. 1 and 2, respectively. A fibrous material was observed in the white paint layer and a
smooth long shape was observed in the surface morphology, suggesting that the paint may contain the fibrous
material. Parks et al. and Soroldoni et al. reported the presence of C, O, Mg, Al, Si, S, K, Ca, Fe, Ti, Ba, and Mn,
depending on the paint type19,20.
Figure 3 shows the chromatogram obtained from Py–GC/MS. The pyrolysis patterns of the blue, white,
and brown samples of the damaged and suspected ships were similar. The major compounds of the blue sam-
ples were (1) toluene, (2) styrene, (3) α-methylstyrene, (4) phthalic anhydride, and (5) dimethyl phthalate. In
the white paint sample, (1) toluene, (2) ethylbenzene, (3) styrene, (4) α-methylstyrene, and (5) phthalic anhy-
dride were detected. In the brown samples, In the brown samples, (1) toluene, (2) ethylbenzene, (3) styrene,
(4) α-methylstyrene, (5) phthalic anhydride (1) pyridine, (2) p-xylene, (3) p-xylene, (4) phenol, (5) benzene,
2-propenyl, (6) benzene, 1-ethenyl-3-methyl-, (7) indene, (8) triisopropylsilanol, (9) phenol, 4-(1-methyle-
thyl)-, (10) p-isopropenylphenol, and (11) phenol, 4,4′-(1-methylethylidene)bis-were identified. Styrene and
phthalic anhydride were the most prominent components. Phthalic anhydride is known to be dominant in alkyd
formulations21,22. Poly(acrylate/styrene) is an unsaturated polyester widely used in emulsion-based p aints23–25.
Song et al. indicated that alkyds and poly(acrylate/styrene) derived from marine paint resins in microplastics
dominate the sea surrounding K orea23. Pyridine and triisopropylsilanol were the characteristic compounds in
the brown paint traces. These chemicals are used in antifouling paints for ships because they inhibit the growth
of marine b acteria26. In addition, common ship surface-coating materials such as toluene, ethylbenzene, and
xylene were identified.
Scientific Reports | (2021) 11:134 | https://doi.org/10.1038/s41598-020-80088-5 3
Vol.:(0123456789)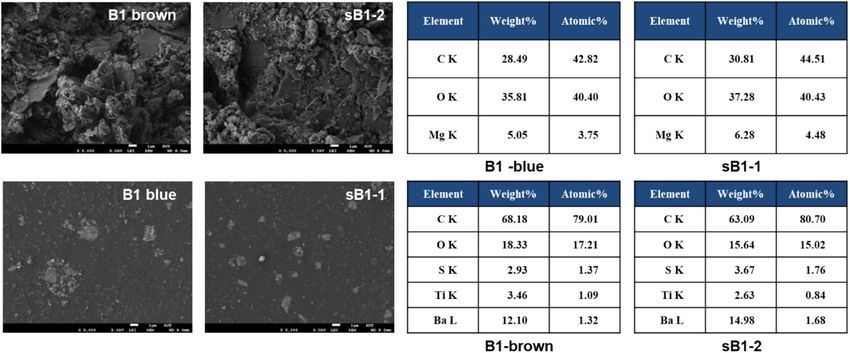
www.nature.com/scientificreports/

                                           Figure 2.  SEM–EDS image of Case I evidence.

                                              The SEM–EDS analysis of the white paint traces taken from the damaged and suspected ships did not match.
                                           However, the surface elements of the other samples were similar, and the pyrogram patterns and compounds
                                           of Py–GC/MS were also consistent. It is not easy to match all the evidence collected from the site of maritime
                                           accidents, because the surface of the ship contains various contaminants and sampling is not easy. The surface
                                           morphology of the white paint did not match, but the blue and brown paint samples taken together perfectly
                                           matched. Therefore, it can be concluded that the suspect ship was the dominant offender.

                                           Case II: Ship collision in March 2020.           Five paint traces were collected from the collision site, the paint
                                           color was visually checked, and then three representative samples were selected for this study. The traces were
                                           not large, and some samples were collected by scraping the ship guardrail, causing the paint traces to shred like
                                           powder. In addition, in some of the samples, the paint traces of both the damaged and suspected ships were
                                           mixed; therefore, it is necessary to check the paint colors carefully and separate them using an optical micro-
                                           scope. The brown and blue parts of the B1 sample were compared with the sB1-1 (blue) and sB1-2 (brown)
                                           samples, and it was observed that these samples had similar surface morphology (Fig. 4). The blue traces had a
                                           relatively smooth surface, while the brown samples had amorphous particles on the surface. C, O, and Mg in the
                                           blue samples and C, O, S, Ti, and Ba in the brown samples were detected by EDS analysis (Fig. 4).
                                               Figure 5 presents the Py–GC/MS results. The chromatograms of the blue samples, B1 and sB1-1, were similar.
                                           However, the brown samples of the damaged and suspected ships showed different patterns. The main compo-
                                           nents of the blue sample were (1) toluene, (2) ethylbenzene, (3) styrene, (4) 2-propenoic acid, 2-methyl-, 2-meth-
                                           ylpropyl ester, (5) α-methylstyrene, (6) benzene, (1-methylenepropyl)-, (7) benzenecarboxylic acid, (8) phthalic
                                           anhydride, (9) dimethyl phthalate, (10) benzene, 1,1′-(1,2-ethanediyl)bis-, and (11) benzene, 1,1′-(1,2-ethanediyl)
                                           bis-. (1) benzene, (2) 1-heptene, (3) toluene, (4) styrene, (5) 1-decene, (6) 1-dodecene, (7) 1-dodecene, (8)
                                           1-tridecene, (9) phthalic anhydride, (10) bis(2-ethylhexyl) phthalate, (11) phosphoric acid, tris(3-methylphenyl)
                                           ester, (12) phosphoric acid, tris(3-methylphenyl) ester, and (13) phosphoric acid, tris(3-methylphenyl) ester were
                                           identified in the B1 sample, and (1) benzene, (2) toluene, (3) o-xylene, (4) styrene (5) 1-decene, (6) benzene,
                                           1-methyl-3-(1-methylethyl)-, (7) 1-dodecene, (8) naphthalene, (9) 1-dodecene, (10) naphthalene, 1-methyl-,
                                           (11) naphthalene, 1-methyl-, and (12) phenanthrene, 1-methyl-7-(1-methylethyl)- were detected in the sB1-2
                                           sample. In the blue sample (B1 and sB1-1) as in Case I, phthalic anhydride, the main component of the alkyd
                                           paint, and styrene were observed. As shown in Fig. 5, the two samples showed similar peaks. Phosphoric acid,
                                           tris(3-methylphenyl) ester—a characteristic component of brown paint—was detected in B1, while naphtha-
                                           lene compounds such as (1) naphthalene, (2) naphthalene, 1-methyl-, and (3) phenanthrene, 1-methyl-7-(1-
                                           methylethyl)- were identified in sB1-2. The brown part was collected in a powder form from the ship guardrail,
                                           making it difficult to distinguish between the paint and the contaminants. In fact, it was difficult to identify the
                                           composition of a part of the sample because of the overall low intensity of the chromatogram.

          Scientific Reports |   (2021) 11:134 |                https://doi.org/10.1038/s41598-020-80088-5                                                   4

Vol:.(1234567890)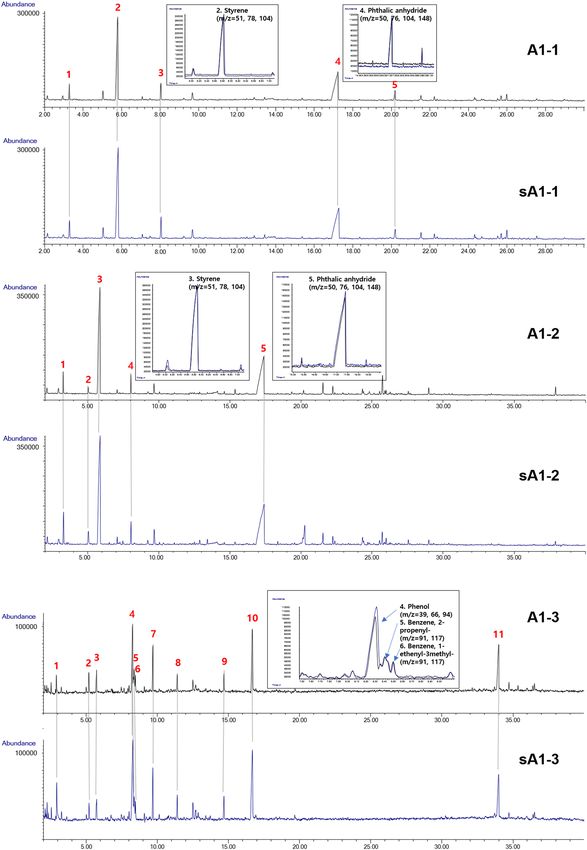
www.nature.com/scientificreports/

                                 Figure 3.  Py–GC/MS spectra of Case I evidence.

Scientific Reports |   (2021) 11:134 |              https://doi.org/10.1038/s41598-020-80088-5        5

                                                                                                 Vol.:(0123456789)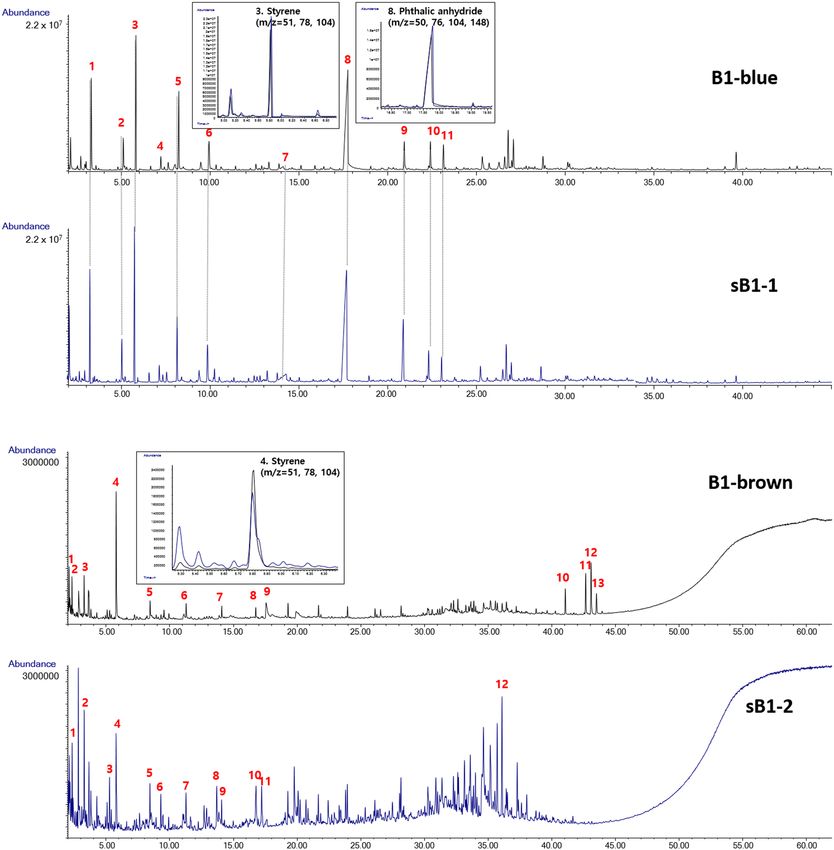
www.nature.com/scientificreports/

                                           Figure 4.  SEM–EDS image of Case II evidence.

                                               The SEM–EDS analysis results of the damaged and suspected ships were similar, and the peak patterns and
                                           composition of Py–GC/MS the brown sample did not match. The suspected ship was determined to be the major
                                           offending ship based on the analysis of the blue samples collected from the same ship.

                                           Case III: Ship collision in March 2020. Three samples were collected from the collision site. Two sus-
                                           pected ships were identified after investigating the damage. The damaged ship sample C1 and the suspected ship
                                           samples sC1 and sC2 had similar surface textures. However, the elemental analysis of the suspected ship samples
                                           conducted using EDS was not consistent with that of the damaged ship (Fig. 6). C, O, Ti, Cl, and Ca elements
                                           were detected in the damaged ship sample; S and Ba were also identified in the paint traces obtained from the
                                           two suspected ships.
                                               The chromatogram results of C1, sC1, and sC2 samples are shown in Fig. 7. C1 and sC1 showed similar
                                           chromatogram patterns, while sC2 showed a different profile. The following were the major compounds of C1
                                           and sC1 samples: (1) 2-propenoic acid, 2-methyl-, methyl ester, (2) toluene, (3) 2-propenoic acid, 2-methyl-, (4)
                                           p-xylene, (5) styrene, (6) o-xylene, (7) 2-propenoic acid, 2-methyl-, butyl ester, (8) benzene, 1,2,3-trimethyl-, and
                                           (9) benzene, 1,2,3-trimethyl-. For the sC2 fragments, the major elements were (1) toluene, (2) ethylbenzene, (3)
                                           p-xylene, (4) p-xylene, (5) 2-propenoic acid, 2-methyl-, butyl ester, (6) phenol, (7) benzene, 1,2,3-trimethyl-, (8)
                                           phenol, 4-(1-methylethyl)-, (9) phenol, p-tert-butyl-, (10) p-isopropenylphenol, (11) phthalic anhydride, (12)
                                           1,3-benzenedicarbonitrile, and (13) phenol, 4,4′-(1-methylethylidene)bis-. Hydrocarbons such as toluene and
                                           xylene were mainly detected in the C1 and sC1 samples. In the sC2 sample, in addition to hydrocarbons, O-com-
                                           pounds such as 2-propenoic acid, 2-methyl-, butyl ester, phenol, 4-(1-methylethyl)-, benzaldehyde, 3-methyl-,
                                           and N-compounds of 1,3-benzeneicarbonitrile were detected.
                                               Figure 8 shows the TG and DTG curves of the Case III evidence. All three samples present two decomposition
                                           stages in the TG and DTG curves. The first stage was from 200 to 350 °C, and the second stage was from 350 to
                                           500 °C. The C1 and sC1 samples presented similar behavior; in contrast, sC2 showed less weight loss compared
                                           to the other samples. The weight losses of C1, sC1, and sC2 were 27%, 28%, and 19% at 350 °C, respectively,
                                           and 56%, 53%, and 47% at 500 °C, respectively. Because of the presence of phenolic compounds such as phenol,
                                           4-(1-methylethyl)-, phenol, p-tert-butyl-, p-isopropenylphenol, phenol, 4,4′-(1-methylethylidene)bis in the sC2
                                           sample, the weight loss was estimated to be less in the TG–DTG curve measured from room temperature to
                                           600 °C. Zhou et al. and Souza et al. reported the thermal decomposition of a phenolic resin converted to an
                                           amorphous carbon at 700 °C, and showed that the thermogravimetric loss rate of pure phenolic resin reached
                                           a maximum at 550 °C27,28.
                                               Few studies have used TG and DTG curves for paint analysis. The material components of the paint cannot
                                           be identified by TG analysis, and the analysis results obtained by weight loss only are not reliable. In addition to
                                           traces owing to collision, ship paint can acquire different traces during its voyage. It is often impossible to distin-
                                           guish the two traces. Therefore, it is necessary to compare and analyze many samples. TG analysis can be used
                                           to reduce the number of samples prior to component analysis, because it then makes it possible to distinguish
                                           the suspected vessels even though there is a weight loss.
                                               The infrared spectra of the Case III evidence are shown in Fig. 9. The ATR–FTIR spectra of C1, sC1, and sC2
                                           showed similar absorption bands. In particular, the peak position and intensity of C1 were similar to those of sC1.
                                           An investigation of the paint evidence based on the spectra obtained from the FTIR polymer library at OMNIC
                                           (Thermo Nicolet Corporation, Sprouse Polymer by ATR Library) showed that the spectra matched well with that
                                           of poly(butyl methacrylate). A comparison of the paint evidence spectra with the Py–GC/MS results showed the
                                           presence of 2-propenoic acid, 2-methyl-, butyl ester (= butyl methacrylate), which showed the highest intensity in
                                           the chromatogram. These spectra are similar to those obtained for the alkyd resin, as reported by Hayes et al. and
                                           Burns et al. using ATR–FTIR. The spectral regions of the alkyd resin were identified as 1680–1770, 1000–1360,

          Scientific Reports |   (2021) 11:134 |                https://doi.org/10.1038/s41598-020-80088-5                                                      6

Vol:.(1234567890)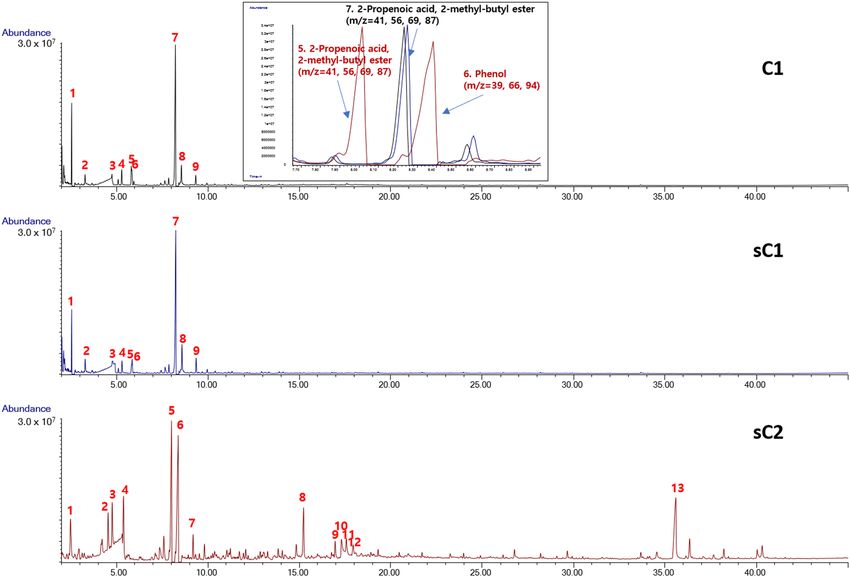
www.nature.com/scientificreports/
Figure 5. Py–GC/MS spectra of Case II evidence.
and 630–800 cm−1 for ester C=O, ester C–O–C, aromatic C-H and aromatic ring bending, r espectively21,22.
Although the spectra of the sC2 sample were similar to those of the damaged ship sample, different peaks were
observed in the 1119 and 1065 cm−1 regions. He et al. analyzed the ship deck paint and reported peaks at 1120,
1070, 830, and 740 cm−1, indicating the presence of nitrocellulose and alkyd resins5.
Table 2 summarizes the results of SEM–EDS, Py–GC/MS, TG–DTG, and ATR–FTIR analysis. The paint
samples had similar primary components, thermogravimetric decomposition curves, and binder type. Although
SEM–EDS was measured at various locations of all the samples, particular elements such as Ba were observed
in the suspected ships only. Although sC1 is a prime suspected ship, some results were inconsistent, and further
analysis was not possible because the sample was taken from only one part of the ship. Because of the insufficient
evidence, the ship cannot be judged as the offender. Therefore, it is important to collect several samples from
the field to obtain accurate evidence.
Scientific Reports | (2021) 11:134 | https://doi.org/10.1038/s41598-020-80088-5 7
Vol.:(0123456789)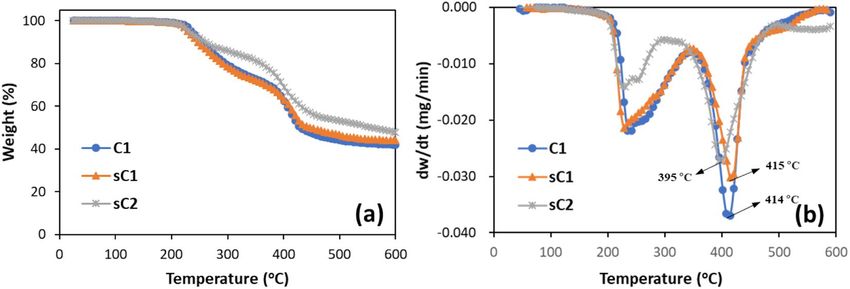
www.nature.com/scientificreports/

                                           Figure 6.  SEM–EDS image of Case III evidence.

                                           Conclusion
                                           Paint, found as traces during a ship collision, is collected differently depending on the size and type of the
                                           accident. In general, evidence is collected after first visually inspecting the ship color. In this study, we used
                                           samples from three actual collisions. The collected paint evidence was analyzed using SEM–EDS, ATR–FTIR,
                                           TG–DTG, and Py–GC/MS. The surface morphology, constituent elements, and weight loss were confirmed
                                           through SEM–EDS and TG–DTG analysis of the paint traces, and the offending ship could be inferred. In addi-
                                           tion, the paint surface materials were identified through ATR–FTIR spectra, and the paint components were
                                           analyzed using Py–GC/MS. Through this analysis, the offending ship could be identified, and the same trace
                                           analysis method can be used for investigating ship collisions in the future. Although the method described herein
                                           can be used for the analysis of paint on the surface of a ship, correct sampling is also important. Other traces and
                                           contaminants present on the ship surface often get mixed with the collision traces, making the analysis difficult.
                                           Therefore, it is necessary to collect as many collision traces as possible from the accident site and compare and
                                           analyze them all to correctly identify the offending ship.

          Scientific Reports |   (2021) 11:134 |                https://doi.org/10.1038/s41598-020-80088-5                                                   8

Vol:.(1234567890)
www.nature.com/scientificreports/
Figure 7. Py–GC/MS spectra of Case III evidence.
Figure 8. TG–DTG curves of Case III evidence.
Scientific Reports | (2021) 11:134 | https://doi.org/10.1038/s41598-020-80088-5 9
Vol.:(0123456789)www.nature.com/scientificreports/
Figure 9. ATR–FTIR spectra of Case III evidence.
Analyzer Propose Damaged ship (C1) Suspected ship (sC1) Suspected ship (sC2)
Not match Not match
SEM–EDS Specific elements, morphology C, O, Cl, Ca, Ti
C, O, S, Cl, Ti, Ba C, O, S, Cl, Ti, Ba
Match Not match
Major compound
PY–GC/MS Compounds 2-Propenoic acid, 2-methyl-, butyl ester,
2-Propenoic acid, 2-methyl-, butyl ester 2-Propenoic acid, 2-methyl-, butyl ester
phenol
Weight loss Match Not match
TG–DTG Thermal behavior 27% at 350 °C 28% at 350 °C 19% at 350 °C
56% at 500 °C 53% at 500 °C 47% at 500 °C
Match Partial match
ATR–FTIR Binder type Alkyd resins (poly(butyl methacrylate))
Alkyd resins Nitrocellulose, alkyd resins
Table 2. Summary of the results of Case III evidence.
Received: 24 September 2020; Accepted: 16 December 2020
References
1. Kum, S. et al. A root cause analysis for arctic marine accidents from 1993 to 2011. Saf. Sci. 74, 206–220 (2015).
2. Talley, W. K. et al. Determinants of the severity of cruise vessel accidents. Transp. Res. D Transp. Environ. 13, 86–94 (2008).
3. Tang, L. et al. Prediction of grades of ship collision accidents based on random forests and bayesian networks. In IEEE. 1377–1381
(2019).
4. Korea Coast Guard. Statistics yearbook of maritime distress accidents (2019)
5. He, X. et al. Nondestructive discrimination of ship deck paint using Attenuated total reflection–Fourier transform infrared (ATR–
FTIR) spectroscopy with chemometric analysis. Anal. Lett. 53, 2761–2774 (2020).
6. Song, Y. K. et al. Large accumulation of micro-sized synthetic polymer particles in the sea surface microlayer. Environ. Sci. Technol.
48, 9014–9021 (2014).
7. Lacerda, A. L. F. et al. Plastics in sea surface waters around the Antarctic peninsula. Sci. Rep. 9, 3977 (2019).
8. Turner, A. et al. Marine pollution from antifouling paint particles. Mar. Pollut. Bull. 60, 159–171 (2010).
9. Giang, Y.-S. et al. Identification of a tiny, thin and smeared dot of red paint in a fatal traffic accident case by Fourier transform-
infrared microspectroscopy. J. Forensic Sci. 4, 47–54 (2005).
10. Joseph, E. et al. Macro-ATR–FT-IR spectroscopic imaging analysis of paint cross-sections. Vib. Spectrosc. 53, 274–278 (2010).
11. Verma, P. et al. Forensic evaluation and comparison of Indian automobile paint chips using FTIR. Mater. Today Proc. 33, 1727–1732
(2020).
12. Zięba-Palus, J. et al. Pyrolysis-gas chromatography/mass soectrometry analysis as a useful tool in forensic examination of automo-
tive paint traces. J. Chromatogr. A. 1179, 41–46 (2008).
13. Sabaradin, R. Z. R. et al. Classification of car paint primers using pyrolysis-gas chromatography-mass spectrometry (Py–GC–MS)
and chemometric techniques. Pertanika J. Sci. Technol. 25(S), 53–66 (2017).
14. Yang, S.-H. et al. Quantification of vehicle paint components containing polystyrene using plyrolysis-gas chromatography/mass
spectrometry. Anal. Methods. 4, 1989–1995 (2012).
Scientific Reports | (2021) 11:134 | https://doi.org/10.1038/s41598-020-80088-5 10
Vol:.(1234567890)www.nature.com/scientificreports/
15. Malek, M. A. et al. Multi-modal compositional analysis of layered paint chips of automobiles by the combined application of
ATR–FTIR imaging, Raman, microspectrometry, and SEM/EDX. Molecules 24, 1381 (2019).
16. Almeida, E. et al. Marine paints: the particular case of antifouling paints. Prog. Org. Coat. 59, 2–20 (2007).
17. Lambourne, R. et al. Paint and Surface Coatings, Theory and practice 2nd edn. (Woodhead publishing limited, Cambridge, 1999).
18. Wampler, T. P. Recent changes in automotive paint formulation using pyrolysis-gas chromatography/mass spectrometry for iden-
tification. J. Anal. Appl. Pyrol. 40–41, 79–89 (1997).
19. Parks, R. et al. Antifouling biocides in discarded marine paint particle. Mar. Pollut. Bull. 60, 1226–1230 (2010).
20. Soroldoni, S. et al. Antifouling paint particles: sources, occurrence, composition and dynamics. Water Res. 137, 47–56 (2018).
21. Hayes, P. A. et al. ATR–FTIR spectroscopy and quantitative multivariate analysis of paints and coating materials. Spectrochim.
Acta. A 133, 207–213 (2014).
22. Burns, D. T. et al. A comparison of pyrolysis-gas chromatography-mass spectrometry and Fourier transform infrared spectroscopy
for the analysis of a series of modified alkyd paint resins. Anal. Chim. Acta. 422, 217–230 (2000).
23. Song, Y. K. et al. Occurrence and distribution of microplastics in the sea surface microlayer in Jinhae bay South Korea. Arch.
Environ. Contam. Toxicol. 69, 279–287 (2015).
24. El-Wahab, H. A. et al. Preparation, characterization and evaluation of some acrylate polymers nanoparticles as binder to improving
the physical properties of water based paints. Int. J. Nanopart. Nanotechnol. 5, 2–18 (2019).
25. Stoye, D. et al. Chapter 2. Types of Paints and Coatings (Binders). Second, Completely revised edition (WILEY-VCH Verlag GimbH,
1998).
26. Finnie, A. A. et al. Chapter 13. Paint and Coatings Technology for the Control of Marine Fouling. Biofouling. 185–206 (Oxford:
Wiley-Blackwell, 2010).
27. Zhou, R. et al. Synergistic effects of aluminum diethylphosphinate and melamine on improving the flame retardancy of phenolic
resin. Materials 13, 158 (2020).
28. Souza, W. O. et al. Electrical behavior of carbon fiber/phenolic composite during pyrolysis. Mater. Res. 18, 1209–1216 (2015).
Acknowledgements
We would like to thanks Korea Coast Guard for collecting paint that helped us analyze the ship collision accidents.
Author contributions
H.L., D.L., and J.M.S. developed the concept of the study. H.L. and D.L. performed the experiments. H.L. and
D.L. contributed to the data analysis. H.L., D.L., and J.M.S. wrote the main manuscript text. All authors reviewed
the manuscript.
Competing interests
The authors declare no competing interests.
Additional information
Correspondence and requests for materials should be addressed to H.L.
Reprints and permissions information is available at www.nature.com/reprints.
Publisher’s note Springer Nature remains neutral with regard to jurisdictional claims in published maps and
institutional affiliations.
Open Access This article is licensed under a Creative Commons Attribution 4.0 International
License, which permits use, sharing, adaptation, distribution and reproduction in any medium or
format, as long as you give appropriate credit to the original author(s) and the source, provide a link to the
Creative Commons licence, and indicate if changes were made. The images or other third party material in this
article are included in the article’s Creative Commons licence, unless indicated otherwise in a credit line to the
material. If material is not included in the article’s Creative Commons licence and your intended use is not
permitted by statutory regulation or exceeds the permitted use, you will need to obtain permission directly from
the copyright holder. To view a copy of this licence, visit http://creativecommons.org/licenses/by/4.0/.
© The Author(s) 2021
Scientific Reports | (2021) 11:134 | https://doi.org/10.1038/s41598-020-80088-5 11
Vol.:(0123456789)You can also read