Design and implementation of a jellyfish otolith-inspired MEMS vector hydrophone for low-frequency detection - Nature

Page created by Roy Barnes
 
CONTINUE READING
Design and implementation of a jellyfish otolith-inspired MEMS vector hydrophone for low-frequency detection - Nature
Wang et al. Microsystems & Nanoengineering (2021)7:1
                                    https://doi.org/10.1038/s41378-020-00227-w
                                                                                                                                                               Microsystems & Nanoengineering
                                                                                                                                                                                                www.nature.com/micronano

                                     ARTICLE                                                                                                                                                    Open Access

                                    Design and implementation of a jellyfish
                                    otolith-inspired MEMS vector hydrophone for
                                    low-frequency detection
                                    Renxin Wang1, Wei Shen1, Wenjun Zhang1, Jinlong Song1, Nansong Li2, Mengran Liu3, Guojun Zhang1,
                                    Chenyang Xue1 and Wendong Zhang1

                                      Abstract
                                      Detecting low-frequency underwater acoustic signals can be a challenge for marine applications. Inspired by the
                                      notably strong response of the auditory organs of pectis jellyfish to ultralow frequencies, a kind of otolith-inspired
                                      vector hydrophone (OVH) is developed, enabled by hollow buoyant spheres atop cilia. Full parametric analysis is
                                      performed to optimize the cilium structure in order to balance the resonance frequency and sensitivity. After the
                                      structural parameters of the OVH are determined, the stress distributions of various vector hydrophones are simulated
                                      and analyzed. The shock resistance of the OVH is also investigated. Finally, the OVH is fabricated and calibrated. The
                                      receiving sensitivity of the OVH is measured to be as high as −202.1 dB@100 Hz (0 dB@1 V/μPa), and the average
                                      equivalent pressure sensitivity over the frequency range of interest of the OVH reaches −173.8 dB when the frequency
                                      ranges from 20 to 200 Hz. The 3 dB polar width of the directivity pattern for the OVH is measured as 87°. Moreover, the
                                      OVH is demonstrated to operate under 10 MPa hydrostatic pressure. These results show that the OVH is promising in
                  1234567890():,;
1234567890():,;
                  1234567890():,;
1234567890():,;

                                      low-frequency underwater acoustic detection.

                                    Introduction                                                                                        flexed beam as the mass-spring element. Di Iorio et al.5
                                       Recently, long-distance and weak noise detection for                                             developed hydrophones to detect cracking sounds
                                    submarines has become a research hot spot, which pla-                                               through nonintrusive monitoring of bivalve movement.
                                    ces high requirements on the low-frequency perfor-                                                  Heerford et al.6 introduced a novel fiber hydrophone
                                    mance of hydrophones. The submarine acoustic energy                                                 without any electrical power that can be applied to a
                                    of the most powerful discrete components is located in                                              hydrophone towed array. The volume of those vector
                                    the frequency band of 5–200 Hz1. Vector hydrophones                                                 hydrophones is usually large. On the other hand,
                                    have become a top choice to monitor sound pressure and                                              hydrophones with miniaturized volumes and high sen-
                                    velocity at low frequency2. Many studies have focused on                                            sitivity have become a trend7. Lee et al.8 presented a kind
                                    the study of vector hydrophones. Yildiz et al.3 developed                                           of MEMS piezoelectric flexural-mode hydrophone with
                                    hydrophone arrays of vector sensors with spacing much                                               air backing. They also developed a micromachined
                                    less than the wavelength. Ma et al.4 reported a two-axis                                            hydrophone employing a piezoelectric body on the gate
                                    slim fiber laser vector hydrophone with a V-shaped                                                   of a field-effect transistor9. Xu et al.10 presented a kind of
                                                                                                                                        AlN-on-SOI micromachined hydrophone with high
                                                                                                                                        sensitivity. However, these piezoelectric hydrophones
                                    Correspondence: Wendong Zhang (wdzhang@nuc.edu.cn)                                                  were nondirectional and could bear only low hydrostatic
                                    1
                                     State Key Laboratory of Dynamic Testing Technology, North University of                            pressure due to the sealed membrane structure. This
                                    China, Taiyuan, China
                                    2                                                                                                   means that the work depth was limited to a low range,
                                     College of Underwater Acoustic Engineering, Harbin Engineering University,
                                    Harbin, China                                                                                       which was reported as 100 m9. Ganji et al.11 designed a
                                    Full list of author information is available at the end of the article

                                    © The Author(s) 2021
                                                        Open Access This article is licensed under a Creative Commons Attribution 4.0 International License, which permits use, sharing, adaptation, distribution and reproduction
                                                        in any medium or format, as long as you give appropriate credit to the original author(s) and the source, provide a link to the Creative Commons license, and indicate if
                                    changes were made. The images or other third party material in this article are included in the article’s Creative Commons license, unless indicated otherwise in a credit line to the material. If
                                    material is not included in the article’s Creative Commons license and your intended use is not permitted by statutory regulation or exceeds the permitted use, you will need to obtain
                                    permission directly from the copyright holder. To view a copy of this license, visit http://creativecommons.org/licenses/by/4.0/.
Design and implementation of a jellyfish otolith-inspired MEMS vector hydrophone for low-frequency detection - Nature
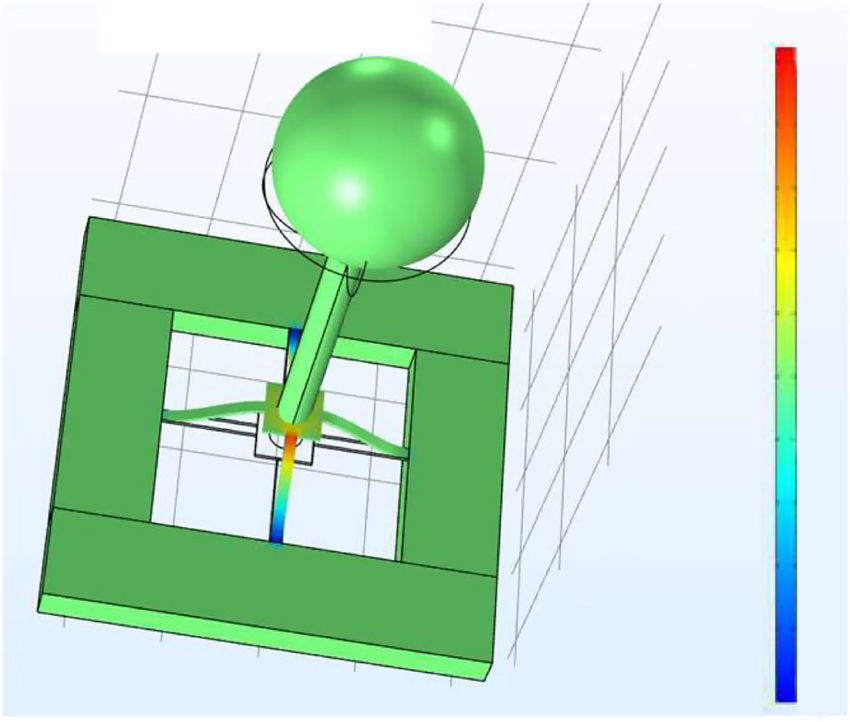
Wang et al. Microsystems & Nanoengineering (2021)7:1                                                                        Page 2 of 10

MEMS piezoelectric vector hydrophone based on a                                 Auditory organs of pectis jellyfish consist of otoliths,
cilium structure. Amiri et al.12 designed a flat cap                           auditory hairs, and supporting cells, as shown in Fig. 1a.
mushroom-shaped MEMS piezoelectric hydrophone.                                The auditory organ is naturally buoyant and can respond
These kinds of hydrophones were directional and could                         notably strongly to the sound of ultralow frequency.
bear relatively high hydrostatic pressure due to the open                     Inspired by the auditory organs of pectis jellyfish, we
structure. However, they have not been fabricated and                         propose a kind of otolith-inspired MEMS vector hydro-
measured so far, and only the design and simulation have                      phone (OVH) relying on a hollow buoyant sphere on top
been completed. Generally speaking, MEMS piezo-                               of the cilium, as shown in Fig. 1b. The bionic micro-
electric hydrophones are considered more sensitive than                       structure consists of two important parts: a cross-beam
other hydrophones, whether nondirectional or direc-                           structure and a cilium with otolith-shaped micro-
tional, measured or in design. The main concern is that                       structure. The cilium is mounted on the center of the
the fabricated devices are based on sealed membrane                           cross-beam microstructure, and piezoresistors are located
structures, bringing high sensitivity but low work depth.                     at the root of the beams. When an acoustic wave is
MEMS piezoresistive vector hydrophones have been                              applied on the cilium, the cilium vibrates, causing defor-
developed that have the advantages of low-frequency                           mation of the cross beam. Finally, the resistances of the
operation and miniaturized detection13. They were also                        piezoresistors change, which is converted to voltage sig-
proven to be able to resist high hydrophone pressure due                      nals via a Wheatstone bridge. Therefore, underwater
to their open structure. Much work has been done in this                      acoustic signals can be detected.
area, including microstructure parameter optimization,
cilium optimization, and package optimization. A                              Materials and methods
whisker-inspired MEMS vector hydrophone (WIVH)                                  When designing the microstructure, two key problems
was proposed, which was encapsulated with Parylene, in                        must be taken into account: increasing the sensitivity
order to improve the sensitivity–frequency response                           and broadening frequency of the band. To address this
performance14. A cup-shaped MEMS vector hydrophone                            issue, we must analyze the influence of the micro-
(CuVH) was presented with an improved sensitivity of                          structure on the sensitivity and frequency bandwidth. In
−209.2 dB@100 Hz (0 dB@1 V/μPa)15. A lollipop-shaped                          the acoustic-electric transduction process, the cilium
MEMS vector hydrophone (LVH) was developed, and its                           plays an important role in the perception of sound
sensitivity reached −205 dB@100 Hz (0 dB@1 V/μPa)16.                          waves, which transmit the vibration of medium particles
How can the performance of vector hydrophones be                              to the microstructure. It is observable that the cilium
further improved in the low-frequency range?                                  structure parameters have a great influence on the
                                                                              performance of the hydrophone. A full parametric
                                                                              analysis is performed to optimize the cilium structure.
                                                                              In addition, the hydrophone encounters shock in
a                                          b                                  launching and working procedures. It is also challenging
                                                                              to keep the structure robust to improve the sensitivity.
                                                                r             Shock resistance is researched. A sketch of the micro-
                                                                R             structure dimension is shown in Fig. 1b.

                                                           d                  Influence on the resonance frequency
                                                   h

                                                                                The resonance frequency is determined by the energy
                                                           L
                                                            b
                                                                              method. According to the law of conservation of
                                                                              energy, the strain energy Tmax and kinetic energy Vmax
                                                                              are constant in the case of free vibration without
                                                                              damping:
                                               t

                                                                                  Tmax ¼ Vmax                                       ð1Þ

 Fig. 1 Microstructure models of auditory organs of pectis
                                                                                When the cilium is subjected to a horizontal force Fx,
 jellyfishes and OVH. a Auditory organs of pectis jellyfishes, b OVH            two kinds of moments arise: a flexural moment Mx pro-
 with an otolith-shaped cilium and cross beam; b is the width of the          duced by the X-axis beam and a torque moment Mt
 beam, t is the thickness of the beam, l is the length of the beam, w is      produced by the Y-axis beam, which remain balanced
 the half-width of the mass square, h is the height of the rod, d is the      with an external force Fx, as shown in Fig. 2a.
 radius of the rod, R is the outer radius of the sphere, and r is the inner
 radius of the sphere.
                                                                                It can be assumed that the strain energy of the cilium
                                                                              and kinetic energy of the beam can be neglected.
Design and implementation of a jellyfish otolith-inspired MEMS vector hydrophone for low-frequency detection - Nature
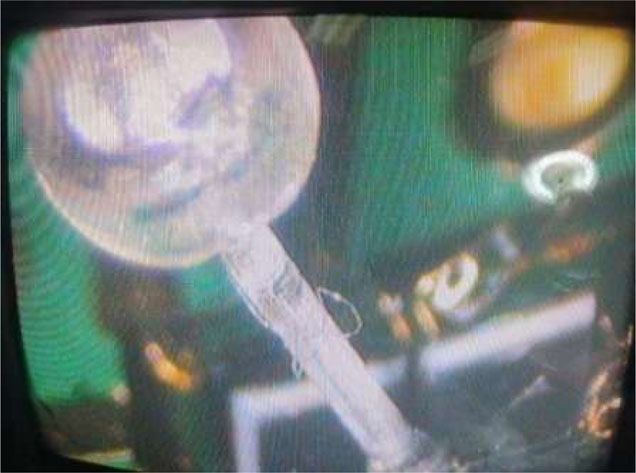
Wang et al. Microsystems & Nanoengineering (2021)7:1                                                                                                                                   Page 3 of 10

                                                                a

                                                                                     Fx

                                                                                                                                                  F
                                                                                 Mf                                                MA

                                                                A                                                                                 B

                                                                                           Mt
                                                                F     MA M
                                                                           x

       b
                                                                                 1000                                                                                                  1400

                           1200                                                  900                                1500                                                               1200
        frequency (Hz)

                           1000

                                                                                                 frequency (Hz)
                                                                                 800
          Resonance

                                                                                                   Resonance
                            800                                                                                     1000                                                               1000
                                                                                 700
                                  600
                                                                                 600                                                                                                   800
                                  400                                                                                    500
                                  200                                            500                                                                                                   600
                                    0                                            400                                       0
                                   0.25                                                                                        2                                                       400
                                                                             5   300                                                                                               1
                                          0.2                                                                                                                              0.8
                                                                      4                                                                 1.5                                            200
                                                0.15            3                200                                                                                  0.6
                                                                                                                                                       1         0.4
                      Radius of                        0.1 2                                                      Outer radius                             0.2
                                                               Height of                                          of sphere (mm)                                   lnner radius
                      cilium (mm)                                                                                                                                  of sphere (mm)
                                                               cilium (mm)

       c                                                                                                                                                                               ×105
                                                                                 ×105
                                  ×105                                                                             ×105
                                                                                                                                                                                       14
                                     5                                           4.5                                     15
                                                                                                      on the beam (Pa)
                                                                                                      Maximum stress

                                   4.5
               on the beam (Pa)
               Maximum stress

                                                                                                                                                                                       12
                                     4                                           4                                       10
                                   3.5                                                                                                                                                 10
                                     3                                           3.5                                      5
                                                                                                                                                                                       8
                                   2.5
                                                                                 3
                                     2                                                                                    0                                                            6
                                   0.25                                                                                        2
                                          0.2                                5   2.5                                                                                               1
                                                                                                                                        1.5                                  0.8       4
                                                                       4                                                                                              0.6
                                                0.15            3                                                                                      1         0.4
                    Radius of                          0.1 2                                               Outer radius                                    0.2
                    cilium (mm)                                Height of                                   of sphere (mm)                                           lnner radius
                                                               cilium (mm)                                                                                          of sphere (mm)

 Fig. 2 Analysis of the influence of the structure parameters on the resonance frequency and stress. a Mechanical analysis of the structure;
 b relationship of the resonance frequency and various structure parameters; c relationship of the maximum stress on the beam and various structure
 parameters.

  The strain energy of the beam consists of the bending                                         square, G is the shear modulus, and β is the torsion
energy and torsion energy:                                                                      coefficient.
                                                                                                  The kinetic energy of the cilium is as follows:
                                     Z l 2            
                                     1   Mx     1                                                                                   Z                                                                
    Vmax ¼ 2 ´                              dx þ Mt θl                                                      1                                 h
                                                                                                                                                                           4  3      
                                     2 0 EI     2                                                     Tmax ¼ ω2                                   ρπd 2 ðyθl Þ2 dy þ ρ ´     π R  r 3 ðh þ RÞ2 θ2l
                                                                                     ð2Þ                    2                                 0                            3
                 F 2 l3 þ 3Fv MA l2 þ 3MA2 l Gβbt 3 θ2l                                                                                                                                         ð3Þ
                ¼ v                         þ
                             3EI                l
                                                                                                  The relationship of the resonance frequency and various
where E is the elastic modulus of the cantilever beam, I is                                     structure parameters is demonstrated in Fig. 2b, which is
the moment of inertia, θl is the bent angle of the mass                                         obtained by modal analysis.
Design and implementation of a jellyfish otolith-inspired MEMS vector hydrophone for low-frequency detection - Nature
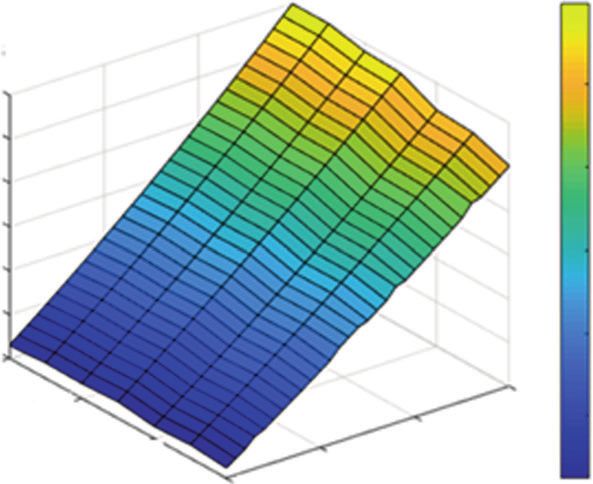
Wang et al. Microsystems & Nanoengineering (2021)7:1                                                                    Page 4 of 10

Influence on the sensitivity                                        presented LVH, CuVH, and WIVH, the maximum stress
  Assuming that an external pressure Px is applied on the          of the OVH is obviously higher, as shown in Fig. 3b.
cilium along the X-direction, the beam is bent and com-
pressed. The stress distribution on the cantilever beam is:        Influence on the shock resistance
                                                                     When the hydrophone encounters shock with accel-
                      3ð1 þ vÞ½ð3l þ 6wÞx þ ðl þ 3wlÞ
                                               2                   eration a, the beam is bent and compressed due to the
 σ x ðxÞ ¼                                                         inertia force of the cilium fc (the inertia force of the beam
              2bt 2 ½ð1 þ vÞðl2 þ 3wl þ 3w2 Þ þ 6βð5l2 þ 12wlÞ
                                                                   can be neglected). The maximum stress of the structure
              2                        ð2dh þ πR2 ÞPx
              dh þ πR2 ðh þ RÞ Px þ                                appears at the root of the silicon beam and does not
                                               bt                  exceed the fracture strength of Si (175 MPa).
                                                            ð4Þ
                                                                     When OVH encounters X-direction shock with
                                                                   acceleration ax, the stress analysis is similar to that of
  where v is the Poisson ratio of the beam and x is the
                                                                   the sensitivity. In view of the shape of the cilium, the
distance to the beam root.
                                                                   moment of inertia force is divided into two parts:
  The piezoresistors are distributed on the root of the
                                                                   the sphere and the rod, due to the different lengths of
beams, which are nearly the location of maximum stress.
                                                                   the force arm:
The output voltage of the Wheatstone bridge is approxi-
mately proportional to the maximum stress on the beam:
                                                                                                   3ð1 þ ν Þðl2 þ 3wlÞ
                                                                   σx   max   ¼
                                                                                  2bt 2 ½ð1
                                                                                          þ   ν Þðl2þ 3wl þ 3w2 Þ þ 6βð5l2 þ 12wlÞ
                                3ð1 þ ν Þðl2 þ 3wlÞ                                                              
Vo   x   ¼                                                                         1 2 2 4 3             
              2bt 2 ½ð1 þ ν Þðl2 þ 3wl þ 3w2 Þ þ 6βð5l2 þ 12wlÞ                     d h þ R  r 3 ðh þ RÞ πρax
                                                                                   2         3
                                                                                      2
                                  ð2dh þ πR2 Þ                                       d h þ 43 ðR3  r 3 Þ πρax
             dh2 þ πR2 ðh þ RÞ þ                Px πl Vin    ð5Þ                  þ
                                        bt                                                       bt
                                                                                                                                ð6Þ
where πl is the piezoresistance coefficient and Vin is the
input voltage. It can be concluded that the stress
distribution is related to the size parameters of the                When the OVH encounters a Z-direction shock with
microstructure.                                                    acceleration az, the inertia force of cilium is vertically
  Pressure loads are applied along the Y-direction, and the        applied on the central square, resulting in beam bending:
stress distribution curves with different parameters can be                                                             
obtained by static analysis. The relationship of the max-                             3ð2l2 þ 2bl þ bwÞ 2      4 3    
                                                                         σz   max   ¼                     d h þ R  r πρaz
                                                                                                                     3
imum stress on the beam and various structure para-                                      4bt 2 ð2l þ bÞ        3
meters is shown in Fig. 2c.                                                                                                     ð7Þ
  Taking the resonance frequency and maximum stress
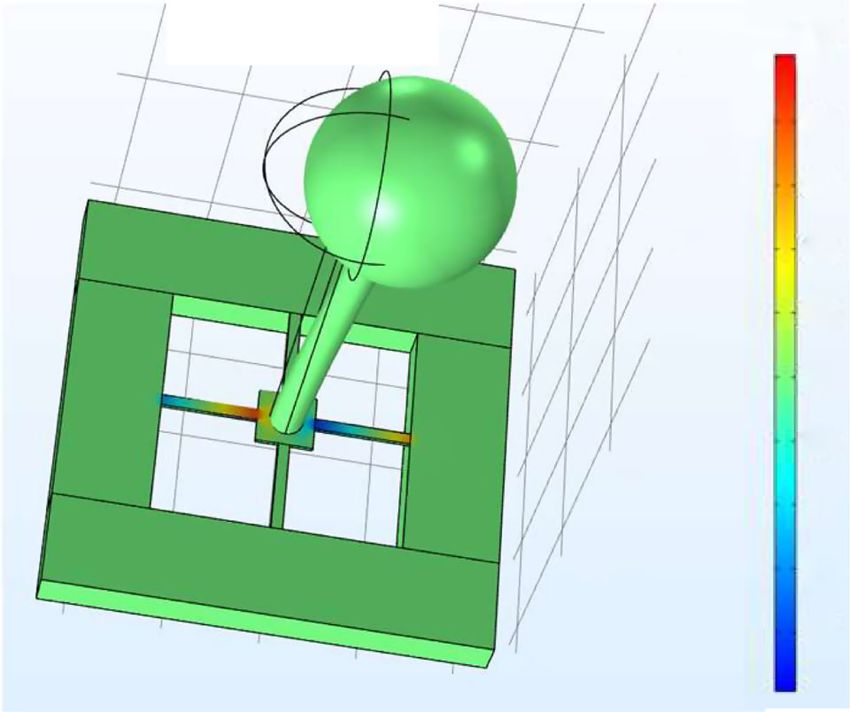
into consideration, the dimensions of the microstructure             Stress nephograms were simulated via Comsol Multi-
are illustrated in Table 1. The resonance frequency of the         physics (Fig. 4), in order to find the maximum stresses of
microstructure is 527 Hz in air and 314 Hz in water,               the OVH structures at an acceleration of 60 g along the
resulting in a working bandwidth as high as 200 Hz (an             X- and Z-directions, which were 115.8 and 12.5 MPa,
analysis is shown in the Supplementary File). Moreover,            respectively. In contrast, the corresponding maximum
the stress is optimized to realize high sensitivity. The           stresses of the LVH were 181.4 and 34.7 MPa. The cor-
stress nephogram on the microstructure is illustrated in           responding maximum stresses of the CuVH were 151.7
Fig. 3a. The stress distributions can be obtained from the         and 18.6 MPa. The maximum stresses of the WIVH along
nephogram. Compared to the case of the previously                  the X- and Z-directions were 38.7 and 4.2 MPa,

Table 1 Dimensions of the microstructure.

Dimension                                          Value                       Dimension                                      Value

Outer radius of the sphere (μm)                    1000                        Inner radius of the sphere (μm)                530
Radius of the rod (μm)                             175                         Height of the rod (μm)                         3500
Thickness of the beam (μm)                         40                          Length of the beam (μm)                        1000
Width of the beam (μm)                             120                         Width of the mass square (μm)                  600
Design and implementation of a jellyfish otolith-inspired MEMS vector hydrophone for low-frequency detection - Nature
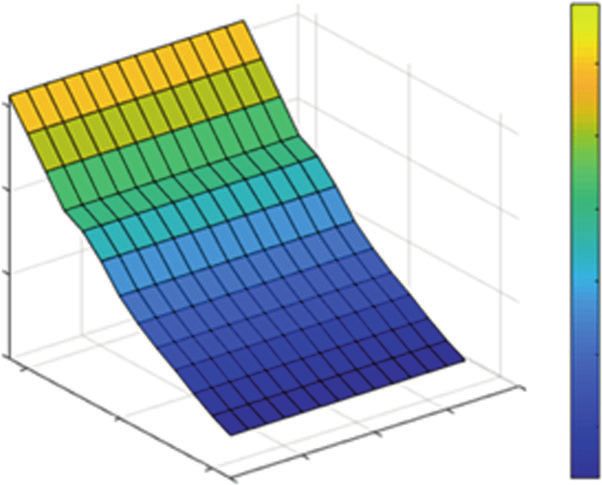
Wang et al. Microsystems & Nanoengineering (2021)7:1                                                                                                Page 5 of 10

   a                                                     b
                                                                         150                                              OVH
                                              N/m2
                                                     5                                                                    LVH
                                              ×10
                                                                                                                          CuVH
                                                                         100
                                               1.5                                                                        WlVH

                                               1                             50

                                                         Stress (kPa)
                                               0.5
                                                                              0
                                               0
                                                                         –50
                                               –0.5

                                               –1                       –100

                                               –1.5
                                                                        –150

                                                                                     0        500      1000       1500     2000             2500         3000
                                                                                                          Distance (µm)

 Fig. 3 Simulation and comparison of the stress on the microstructures. a Stress nephogram on the cross beam of the OVH when external
 pressure is applied on the cilium along the X-direction. b Stress distributions on the beams of various structures. Values of the X-axis indicate the
 distance of the site on the beam from the starting point.

       a                                                                                       b
                   Stress (N/m2)                                                  *108               Stress (N/m2)                                       *107
                                                                        1           1                                                          1           1
                                                                                    0.8
                                                                        0                                                                      0           0.8
                                                                                    0.6
                                                                                                                                                           0.6
                                                                             mm                                                                     mm
                                                                        –1                                                                     –1
                                                                                    0.4
                                                                                                                                                           0.4
                                                                                    0.2
                                                                        –2                                                                    –2           0.2

                                                                                    0                                                                      0

                                                                                    –0.2                                                                   –0.2
                                                         4
                                                                                                                                        4
                                                                                    –0.4                                                                   –0.4

                                                                                                                                                           –0.6
                                                     2 mm                           –0.6                                                mm
                                                                                                                                    2

                                                                                    –0.8                                                                   –0.8
                                              0                                                                                 0                          –1

 Fig. 4 Stress nephogram under 60 g shock along diverse directions. a Along the X-direction; b along the Z-direction. The maximum stress on
 the beam could be extracted as 115.8 MPa along the X-direction and 12.5.

respectively. In contrast with the structure with the stereo                               than the LVH and CuVH. It should be noted that the
cilium such as the OVH, LVH, and CuVH, the maximum                                         sensitivity of the OVH was higher than that of the LVH
stress of the WIVH was lower. It should be noted that the                                  and CuVH as a result of the otolith-shaped micro-
maximum stress of the WIVH was lower than that of the                                      structure. On the one hand, this design provides a high
OVH by 9.5 dB, but the average equivalent pressure sen-                                    receiving area and moment of force when the sound wave
sitivity of the WIVH was lower by 13.6 dB, as shown in                                     is intercepted. On the other hand, hollow spheres can
Table 2. In addition, the OVH could resist a higher shock                                  reduce the influence of shock.
Design and implementation of a jellyfish otolith-inspired MEMS vector hydrophone for low-frequency detection - Nature
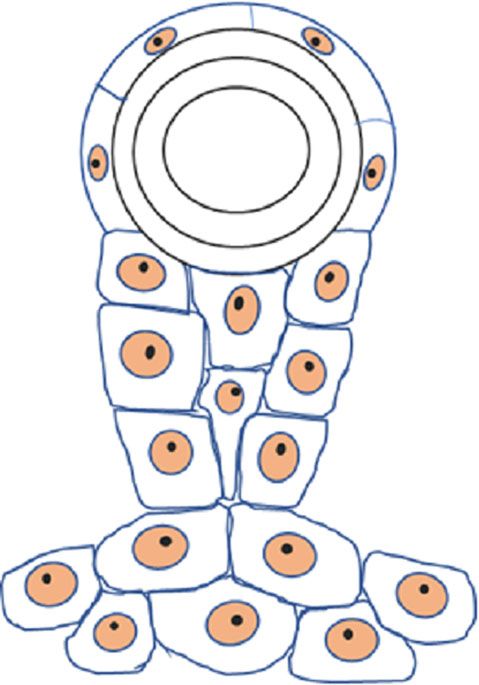
Table 2        Comparison of the measured equivalent pressure sensitivity and calculated pressure sensitivity under a static state.

Frequency (Hz)                           Receiving sensitivity Sx (dB)                                                               20 log(kd) (dB)                 Equivalent pressure sensitivity Sp (dB)

                                         OVH                    LVH                    CuVH                   WIVH                                                   OVH                LVH                CuVH               WIVH

20                                       −214.4                 −219.0                 −220.6                 −229.5                 −41.5                           −172.9             −177.5             −179.1             −188.0
31.5                                     −213.5                 −213.5                 −217.5                 −224.0                 −37.6                           −175.9             −175.9             −179.9             −186.4
40                                       −211.7                 −211.5                 −216.0                 −220.7                 −35.5                           −176.2             −176.0             −180.5             −185.2
50                                       −208.3                 −209.7                 −214.0                 −219.2                 −33.6                           −174.7             −176.1             −180.4             −185.6
63                                       −207.0                 −208.0                 −212.5                 −218.0                 −31.6                           −175.4             −176.4             −180.9             −186.4
80                                       −203.3                 −205.7                 −211.8                 −216.3                 −29.5                           −173.8             −176.2             −182.3             −186.8
100                                      −202.1                 −205.0                 −209.2                 −215.4                 −27.6                           −174.5             −177.4             −181.6             −187.8
125                                      −199.0                 −203.6                 −208.0                 −214.1                 −25.6                           −173.4             −178.0             −182.4             −188.5
160
                                                                                                                                                                                                                                       Wang et al. Microsystems & Nanoengineering (2021)7:1

                                         −194.7                 −201.8                 −206.0                 −212.7                 −23.5                           −171.2             −178.3             −182.5             −189.2
200                                      −191.7                 −199.2                 −204.7                 −211.4                 −21.5                           −170.2             −177.7             −183.2             −189.9
Average equivalent pressure sensitivity Sp (dB)                                                                                                                      −173.8             −177.0             −181.3             −187.4
Difference in the average equivalent pressure sensitivity compared to that of the OVH (dB)                                                                           –                  −3.2               −7.5               −13.6
Maximum stress on the beam via simulation (kPa)                                                                                                                      131.7              114.8              58.1               35.2
                                                                         a
Calculated pressure sensitivity under a static state Sp_c (dB)                                                                                                       −157.0             −158.2             −164.1             −168.5
Difference in the calculated pressure sensitivity under a static state compared to that of the OVH (dB)                                                              –                  −1.2               −7.1               −11.5
a              π l σ maxVin A
Sp c ¼ 20log        Mref        , πl is the piezoresistance coefficient, σmax is the maximum stress on the beam, Vin is the input voltage, A is the amplification factor, and Mref is the reference sensitivity of 0 dB (1 V/μPa).
                                                                                                                                                                                                                                           Page 6 of 10
Design and implementation of a jellyfish otolith-inspired MEMS vector hydrophone for low-frequency detection - Nature
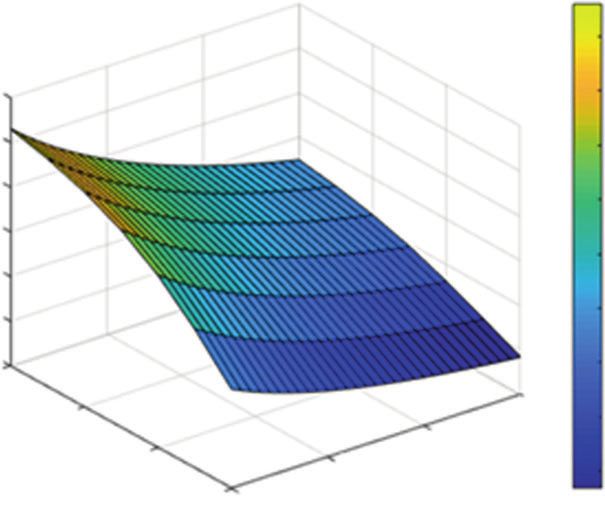
Wang et al. Microsystems & Nanoengineering (2021)7:1                                                                                      Page 7 of 10

                       (1) Thermal oxidation                  (2) 1st lithography, etch                (3) Boron light implantation,
                              on SOl                          SiO2 with 40 nm residue                          remove PR

                       (4) 2nd lithography,                  (5) Remove surface SiO2,                   (6) Sputter, 3rd lithography,
                    boron heavy implantation,                    anneal, remove PR                   etch, anneal to form ohm contact

                         (7) 4th lithography,                   (8) 5th lithography,                        (9) 6th lithography,
                        forward shallow etch                   forward through etch                    backside through etch, release

                                        Si       SiO2         PR          Light            Heavy        Metal
                                                                         boron Si         boron Si

 Fig. 5 Sketch of the microfabrication process. (1) Thermal oxidation; (2) 1st lithography, Etch SiO2 with 40 nm residue; (3) Boron light implantation,
 remove photoresist; (4) 2nd lithography, Boron heavy implantation; (5) Remove surface SiO2, anneal, remove photoresist; (6) Sputter, 3rd lithography,
 etch the metal, anneal to form Ohm contact; (7) 4th lithography, forward shallow etch; (8) 5th lithography, forward through etch; (9) 6th lithography,
 backside through etch, release the structure.

Microfabrication process of the OVH                                             Furthermore, the receiving sensitivity of MEMS
  The critical component of the MEMS hydrophone is the                        hydrophone Sx is given by:
cross beam, where the piezoresistors are distributed. The
dimensional parameters of the cross beam have a direct                                                    
                                                                                               ex =p
influence on the performance of the hydrophone. Hence,                               Sx ¼ 20log       tankd                                          ð9Þ
                                                                                                Mref
the cross beam is fabricated via the MEMS manufacturing
process. The specific process is illustrated in Fig. 5.
                                                                                Here, Mref is the reference sensitivity as 0 dB (1 V/μPa),
Calibration method                                                            and d is the distance from the water surface to the vector
  To verify the feasibility of the OVH, a sensitivity/                        hydrophone and reference hydrophone, both of which are
directivity test is accomplished in a standing wave cali-                     set at the same distance.
bration system. The output voltage of the OVH is com-                           In this experiment, d is set as 0.1 m. The frequency
pared with that of a reference hydrophone to obtain the                       ranges from 20 to 200 Hz, corresponding to
sensitivity of the OVH, which is calculated by:                               kd 2 ½0:009; 0:088, where tanðkdÞ  kd according to
                                                                              Taylor’s formula:
            ex sin kdr
    Mx ¼                                                             ð8Þ
            P cos kdM                                                                                                        
                                                                                                      ex =p               ex =p
                                                                                    Sx ¼ 20 log             kd ¼ 20 log           þ 20logðkdÞ
                                                                                                       Mref               Mref
where Mx is the sensitivity, ex is the output voltage of the
hydrophone, k is the wavenumber (k = ω/c), ω is the                                                                ¼ Sp þ 20 logðkdÞ
circular frequency, c is the sound wave velocity in water,                                                                                         ð10Þ
and dM and dr are the distances from the water surface to
the OVH and the reference hydrophone, respectively.
P can be obtained by measuring the output voltage of the                        Sp can be considered the equivalent pressure sensitivity
reference hydrophone17,18.                                                    of the MEMS hydrophone.
Design and implementation of a jellyfish otolith-inspired MEMS vector hydrophone for low-frequency detection - Nature
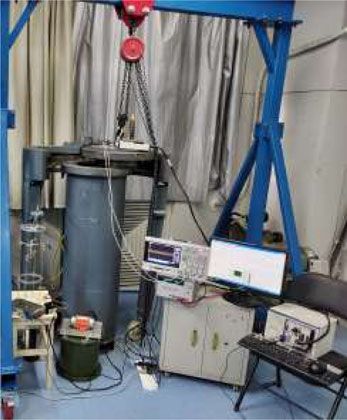
Wang et al. Microsystems & Nanoengineering (2021)7:1                                                                                                                                                            Page 8 of 10

                                             a                                                 b

                                                      200 µm

                        c                                                               Otolith-shaped
                                                                                        microstructure

                                                                                                                                                                           Package
                                                                                                                                                                           shell

                                                                                 Crossbeam
                                                                                 microstructure

                        d                                                                                e
                                                                                                                                                                     90     30
                                           –180                 OVH
                                                                                                                                                120                                    60
                                                                LVH
                                           –190                 CuVH
                                                                WlVH                                                          150                                                                      30
                                           –200
                        Sensitivity (dB)

                                           –210
                                                                                                         180                                                                                                0

                                           –220

                                                                                                                              210                                                                  330
                                           –230

                                                  0        50          100       150     200       250                                                                                 300
                                                                                                                                                240
                                                                       Frequency (HZ)                                                                                270

                                  f                                          g                           h
                                                                                                         Magnitude(mV)

                                                                                                                                     20

                                                                                                                                      0

                                                                                                                              –20
                                                                                                                                              1.85      1.9   1.95      2       2.05    2.1     2.15
                                                                                                                                                                     Time (s)
                                                                                                                                     3
                                                                                                                         Magnitude

                                                                                                                                     2

                                                                                                                                     1

                                                                                                                                     0
                                                                                                                                          0          1000      2000        3000          4000          5000
                                                                                                                                                              Frequency (Hz)

 Fig. 6 Measurement results of the OVH. a Microscopy photograph of the cross-beam microstructure. Cross beam, piezoresistors, metal lines, and
 shallow groove can be seen; b picture of an otolith-shaped cilium mounted on a beam; c picture of the chip on the PCB and in the shell; the otolith-
 shaped cilium has been mounted vertically on the center of the cross beam; d receiving sensitivity–frequency response curve; e directivity pattern at
 100 Hz with 3 dB polar width of the OVH at 87°; f setup of the 10 MPa hydrostatic pressure measurement; g otolith-shaped microstructure after the
 10 MPa test; h data acquisition under 10 MPa
Design and implementation of a jellyfish otolith-inspired MEMS vector hydrophone for low-frequency detection - Nature
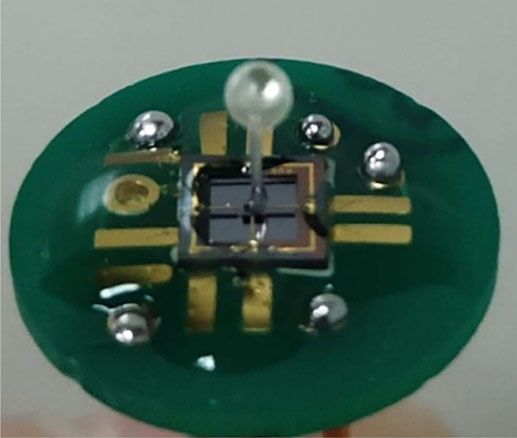
Wang et al. Microsystems & Nanoengineering (2021)7:1                                                                          Page 9 of 10

Results                                                             Measurement under hydrostatic pressure was per-
   A microscopy photograph of the microstructure is               formed, as shown in Fig. 6f, including the equipment to
shown in Fig. 6a. The cross beam is formed in the sus-            implement 10 MPa hydrostatic pressure and data acqui-
pending state. The piezoresistors are distributed on the          sition. The vibration motor was mounted to the hydro-
beam. The metal lines are intact. The shallow groove at           static pressure tube and utilized as a stimulating source.
the center can be observed, which is favorable in cilia           With 10 MPa hydrostatic pressure applied on the OVH,
alignment and integration.                                        the otolith-shaped microstructure maintained its original
   The otolith-shaped microstructure, with a hollow               shape without transformation, as shown in Fig. 6g. Data
buoyant sphere on the top of the rod, was manufactured            were acquired when the OVH was under the environment
by microprecision 3D printing equipment based on pro-             of 10 MPa hydrostatic pressure and vibration motor
jection microstereolithography technology (BMF micro-             operation. As shown in Fig. 6h, the vibration signal could
Arch P130, up to 2 μm resolution). Otolith-shaped cilia           be distinguished in the time zone, and the peak appeared
with UV-curable glue were mounted on the central hole             at 297.3 Hz in the frequency zone, which was in accord
of the cross beam by a customized alignment setup, as             with the resonance frequency of the OVH. These results
shown in Fig. 6b.                                                 indicate that the OVH could work well under 10 MPa,
   A physical photograph of the OVH is shown in Fig. 6c.          owing to the open structure and Parylene encapsulation.
Three-micrometer-thick Parylene was deposited con-
formally on the cilium and beam by SCS PDS 2010 to                Discussion and conclusions
ensure electrical insulation and structural protection. The         In this paper, optimizations of cilium structure are made in
otolith-shaped cilium was mounted vertically on the               order to realize high-sensitivity and low-frequency under-
center of the cross beam. Finally, the chip with the pro-         water acoustic detection, resulting in an otolith-shaped
cessing circuit was packaged in a shell.                          microstructure. Different parameters of the cilium structure
   The receiving sensitivity–frequency response curves of         influence the stress distribution and resonance frequency,
various MEMS hydrophones are shown in Fig. 6d. The                which are analyzed via a theoretical model and simulation.
equivalent pressure sensitivity Sp over the frequency range of    Stress distributions of the different hydrophones are con-
interest can be calculated thorough Formula (8), which is         trasted through simulations. Shock-resistance analysis shows
illustrated in Table 2. It can be seen that the average           that the OVH can resist higher shock than the LVH owing to
equivalent pressure sensitivity Sp over the frequency range of    otolith-shaped microstructure. Then, the fabrication process
interest of the OVH reaches −173.8 dB (0 dB@1 V/μPa), an          of the OVH is demonstrated. Finally, the OVH is tested in a
increase of 3.2 dB compared with that of the LVH, 7.5 dB          standing wave field. The results show that the average
compared with that of the CuVH, and 13.6 dB compared              equivalent pressure sensitivity Sp over the frequency range of
with that of the WIVH. The measurement results are in             interest of the OVH reaches −173.8 dB (0 dB@1 V/μPa), an
accordance with the simulation results extracted from Fig.        increase of 3.2 dB compared with that of the LVH, 7.5 dB
3b, as shown in Table 2. The absolute values of the calculated    compared with that of the CuVH, and 13.6 dB compared
pressure sensitivity in the static state deviate from those of    with that of the WIVH. Additionally, the OVH has a cosine
the measured average equivalent pressure sensitivity. This        directional pattern with a 3 dB polar width of 87°.
may be because calculation at the static state ignores the          Measurement under hydrostatic pressure indicates that
influence of dynamic damping. This deviation may also be           OVH could be feasible under 10 MPa, owing to the open
attributed to the effect of package structure, noise of the       structure and Parylene encapsulation. The test results agree
reference hydrophone, and misestimation of the piezo-             with the theoretical and simulation analysis, which verifies
resistance coefficient. Further investigation on the differences   the feasibility and advancements of the OVH in detecting
between the theoretical and experimental results should be        weak low-frequency underwater acoustic signals.
performed. It should be noted that the differences in the
calculated pressure sensitivity at the static state compared to   Acknowledgements
                                                                  This work was supported by the National Natural Science Foundation of China
the case of the OVH are consistent with those of the mea-         (Grant 51875535 and 61727806) and by 1331KSC, State Key Laboratory of
sured average equivalent pressure sensitivity.                    Precision Measuring Technology and Instruments (pilab1805). The authors are
   The directivity pattern of the OVH at 100 Hz is shown          grateful to BMF Material Technology Inc. for their cooperation on
                                                                  microprecision 3D printing and thank Mr. Songxiang Ji and Mrs. Shasha Yang
in Fig. 6e, exhibiting typical cosine directivity. The 3 dB       for their help in hydrostatic pressure measurement.
polar width of the OVH is measured as 87°, which shows
superiority compared with 96° for the LVH, 89° for the            Author details
CuVH, and 91° for the WIVH. This means that the OVH               1
                                                                   State Key Laboratory of Dynamic Testing Technology, North University of
would perform better in distinguishing the sound along            China, Taiyuan, China. 2College of Underwater Acoustic Engineering, Harbin
                                                                  Engineering University, Harbin, China. 3Hubei Key Laboratory of Modern
the sensitive axis than the LVH and slightly better than          Manufacturing Quantity Engineering, School of Mechanical Engineering, Hubei
the CuVH and the WIVH.                                            University of Technology, Wuhan, Hubei, China
Design and implementation of a jellyfish otolith-inspired MEMS vector hydrophone for low-frequency detection - Nature
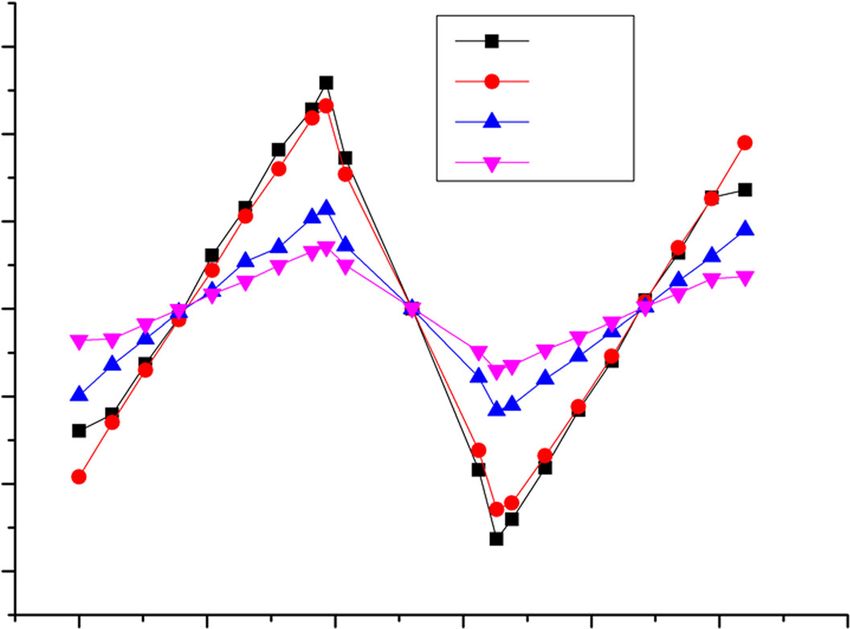
Wang et al. Microsystems & Nanoengineering (2021)7:1                                                                                                      Page 10 of 10

Author contributions                                                                    7. Palanisamy, P., Kalyanasundaram, N. & Swetha, P. M. Two-dimensional DOA
R.W. and W.D.Z. proposed the idea for the study. W.S. and W.J.Z. fabricated the            estimation of coherent signals using acoustic vector sensor array. Signal Pro-
sensors and performed the testing. J.S. carried out the resonance frequency                cess. 92, 19–28 (2012).
and stress simulations. R.W. and G.Z analyzed the data. R.W. and N.L.                   8. Lee, H., Choi, S. & Moon, W. A micro-machined piezoelectric flexural-
established the theoretical models. R.W. and W.S. wrote the manuscript. M.L.               mode hydrophone with air backing: benefit of air backing for
and C.X. provided advice in fabrication and measurement. All the authors                   enhancing sensitivity. J. Acoust. Soc. Am. 128, 1033 (2010).
discussed the results and the manuscript.                                               9. Sung, M., Shin, K. & Moon, W. A micro-machined hydrophone employing a
                                                                                           piezoelectric body combined on the gate of a field-effect transistor. Sens.
Conflict of interest                                                                        Actuator. A Phys. 237, 155–166 (2016).
The authors declare that they have no conflict of interest.                             10. Xu, J., Zhang, X., Fernando, S. N., Chai, K. T. & Gu, Y. AlN-on-SOI
                                                                                           platform-based micro-machined hydrophone. Appl. Phys. Lett. 109,
Supplementary information accompanies this paper at https://doi.org/                       3–8 (2016).
10.1038/s41378-020-00227-w.                                                            11. Ganji, B. A., Nateri, M. S. & Dardel, M. Design and modeling of a novel high
                                                                                           sensitive MEMS piezoelectric vector hydrophone. Microsyst. Technol. 24,
                                                                                           2085–2095 (2018).
Received: 24 September 2019 Revised: 22 September 2020 Accepted: 19                    12. Amiri, P., Kordrostami, Z. & Ghoddus, H. Design and simulation of a flat
October 2020                                                                               cap mushroom shape microelectromechanical systems piezoelectric trans-
                                                                                           ducer with the application as hydrophone. IET Sci. Meas. Technol. 14, 157–164
                                                                                           (2020).
                                                                                       13. Xue, C. Y., Chen, S. & Zhang, W. D. Design, fabrication, and preliminary char-
References                                                                                 acterization of a novel MEMS bionic vector hydrophone. Microelectron 38,
 1. Testa, C. & Greco, L. Prediction of submarine scattered noise by the acoustic          1021–1026 (2007).
     analogy. J. Sound Vib. 426, 186–218 (2018).                                       14. Wang, R. et al. Wide-frequency-bandwidth whisker-inspired MEMS vector
 2. McConnel, J. A. Analysis of a compliantly suspended acoustic velocity sensor. J.       hydrophone encapsulated with parylene. J. Phys. D. Appl. Phys. 49, 07LT02
     Acoust. Soc. Am. 113, 1395–1405 (2003).                                               (2016).
 3. Yildiz, S., Dorman, L. M. & Kuperman, W. A. Using hydrophones as vector            15. Xu, W. et al. Development of cup-shaped micro-electromechanical systems-
     sensors. J. Acoust. Soc. Am. 135, 2361–2364 (2014).                                   based vector hydrophone. J. Appl. Phys. 120, 124502 (2016).
 4. Ma, R., Zhang, W. T. & Li, F. Two-axis slim fiber laser vector hydrophone. IEEE     16. Liu, Y. et al. ‘Lollipop-shaped’ high-sensitivity microelectromechanical systems
     Photon. Techol. Lett. 23, 335–337 (2011).                                             vector hydrophone based on Parylene encapsulation. J. Appl. Phys. 118,
 5. Di Iorio, L., Gervaise, C. & Jaud, V. Hydrophone detects cracking sounds: non-         044501 (2015).
     intrusive monitoring of bivalve movement. J. Exp. Mar. Biol. Ecol. 432, 9–16      17. Gordienko, V. A., Gordienko, E. L. & Dryndin, A. V. Absolute pressure calibration
     (2014).                                                                               of acoustic receivers in a vibrating column of liquid. Acoust. Phys. 40, 219–222
 6. Heerfordt, A., Mohl, B. & Wahlberg, M. A wideband connection to sperm                  (1994).
     whales: a fiber-optic, deep-sea hydrophone array. Deep Sea Res. I 54, 428–436      18. Hong, L. J., Yang, D. S. & Shi, S. G. Study on a medium three dimensional co-
     (2007).                                                                               oscillating vector hydrophone. J. Vib. Shock 30, 79–84 (2011).
You can also read