COVID-19 Impacts & Adaptations Among Washington State Farm Businesses
←
→
Page content transcription
If your browser does not render page correctly, please read the page content below
WA FARM COVID-19 SURVEY WA Farm COVID-19 Survey, Research Brief 1
COVID-19 Impacts & Adaptations Among
Washington State Farm Businesses
Research Brief 1
ABOUT THE SURVEY
The Washington State (WA) Farm COVID-19
Impacts & Adaptations Survey was deployed from
December 1st, 2020 to January 31st, 2021 to capture
an end-of-season snapshot of farmer experiences
during the COVID-19 pandemic. A total of 265
responses from farmers and ranchers in 33 of 39 WA
counties were received. This brief provides an
overview of survey respondent characteristics,
impacts on farm businesses, challenges encountered,
changes made, and utilization of aid. We also provide
a synthesis of anticipated future challenges and needs.
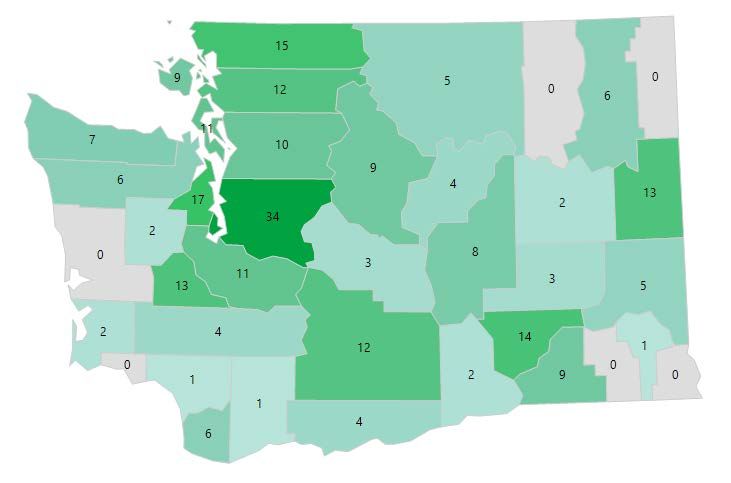
Figure 1. Geographic distribution of survey responses
KEY FINDINGS Diverse Farm Products
1. Different farms and ranches had different
• Over three quarters (76%) of farms surveyed
experiences depending on size, marketing scale,
produced more than one type of product.
type of production, and other features.
2. Operation costs increased for nearly 2/3 of farms. • The highest percentage of respondents produced
3. Customer relationships were strengthened for vegetables other than potatoes or onions (45%),
many farms marketing locally and regionally. followed by apples (28%), berries (22%), and
4. Many farms expanded their networks. culinary herbs and spices (20%, Fig. 2).
5. There are many concerns for the future, mixed • Overall, nearly half of respondents (48%) produced
with cautious optimism. at least one type of vegetable, 42% produced at least
6. Many farmers reported high levels of stress. one type of fruit, 36% produced at least one type of
animal product (including aquaculture), and 23%
produced at least one type of field crop.
RESPONDENT CHARACTERISTICS
A Mix of Farm Sizes and Types
Statewide Coverage • About two-thirds of respondents (68%) farmed less
• Responses were received from farmers and ranchers than 50 acres, and the remainder farmed at a variety
in 33 of 39 counties across the state (Fig. 1). of scales including those actively farming 2,000
• Approximately 60% of respondents farmed in acres or more (Fig. 3).
Western Washington and approximately 40% of • Of the 254 farms that were in business the year
respondents farmed in Eastern Washington. before the pandemic, more than half grossed less
• The highest density of responses came from King than $50,000 that year, and 70% grossed less than
County and other Puget Sound counties as well as $250,000. About one-fifth reported gross annual
Franklin, Spokane, and Yakima Counties. revenue of $250,000 or more (Fig. 4).
1 March 2021WA Farm COVID-19 Survey, Research Brief 1
• In 2019, 59% of respondents acquired at least one
Shellfish 2%
quarter of their total annual income from farming,
Aquaculture (other) 1% while 35% of respondents relied on off-farm
sources for three quarters or more of their total
Poultry 16% annual income.
Dairy 3%
• While 43% of farm businesses had been in
operation for 10 years or less, another 40% had
Beef 15% been in operation for 20 years or more (Fig. 5).
2000+ acres, 6%
Pork 12%
1000 - 1999 acres, 3%
Meat (other) 11% 500 - 999 acres, 3%
Hay/silage 14%
1 - 9 acres
Grains 10% 50 - 499 acres 45%
18%
Pulses 8%
Oilseeds 2% 10 - 49 acres
23%
Potatoes 18%
Onions 19% Figure 3. Acres actively farmed
Vegetables (other) 45%
Apples 28%
> $1M < $10K
9% 24%
Cherries 15%
$250K-$1M
Tree fruit (other) 19% 12%
Berries 22% $10K-$50K
$200K-$250K, 5% 22%
Wine grapes 3% $150K-$200K, 3% $50K-$100K
$100K-$150K, 6% 11%
Hops 2%
Figure 4. Gross annual revenue, 2019
Mushrooms 1%
< 1 year
Honey 6% 4%
Herbs/spices 20%
Cut flowers 18% 2-5 years
21%
>20 years
Nursery 9% 40%
Seeds 7%
6-10 years
Fiber 3% 18%
Value-added 15%
Other 15-19 years 10-15 years
11%
5% 10%
Figure 2. Types of product grown/raised (respondents Figure 5. Years in operation at time of survey
could select more than one category)
2 March 2021WA Farm COVID-19 Survey, Research Brief 1
Employment “We disked under 250 acres of potatoes
• The majority of farms (77%) had four or fewer due to processors cutting contracts.”
year-round full-time equivalent employees (FTE)
the year before the pandemic and just 19% of farms “Our local butcher has been so busy that
had five or more year-round FTE (Fig. 6) we can hardly get in which has been our
• At peak season, 58% of farms had four or fewer
biggest difficulty.”
FTE and 33% had five or more FTE.
“Just decided to do less this year
because it couldn’t all happen.”
8%
12%
“Receiving the designation of critical,
3% essential infrastructure boosted the
13% urgency and value of local farms and
8% farmers.”
8% 8%
Closure of direct marketing
35% 20% 43%
outlets
Closure or reduced capacity of
22% 24% 48%
13% indirect marketing channels
64% 50%
Disruption of distribution systems 19% 29% 48%
Difficulty retaining or finding
17% 24% 55%
workers
Employee Type
Number of Employees Year-round Lack of access to working capital 17% 14% 63%
0 1-4 5-9 10-29 >30 Peak Season
Figure 6. Year-round and peak-season employees, 2019 Product going to waste 15% 23% 58%
Low prices 15% 20% 60%
IMPACTS ON FARM BUSINESSES Closure and/or decreased access
15% 13% 66%
to processing facilities
Areas of Impact
• Respondents reported the most significant COVID- International trade issues 14% 11% 68%
19 impacts related to closure of direct marketing
Lack of storage capacity 13% 12% 71%
outlets, closure or reduced capacity of indirect
marketing channels, and disruption of distribution Reduced availability of farm
11% 29% 56%
inputs
systems (Fig. 7).
Limited availability of
• When those who reported minor impacts are also transportation
7% 15% 74%
considered, other frequent sources of disruption
included difficulty retaining or finding workers, Significant impact Minor impact
No impact Prefer not to answer
reduced availability of farm inputs, and product
going to waste. Figure 7. Impact of COVID-19-related issues in 2020
• While overall fewer respondents reported being
affected by international trade issues, lack of access Many Farms Saw Revenue Decreases,
to working capital, or limited access to processing Some Saw Increases
facilities, the proportion of respondents who were • Thirty-nine percent of respondents indicated a
affected by those issues tended to report impacts decrease in revenue of up to $50,000 in 2020
that were significant rather than minor (56%, 55%, compared to 2019. An additional 9% indicated
and 54% significant vs. minor, respectively). losses of more than $50,000.
• Sixty percent of respondents said their business had • Overall, nearly half of respondents (48%)
been negatively impacted overall by COVID-19, experienced revenue loss in 2020 compared to
and 30% said the overall impact had been positive. 2019, while 39% saw revenue increases (Fig. 8)
3 March 2021WA Farm COVID-19 Survey, Research Brief 1
• Revenue changes for smaller farms (those grossing Increased Costs for Producers and
less than $250,000 annually) were about evenly Consumers
mixed with 45% experiencing revenue decreases • Nearly 2 in 3 producers (65%) experienced
and 43% experiencing revenue increases in 2020 increased operation costs as a result of COVID-19,
compared to 2019 (Fig. 9). and the same percentage said they increased the
• The majority (58%) of larger farms (those grossing sales price of their products as a result of the
more than $250,000 annually) experienced revenue pandemic.
decreases, with just 32% experiencing revenue • Enhanced safety and sanitation measures were a
increases in 2020 compared to 2019 (Fig. 10). leading cause of increased operation costs. Those
• Almost one third (31%) of respondents experienced with the most significant impacts were increasing
a loss of off-farm income in 2020 compared to cleaning, increasing availability of sanitation centers
2019. and cleaning supplies, and providing PPE (Fig. 11).
Increased >50%, 4% • Major sources of increased production cost not
related to safety and sanitation included increased
cost of inputs (feed, seed, etc.) and processing,
additional labor expenses, increased packaging, and
increased marketing and distribution costs.
Increased
Decreased 10%-24% “Fear to go to work… enormous costs
25-50% 14% associated with temping employees and
20%
cleaning to make everyone and everything
IncreasedWA Farm COVID-19 Survey, Research Brief 1
CHANGES AND ADAPTATIONS “[Boosting] production now that food
shortages were becoming an issue.
Different Farms Made Different Changes Focusing on high demand vegetables.”
to Production, Many Encountered
Obstacles to Change “Growing longer storage veggies and
• Forty-four percent of farms increased production getting more freezer space for fruit.”
and 29% of farms decreased production in 2020
compared to 2019 (Fig. 12).
• More than half of farms (58%) made at least one Sales Shifted Towards Direct to Consumer
change in type, amount, or timing of production in and Food Hubs, Away from Farmers
response to COVID-19 in 2020. Markets, Direct to Restaurant, and Direct
• The most frequent changes made were increases in to International
production volume (22%), decreases in production • Over one quarter of respondents (29%) reported
volume (16%), increasing the diversity of products having started at least one new marketing channel in
produced (14%), and decreasing the diversity of 2020 compared to 2019 (Fig. 13).
products produced (14%).
• Marketing channels most frequently started in 2020
• More than one in three farms (35%) said there were were direct to consumer and food hub sales,
production changes they wanted to but were unable followed by direct to grocery and on-farm sales.
to make. Financial and labor issues were among the
• Marketing channels most frequently stopped in
most frequently cited obstacles to making changes.
2020 were direct to restaurant and farmers market.
• In examining the proportion of farm businesses’
Increased > 50%, 4% total annual revenue coming from various
marketing channels in 2020 compared to 2019, the
greatest decreases were seen in direct to
international, farmers market, and direct to
restaurant channels, while the greatest increases
Increased were seen in direct to consumer and food hub
10%-24% channels (Fig. 14).
13%
Direct to Consumer 8%
1%
Food Hub 8%
Increased < 10% 3%
17% Direct to Grocery 4%
No change 3%
24% On-farm 4%
4%
Distributor 3%
2%
Figure 12. Change in production volume, 2020 CSA 3%
3%
compared to 2019 2%
Direct to Instutution
1%
Processor 2%
1%
2%
“Because we have a lot of experience, 40+ Direct to Restaurant
6%
years and extensive infrastructure, we Farmers Markets 2%
8%
added several months of sales by adding 0%
Direct to International
new products normally not sold. Learned 2% Start Stop
new packaging methods and negotiating Figure 13. New marketing channels started and existing
skills.” channels stopped in 2020, compared to 2019 (percent
of total respondents)
5 March 2021WA Farm COVID-19 Survey, Research Brief 1
Direct to Consumer 9% “Just didn't have the people when I needed
Food Hub 6% them to get stuff done on time.”
On-Farm 4%
Direct to Grocery 4%
“Lacking sales, employees were redirected
4%
Direct to Institution
to maintenance tasks for 2 months.
CSA 4% Reduced hours has also helped during
Distributor 0% some particularly slow times.”
-3% Processor
-8% Direct to
Restaurant “We became lean, worked longer hours
-15% Farmers Markets
with fewer people.”
-26% Direct to International
Figure 14. Change in gross annual revenue attributable
Reduced number of employees 17%
to specific marketing channels for those farm
businesses utilizing a channel in 2019 and/or 2020 Reduced hours of existing
17%
employees
Delayed hiring of new employees 14%
“We have started selling in three different Hired fewer employees than
online marketplaces. This required planned
13%
significant time to learn and implement.” Increased hours of existing
8%
employees
Hired more employees than
7%
Some Farms Reduced Workforce, Some planned
Couldn’t Find Workers Furloughed existing employees 7%
• Of the 196 farms who had employees, 42% made
reductions in employee numbers, hours, or hiring Figure 15. Workforce changes made due to COVID-19
plans, while 10% increased employee numbers or (percent of total respondents)
hours due to COVID-19.
• The most common types of labor reductions were
Many Locally and Regionally Marketing
letting go employees and reducing the number of Farms Increased Customer Connections
hours worked by existing employees (Fig. 15). • Overall, roughly equal numbers of farms saw
• Of those who let go or furloughed employees, increases (39%) and decreases (32%) in the size of
leading reasons were “reduced demand for their customer base (Fig. 16).
products” (40%), “lack of payroll funds” (30%), • Of farms marketing predominantly (>75%) locally
“inability to support social distancing and/or safe and regionally,* more than half increased the size of
handling practices” (30%), and “lack of available their customer base, whereas the majority of farms
workers” (28%). marketing predominantly (>75%) nationally or
• While just over half (53%) of farms with employees internationally either experienced no change or
reported no days of work lost due to COVID-19 could not tell if there was a change.
cases, suspected cases, or self-quarantine, another • Customer relationships were weakened for some
43% did report days of work lost for these reasons. farms (23%) but were strengthened for more (36%).
• More than one out of every three farms with • Of farms marketing predominantly locally and
employees (34%) reported at least some days of regionally, 44% reported strengthened relationships
work lost from employee reluctance to work due to with customers, whereas the majority of farms
health concerns related to COVID-19. marketing predominantly nationally or
internationally either experienced no change or
“Wanted to increase our produce but could not tell if there was a change the strength of
couldn't find helpers.” their customer relationships.
* Locally = within a geographic area e.g., Olympic Peninsula, regionally = WA/OR/ID
6 March 2021WA Farm COVID-19 Survey, Research Brief 1
Customer Base Customer Relationships Many New Working Relationships and
Networks Were Formed
13% 19% 13% • More than one out of every three respondents
20% (37%) said they had formed new working
relationships as a result of COVID-19 (see Box 1).
21% 23%
20% 11% • Eighteen percent had formed working relationships
with other farms, 18% with collaborative networks
11% 12%
14% 18% such as co-ops and food hubs, and 11% with other
agribusinesses.
All Respondents
UTILIZATION OF AID PROGRAMS
9% 17% 15%
13%
25% Many Farmers Applied for Aid, Some
10% Encountered Obstacles
13% 29% • More than half (54%) of respondents applied for at
28%
14% least one COVID-19 relief program. Overall, 31%
13%
14% of respondents applied for the Coronavirus Food
Assistance Program (CFAP), 25% applied for the
>75% Local/Regional Marketing Payroll Protection Program (PPP), 11% applied for
3% Economic Injury Disaster Loans (EIDL), 3%
6%3% 5% applied for Pandemic Unemployment Assistance
27% (PUA), and 1% applied for Federal Pandemic
33%
Unemployment Compensation (FPUC).
39%
• Forty three percent of respondents did not apply
8% 46%
for a relief program. Among those not applying for
9%
9%
11% aid, top-cited reasons included choosing not to
apply (19% of all respondents), not being eligible
>75% National/International Marketing (19%), not having enough information about
available programs (9%), confusion about the
Significantly increased / strengthened
Slightly increased / strengthened application process (9%), and the amount of
No change documentation required (5%). Some respondents
Slightly decreased / weakened cited more than one reason for not applying.
Significantly decreased / weakened
Can’t tell or don’t know • Among those who did apply for aid, 36% had no
challenges with the application process. However,
Figure 16. Change in size of customer base and strength
more than half of applicants reported having
of customer relationships due to COVID-19
encountered challenges. Top challenges included
confusion about the application process (43% of
“Zooming at night brought folks together not just to
talk shop but to talk … generated sharing ideas.” those applying for relief programs), the amount of
documentation required (21%), not enough
“Worked with [a] group of local farmers to create a information about programs (16%), and poor
cooperative food hub.” internet access (7%).
• Many respondents noted the importance of relief
“[Started] food processing with local restaurants.” programs for their businesses in 2020, but many
also expressed frustration with lack of clear
“Switched to online market and opened up sales
with other producers. Very challenging and a lot of
information, burdensome application processes, and
work to pivot but ended up being very successful.” programs advantaging larger farms (Box 2).
Box 1. Respondent comments on network relationships
7 March 2021WA Farm COVID-19 Survey, Research Brief 1
The Majority of Aid Applications Were
IMPACT / SUCCESS Approved, Larger Farms Were More
Successful Than Smaller Farms
“These programs have been really helpful to our
business this year!”
• Overall, 70% of aid applications were approved,
with decisions still pending for another 17% at the
“Every little bit helps!!” time the survey was conducted.
• Nearly one in six aid applications by farms grossing
“CFAP made the difference between profitable and
less than $250,000 annually was denied, while
not.”
applications from farms grossing more than
“Received help from my HR office from off farm $250,000 annually were denied much less frequently
work, and … from a local nonprofit for CFAP2 or I (Fig. 17).
would not have identified these relief options.”
79%
65% Annual Revenue > $250K
ELIGIBILITY / APPLICABILITY Annual Revenue < $250K
“I looked into funding...way too complicated for a 7% 16%
farm of my size and the type of farming.”
Approved Denied
“Additional funding to conservation districts would Figure 17. Aid application status by farm revenue
be helpful since they have the ability to direct those
funds to small and mid-size farms instead of large
agri-business for whom the majority of relief LOOKING TO THE FUTURE
programs were scaled. As a family farm there's no
point in us trying to access those funds because it's Many Changes Planned for 2021,
not scaled for us at all.”
Especially in Production & Marketing
“I was never eligible for any of the assistance • More than two thirds of respondents anticipated
programs being too small of a farm.” making significant changes in 2021 in relation to
COVID-19.
FRUSTRATIONS / SUGGESTIONS • Leading areas of anticipated change were
production volume, production/planting schedule,
“Lack of information on PPP forgiveness very and marketing channels (Fig. 18).
frustrating.”
Production volume 38%
“Would have really helped to be able to apply for the
low interest loans, but the time period to apply was Production/planting schedule 32%
too short and it was unclear that we would qualify Marketing channels 27%
before the program was gone.”
Processing and value added 19%
“Government agencies not provided with additional Workforce 18%
staff corresponding to increase in paperwork for
COVID assistance programs, leading to significant Automation 11%
delays in application review.” Suppliers 10%
“Owner-operators of very small farms were having Technological infrastructure 9%
to compete for grants and loans with large
commercial operations. We lost out. Other grant Figure 18. Areas in which respondents anticipated
and loan programs were either not open to farmers making significant changes in relation to COVID-19 in
or we were competing with national chains, 2021.
restaurants, and all other types of businesses.”
“We hope to double production and
automate as much as possible so as to not
Box 2. Respondent comments on aid programs, need to bring in hired help.”
eligibility, and application process
8 March 2021WA Farm COVID-19 Survey, Research Brief 1
“We expect to produce more and to hire Grant Funding, Help with Distribution
more employees. We hope to incorporate Channels, and Help Building Networks
software and app technology to more are Top Needs for 2021
efficiently keep records.” • More than half of respondents said that increased
grant funding would be beneficial to maintaining
Unforeseen Expenses, Processor smooth operations in 2021 (Fig. 20).
Capacity, and Supply Chain Disruptions • Approximately one third of respondents said that
Are Top Concerns for 2021 programs to facilitate new distribution channels and
• More than 80% of respondents were concerned collaborative farm networks would be helpful in
about unforeseen expenses in 2021, and 70% were 2021.
concerned about their ability to adapt to market • Between one fifth and one quarter of respondents
uncertainty (Fig. 19). also said that increased extension support, cost
• Nearly three quarters of respondents (72%) were share programs, COVID-19 compliance guidance,
concerned about disruptions to their input supply and programs promoting infrastructure flexibility
chains in 2021, and 59% were “very concerned” would be helpful.
about the capacity of processors. Increased grant funding 55%
• More than one third of respondents also said that Programs that facilitate new
they were either very or moderately concerned 33%
distribution channels
about their ability to offer competitive wages, the Programs that facilitate
31%
availability of labor, the availability of government collaborative farm networks
aid, disruptions to distribution channels, their ability Increased extension support 25%
to adapt to changing consumer preferences, access
Increased cost-share programs 24%
to medical care, and ability to follow safety
guidelines. Guidance for COVID-19
22%
compliance
Programs promoting
Capacity of processors 59% 20% 17% 20%
infrastructure flexibility
Unforeseen expenses 35% 47% 15% Increased business loans 15%
Ability to adapt to market
25% 45% 28% Figure 20. What would be most beneficial for
uncertainty
maintaining smooth operations in 2021
Ability offer competitive wages 23% 26% 48%
Availability of government aid 23% 23% 50% “We have reduced or eliminated all
planned capital investments into
Disruptions in input supply chain 23% 49% 25% infrastructure upgrades on our farm.”
Access to medical care 22% 21% 55%
Disruptions in distribution “We need to plant additional crops, but
21% 37% 38%
channels the reduction in net income during 2020
Ability to adapt to changing
consumer preferences
20% 38% 39% will limit what we can afford to do in 2021
(both materials and wages).”
Availability of labor 18% 33% 46%
Availability of off-farm
14% 21% 62% Preparedness to Adapt to Future
employment
Ability follow safety guidelines 14% 24%
Challenges
59%
• When asked about business support networks and
Very concerned Moderately concerned personal and workforce resilience, 83% of
Not concerned Prefer not to answer respondents said they were at least somewhat
Figure 19. Concerns for 2021 confident they could find ways to adapt to
challenges that may arise related to COVID-19 in
“I don't have a clue where my market is...” 2021 (Fig. 21).
9 March 2021WA Farm COVID-19 Survey, Research Brief 1
• When asked about farm business financial health “We need to scale back to be sustainable
and confidence in being able to afford to make any for ourselves. Avoiding burnout is now a
changes that might be necessary in 2021 related to major focus and concern.”
ongoing COVID-19 impacts, 69% of respondents
said that they were very or somewhat confident.
More than a quarter of respondents were not 43%
confident they could afford to make such changes 7%
(Fig. 22). 31% 38%
17%
“Had to spend a lot of time increasing and 18%
expanding online presence. Hoping this 31%
will help into next year.”
Normal Mild
Stressed Anxious Depressed
Moderate Severe
“Stoicism helped the most.” PHQ-4 sub-scales No response
Figure 23. Stress, anxiety, Figure 24. PHQ-4 anxiety
3%
and depression and depression scale
10% 9% 15%
26%
19% ACKNOWLEDGEMENTS
The research team is grateful to the many farmers
54% and ranchers who took time to share their
57% experiences, and to the individuals and
organizations who provided input and helped with
Very confident Not very confident survey dissemination. We also wish to thank the UW
Somewhat confident Not at all confident Nutritional Sciences Program for their support.
Figure 21. Confidence in Figure 22. Confidence in
adaptability: personal / adaptability: financial ABOUT THE RESEARCH TEAM
social / network capacity capacity The WA Farm COVID-19 Survey was a joint effort
between the UW, WSU, and WSDA. Sarah Collier is
an Assistant Professor in the Nutritional Sciences
STRESS AND MENTAL HEALTH Program (NSP) and Department of Environmental
Health Sciences (DEOHS) at UW. Anna Fogel is a
graduate student in NSP at UW. Madison Moore is
Stress is High Among Farmers and an Agricultural Economist at WSDA. Yona Sipos is an
Ranchers Assistant Teaching Professor in NSP and DEOHS at
UW. Laura Lewis is the Director of the Food Systems
• Forty-three percent of respondents reported feeling
Program and an Associate Professor in Community
stressed all or most of the time in the past 30 days and Economic Development at WSU. Laura
(Fig. 23). Raymond is the Regional Markets Program Manager
• Based on the past 30 days, nearly one quarter of at WSDA.
respondents experienced moderate to severe anxiety
Further Information
and depression as determined using the validated
URL: https://nutr.uw.edu/cphn/wafarm
Patient Health Questionnaire 4-item (PHQ-4)
Email: foodsystems@uw.edu
assessment tool (Fig. 24).
Suggested Citation
“Stress of keeping the crew healthy.” Collier, S.M., Fogel, A., Moore, M., Sipos, Y., Lewis, L., and
Raymond, L. “COVID-19 Impacts & Adaptations Among
Washington State Farm Businesses, Research Brief 1”
(March 2021). WA Farm COVID-19 Survey.
“Biggest issue is worry.” https://nutr.uw.edu/cphn/wafarm/brief-1
10 March 2021You can also read