Analysis of Watershed Vulnerability to Flooding in Haiti
←
→
Page content transcription
If your browser does not render page correctly, please read the page content below
World Applied Sciences Journal 4 (6): 869-885, 2008
ISSN 1818-4952
© IDOSI Publications, 2008

                        Analysis of Watershed Vulnerability to Flooding in Haiti

                                            Scot E. Smith and Daniel Hersey

                         Professor, Geomatics, University of Florida, Gainesville, FL 32611
                                  GIS Analyst, St Johns County, St Augustine, FL

    Abstract: A GIS-based analysis of watersheds in Haiti was performed with the objective of identifying the most
    vulnerable watersheds to flooding. We ranked a set of indices (soil erosion potential, potential of soil for
    agricultural use, population vulnerability, road infrastructure vulnerability, shopping market infrastructure
    vulnerability, irrigation infrastructure vulnerability and total infrastructure vulnerability) with respect to risk of
    flooding. This analysis produced a versatile and standardized approach to assessing watersheds with several
    advantages over more conventional approaches, notably:

         Decision-making tool which is based on quantitative data
         Rapid assessment based on GIS data
         Defensible rationale to develop strategies and orient aid agency activities in three major sectors:
         - Odisaster preparedness and risk management
         - Onatural resource management
         - Oinfrastructural investment
         Effective framework to organize and integrate spatial data for planning, evaluative and monitoring purposes
         Reference database for current and future analytical purposes

                   INTRODUCTION                                       most of Haiti’s formerly forested land is bare of trees
                                                                      [2 and 3].
     The island of Haiti has always been flood-prone due                    In Haiti, trees are used as fuel for cooking and other
to its location in the Caribbean and rugged terrain.                  activities involving fire. Even industries not normally
Tropical storms and hurricanes are an all-too-frequent                attributed to fuel wood consumers, such as dry cleaning,
occurrence [1]. The tropical island is in the path of                 are responsible for a high demand for fire wood. Land
seasonal weather disturbances and is frequently hit with              owners, tenants and thieves routinely cut and sell
heavy precipitation and high velocity winds. It has been              firewood for these purposes [4].
particularly hard hit in the 2008 hurricane season.                         Figure 3 is a recent satellite image of Haiti and the
     In September 2004, wide swaths of the northern part              Dominican Republic. The international border is marked in
of Haiti, beginning with the Central Plateau to Cap Haitien           yellow, but it is hardly necessary to demark the two
and East to Port au Paix were inundated with water from               countries. Haiti is largely devoid of vegetation compared
Hurricane Jeannie as shown in Fig. 2. Haiti had suffered in           to the Dominican Republic which still is dominated with
the past from tropical storms and hurricanes, but this was            forests.
one of the worst is memory. Several thousand people died                    The international community took notice of the
either directly or indirectly from the flooding, millions of          severity of the loss of forest and it’s relation to flooding
dollars of damage to infrastructure was incurred and tons             after the 2004 flood. The World Bank and the Inter-
of soil was eroded from the hill sides to the sea.                    American Development Bank developed a set of “priority”
     One reason for the susceptibility to and severe                  watersheds in Haiti which were selected based on their
damage from flooding is the degree of deforestation in the            importance as areas vulnerable to flooding and the loss of
country. Deforestation has always been a problem for                  human life and property in addition to areas with
Haiti, but it accelerated during the period of French                 significant opportunities for economic development [5].
colonization. At this time large swaths of forest, especially         All the “priority” watersheds are ridge-to-reef systems
hardwood, were clear cut and never re-planted. Today,                 and include all of the major coastal urban populations of

Corresponding Author: Scot E. Smith, Professor, Geomatics, University of Florida, Gainesville, FL 32611
                                                                869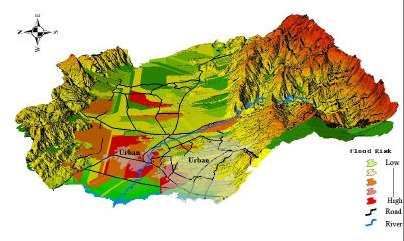
World Appl. Sci. J., 4 (6): 869-885, 2008

Fig. 1: Flood Prone Areas in Haiti
      Adapted after Guilland (2005)

                  Before Hurricane Jeanie (12 May 2004)                            After Hurricane Jeannie (26 September 2004)

Fig. 2: Hurricane Jeanne’s damage to Haiti is evident in this pair of ASTER satellite images of Gonaives. A gray
        “stream” coming down from the middle center of the left image is the gravel deposits left from flood waters
        that covered part of Gonaives.
        Source of image: NASA/GSFC/METI/ERSDAC/JAROS and U.S./Japan ASTER Science Team

                                                              870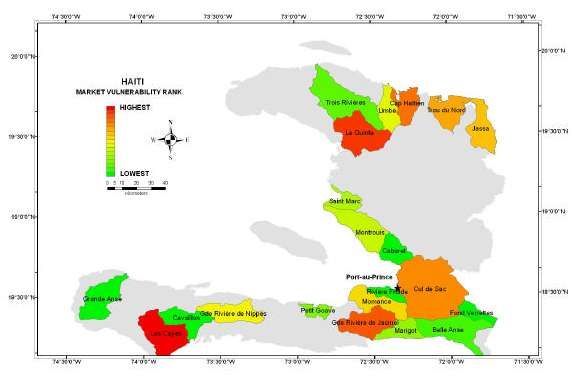
World Appl. Sci. J., 4 (6): 869-885, 2008

Fig. 3: Satellite Image of Haiti and Dominican Republic
       Source: Google Earth

Fig. 4: High Priority Watersheds

                                                           871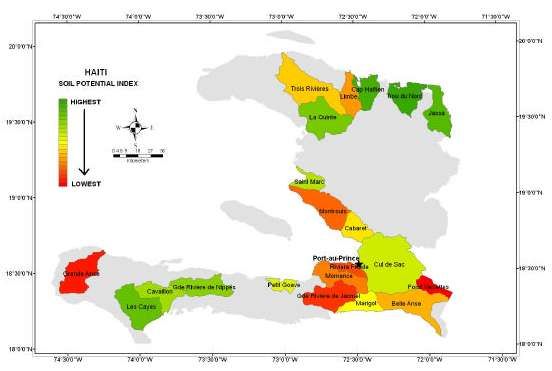
World Appl. Sci. J., 4 (6): 869-885, 2008

Table 1: “High Priority” Watersheds in Haiti
Sub-Basin Code                     Sub-basin Name                              Basin Name                                 Area (km 2)
3                                  Trois Rivières                              Versant Nord, NORD-OUEST                      898
5                                  Bassin du Limbé                             Limbé, NORD                                   313
6                                  Cap Haïtien                                 Cap Haïtien, NORD                             325
8a                                 Trou du Nord                                Nord-Est, NORD                                428
8c                                 Jassa                                       Nord-Est, NORD                                439
9                                  La Quinte                                   La Quinte, CENTRE-NORD                        700
12a                                Saint Marc                                  St. Marc/Arcahaie, CENTRE-SUD                 215
12b                                Montrouis                                   St. Marc/Arcahaie, CENTRE-SUD                 604
12c                                Cabaret                                     St. Marc/Arcahaie, CENTRE-SUD                 300
13                                 Cul de Sac                                  Cul de Sac, CENTRE-SUD                       1598
14                                 Fond Verrettes                              Fond Verrettes, CENTRE-SUD                    189
15a                                Rivière Froide                              Plaine de Léogane, CENTRE-SUD                 161
15b                                Momance                                     Plaine de Léogane, CENTRE-SUD                 437
16b                                Belle Anse                                  Sud-Est, SUD                                  726
16c                                Marigot                                     Sud-Est, SUD                                  300
17                                 Gde. Rivière de Jacmel                      G.de Rivière de Jacmel, SUD                   561
20                                 Cavaillon                                   Versant Sud, SUD-OUEST                        400
21                                 Les Cayes                                   Versant Sud, SUD-OUEST                        661
24                                 Grande Anse                                 Versant Nord, SUD-OUEST                       554
27                                 Gde. Rivière de Nippes                      Versant Nord, SUD-OUEST                       465
28b                                Petit Goave                                 Versant Nord, SUD-OUEST                       148

Haiti. The “priority” watersheds are shown in Fig. 4 and                          A description of the step-by-step method and the
their basin and sub-basin names and areas are shown in                       relevant GIS map layer used to prioritize the watersheds
Table 1.                                                                     with respect to flood potential is given below.
     The purpose of this study was to perform a
GIS-based analysis of watersheds in Haiti with the                               Determine the boundaries and the drainage area for
objective of identifying the most vulnerable watersheds                          the “priority” watersheds by creating WS1,
to flooding. We Soil erosion risk, potential of soil for                         WS2...WSi…
agriculture, population vulnerability, road infrastructure                       Use the Intersect command in ArcGIS to intersect
vulnerability, market infrastructure vulnerability, irrigation                   WSi & ER = WSER. Then determine the drainage area
infrastructure vulnerability and total infrastructure                            fraction, by category, of ER index (0-5). We then
vulnerability were assessed with respect to flooding risk.                       multiplied the drainage area fraction by the index
                                                                                 category to weight categories. We then summed the
                            METHODS                                              categories to compute a “watershed erosion risk”
                                                                                 score. We then normalized the scores and ranked the
     Digital coverages were purchased from various                               WSERs.
government agencies in Haiti for the following:                                  Use the Intersect command to intersect WSi & NFM
Watersheds, Erosion Risk (ER) as of 1998, Habitat Density                        = WSFMi . We then used Intersect for WSFM & HD
(HD) as of 1998, Road Network, Irrigation Perimeter (IP),                        = FMHD. We then determined the habitat density in
Market Locations (M), Potential Soil Quality (PS),                               the flood plain and multiplied HD by the flood plain
Productive Infrastructure Vulnerability (PI), 10 meter                           area and determined the vulnerable population. We
digital terrain model and Communal Section Population                            then ranked WS by the vulnerable population.
Vulnerability.                                                                   Use the Union command in ArcGIS to union R & NH
     We then re-projected the coverages into a common                            = ROAD NETWORK (RN). We then Intersected RN
projection and datum and translated the legend from                              & WS = RNWS. We determined road categories and
French to English.                                                               assign weights as proxies of “road replacement

                                                                       872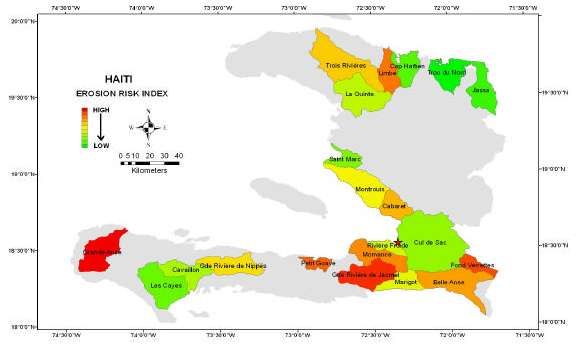
World Appl. Sci. J., 4 (6): 869-885, 2008

value” (5 = national highway, 4 = other paved road;                 The following indices were then generated:
3 = all-weather dirt road, 1= trail). We normalized the
values by multiplying the distance per category. We             Erosion Risk Index: based on the weighted score of the
summed the weighted values and computed the                     erosion risk, categories from the Erosion Risk were
“road vulnerability” for each watershed by                      mapped. The erosion risk categories are a function of
intersecting with WSFMi. We normalized scores and               slope, soil properties, vegetation cover and erosive
ranked “road vulnerability” scores.                             climate factors. The erosion risk score for each watershed
We used Intersect to intersect IP & WSFMi = FMIPi.              was calculated by summing the weighted risk categories,
We determined area as a fraction of total watershed             each category being weighted by multiplying its value
area in the flood zone as an “irrigation vulnerability”         (1-6) with its fractional area of the watershed. The
score. We normalized the scores and ranked the                  watersheds were ranked according to the risk index.
“irrigation vulnerability” scores.
We used Intersect to intersect M & WS = WSM. We                 Soil Potential Index: based on the weighted score of the
determined market categories and weights per                    soil potential categories from the Soil Potential map. The
category. We multiplied weights by number of                    categories are a function of slope, Lithology, salinity and
markets per category. We calculated “watershed                  drainage factors that determine their agronomic potential.
market values” by summing the category values. We               Each category was weighted by multiplying the category
normalized values and ranked the WSMs.                          value by its fractional area of the watershed. The SPI of
We used Intersect to intersect WSi & PS = WSPS.                 the priority and all watersheds were ranked.
We determined the drainage area fraction by
category of PS index (0-7). We multiplied the drainage          Population Vulnerability Index: vulnerability of the
area fraction by index category to weight the                   population was defined in this assessment as the portion
categories. We summed the categories to compute a               of the habitat density map that intersects the three
“watershed soil quality” score. We normalized the               categories of flood prone areas. It was based on the water
scores and ranked the WSPSs.                                    surface map created from aerial photos taken in 1982 and
We summed the scores of roads, markets and                      features three categories of plains susceptible to either a
irrigation for each watershed. We normalized values             storm surge, a general rise in water levels or floods: low
and ranked the watersheds by “Productive                        elevation plains near the coast, elevated plains and
Infrastructure Vulnerability Index”.                            alluvial plains. The intersection of the habitat density map
We prepared a hydro grid from the Cul-de-Sac DEM.               with the flood prone area map allows for an estimation of
We computed a weighted grid and flow direction. We              the population exposed to floods and the creation of a
generated a flow accumulation grid from flow                    population vulnerability index.
direction. We generated a link grid using stream and
flow accumulation grids. W generated a catchment                Habitat Density Index: habitat density was weighted
grid using a create link and flow direction grids. We           according to its density unit multiplied by the flood plain
generate a weighted flow accumulation grid using                value. The index values are normalized on a scale of 0-100
flow direction and weighted grids. We integrated the            to determine a relative index. The watersheds are ranked
catchment and weighted flow accumulation grids to               by their index values and summarized in a table. A
produce a flood risk zone map. We used Overlay for              national map of Haiti was generated to show the spatial
the Grise Rive, road network, urban zones and other             distribution of index values.
layers to graphically display vulnerability of
population and infrastructure to flood zone category.           Productive Infrastructure Vulnerability Index: The
We mapped Cul-de-Sac population vulnerability at                productive infrastructure was defined as the total of
level communal section based on weighted values of              roads, markets and irrigation networks. No data was
habitat density x flood prone area union. We                    available, on a national scale, for public buildings (e.g.,
assigned a color ramp to show population                        schools, administrative, churches and shelters), utilities
vulnerability to flooding.                                      or other types of infrastructure considered key to the

                                                          873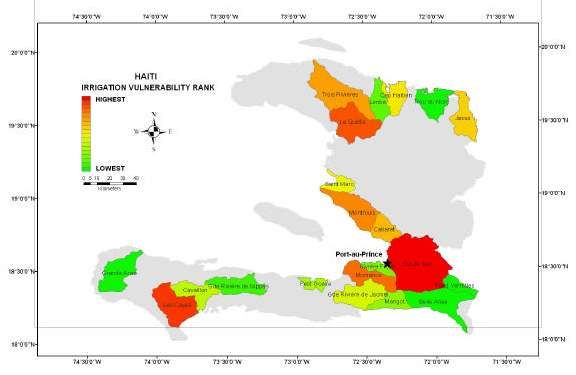
World Appl. Sci. J., 4 (6): 869-885, 2008

economy. The portion of the infrastructure falling within                     calculated using hydrological functions based on slope
the flood prone area of the watershed was the basis of the                    and elevation. The union of this grid with the catchment
productive infrastructure vulnerability index. A separate                     grid generates a flood risk zone map. Layers are added to
vulnerability index was determined for roads, markets and                     graphically show the population and infrastructure
irrigation networks based on the weighted score of roads                      vulnerable to different levels of flood risk.
( road distance x road category x flood area category),
markets ( market number x market category x flood area                        Communal Section Population Vulnerability: The
category) and irrigated land ( irrigation category x flood                    intersection of the communal section layer with the
area category). A map showing the selected watersheds                         population vulnerability layer of the Cul-de-Sac watershed
was based on a relative scale from 0-100.                                     creates a map showing how population vulnerability
                                                                              varies according to political jurisdiction.
Digital Elevation Model: The digital elevation model of
the Cul-de-Sac watershed was selected to create a flood                                               RESULTS
zone map using the ESRI Hydro model. This watershed
comprises the highly vulnerable urban population                              Erosion Risk Index: Erosion risk index values were
currently residing in the coastal flood plain of the Grise                    computed for twenty-one priority watersheds (Table 2)
River. A weighted flow accumulation grid was                                  and all watersheds (Table 3). A map of the priority

Table 2: Ranking of Erosion Risk Ranking of High Priority Watersheds
Rank                   Watershed                                Index                    Rank                  Watershed          Index
1                      Grande Anse                               100                      11                   Montrouis           69
2                      Gde. Rivière de Jacmel                     84                      12                   Marigot             69
3                      Fond Verrettes                             83                      13                   Rivière Froide      61
4                      Petit Goave                                81                      14                   La Quinte           55
5                      Limbé                                      78                      15                   Cavaillon           52
6                      Momance                                    77                      16                   Cul de Sac          52
7                      Belle Anse                                 74                      17                   Saint Marc          52
8                      Cabaret                                    72                      18                   Les Cayes           35
9                      Trois Rivières                             70                      19                   Cap Haïtien         29
10                     Gde Rivière de Nippes                      70                      20                   Jassa               10
                                                                                          21                   Trou du Nord         0

Table 3: Ranking of Erosion Risk Index of all Watersheds
Rank          Watershed                           Index                       Rank               Watershed                       Index
1             Grande Anse                          100                         28                Aquin/St. Louis du Sud          57
2             Voldrogue/Roseaux                     94                         29                La Quinte                       55
3             Tiburon/Port Salut                    89                         30                Baie de Henne                   54
4             Les Irois/Jérémie                     86                         31                Lociane                          54
5             Rivière de Jacmel                     84                         32                Cavaillon                       52
6             Fond Verrettes                        83                         33                Thomonde                         52
7             Petit Goave                           81                         34                Cul de Sac                       52
8             Limbé                                 78                         35                Moustique                        52
9             Grand Goave                           78                         36                Saint Marc                       52
10            Fer à Cheval                          77                         37                Corail/Anse à Veau               51
11            Momance                               77                         38                Peligre Sud                      50
12            Cours Moyen                           76                         39                Gatinette                        48
13            Belle Anse                            74                         40                Libon                            48
14            Cabaret                               72                         41                Colombier                        46
15            Bainet                                71                         42                Môle Saint Nicolas               44
16            Trois Rivières                        70                         43                Bouyaha                          42
17            Gde Rivière de Nippes                 70                         44                La Gonave                       41
18            Montrouis                             69                         45                Canot                            41
19            Anse à Pitre                          69                         46                Anse Rouge                       39
20            Jean Rabel                            69                         47                Les Cayes                        35
21            Marigot                               69                         48                Cap Haïtien                      29
22            La Tortue                             64                         49                L’Estère                         27
23            Port de Paix/Port Margot              63                         50                Guayamouc Aval                  26
24            Rivière Froide                        61                         51                Cours Inférieur                  14
25            Côtes de Fer                          60                         52                Marion                           11
26            Miragoane                             59                         53                Jassa                            10
27            Gde Rivière du Nord                   57                         54                Trou du Nord                      0

                                                                        874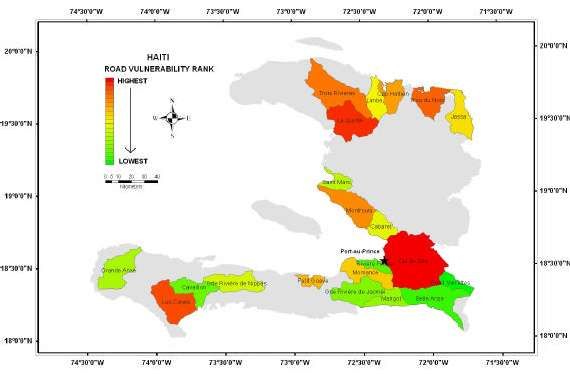
World Appl. Sci. J., 4 (6): 869-885, 2008

Table 4: Ranking of Soil Potential Index of Priority Watersheds
Rank          Watershed                             Index                    Rank                Watershed                       Index
1             Trou du Nord                           100                      11                 Marigot                         27
2             Cap Haïtien                             78                      12                 Cabaret                          26
3             Jassa                                   66                      13                 Trois Rivières                   26
4             Les Cayes                               60                      14                 Belle Anse                       25
5             La Quinte                               40                      15                 Bassin du Limbé                  22
6             Gde Rivière de Nippes                   38                      16                 Momance                         20
7             Cavaillon                               36                      17                 Montrouis                        20
8             Saint Marc                              32                      18                 Rivière Froide                   15
9             Cul de Sac                              32                      19                 Gde Rivière de Jacmel            10
10            Petit Goave                             29                      20                 Grande Anse                       4
                                                                              21                 Fond Verrettes                    0

Table 5: Ranking of Soil Potential Index of all Watersheds
Rank          Watershed                            Index                     Rank                Watershed                       Index
1             Trou du Nord                          100                       28                 Cul de Sac                       32
2             Cap Haïtien                            78                       29                 Baie de Henne                    32
3             Jassa                                  66                       30                 Gde Rivière du Nord              31
4             Anse Rouge                             61                       31                 Petit Goave                      29
5             Les Cayes                              60                       32                 Marigot                          27
6             Marion                                 58                       33                 Cabaret                          26
7             La Gonave                              56                       34                 Trois Rivières                   26
8             Môle Saint Nicolas                     55                       35                 Les Irois/Jérémie               25
9             La Tortue                              54                       36                 Belle Anse                       25
10            Gatinette                              52                       37                 Libon                            23
11            Colombier                              50                       38                 Bassin du Limbé                 22
12            Canot                                  49                       39                 Tiburon/Port Salut              21
13            Bouyaha                                46                       40                 Peligre Sud                      21
14            Anse à Pitre                           46                       41                 Grand Goave                      21
15            Guayamouc Aval                         46                       42                 Momance                         20
16            Aquin/St. Louis du Sud                 44                       43                 Montrouis                       20
17            Côtes de Fer                           44                       44                 Fer à Cheval                     17
18            Cours Inférieur                        42                       45                 Thomonde                         15
19            La Quinte                              41                       46                 Rivière Froide                   15
20            Miragoane                              40                       47                 Bainet                           13
21            Gde Rivière de Nippes                  38                       48                 Port de Paix/Port Margot        12
22            Cavaillon                              36                       49                 Gde Rivière de Jacmel            10
23            Corail/Anse à Veau                     35                       50                 Lociane                          10
24            Cours Moyen                            35                       51                 Grande Anse                       4
25            Jean Rabel                             35                       52                 Voldrogue/Roseaux                 1
26            Saint Marc                             32                       53                 Fond Verrettes                    0
27            Moustique                              32                      541

watersheds is shown in Fig. 5. Note that the Fond                            the erosion risk index ranking (Table 4). The correlation
Verrettes watershed is shared with theDominican                              between the two indices is highly significant, as indicated
Republic. The indices for this watershed was based on                        by the Spearman R statistic of-0.922. This is what would
only the upper part that lies entirely within Haiti and thus                 be expected given that the slope is the overriding factor
reflects a bias that should be interpreted with caution.                     and correlated with other factors considered in the
     The remainder of the watersheds are “ridge to reef”                     agronomic potential of soil such as Lithology, Erodibility,
systems. Their indices reflect the geomorphology of the                      drainage and salinity.
watershed which is characterized by large alluvial plains                         The map shown in Fig. 6 illustrates the soil potential
and low mountains and so have a lower index than the                         index of the priority watersheds. The top three watersheds
watersheds with high mountains and little or no coastal                      are located in the north of the country (Trou Nord, Jassa,
plain. The watersheds of the southern peninsula are                          Cap Haïtien) and the lowest ranked watersheds occur
particularly vulnerable due to their high mountain ranges                    along the southern peninsula of the Massif de la Hotter
and the higher probability of extreme storm events. Thus,                    and Massif de la Selle. Table 5 summarizes the index
the higher index values of the southern watersheds are                       rankings for fifty-three watersheds.
even more remarkable given the additional climate risks.
                                                                             Population Vulnerability Index: The index values of the
Soil Potential Index: The ranking of the watersheds, in                      priority watersheds are ranked in Table 6. The index
terms of their soil potential index, is simply the inverse of                rankings for all watersheds are summarized in Table 7. The

                                                                       875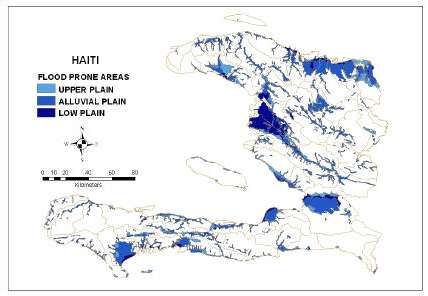
World Appl. Sci. J., 4 (6): 869-885, 2008

Fig. 5: Erosion risk

Fig. 6: Soil potential

                                           876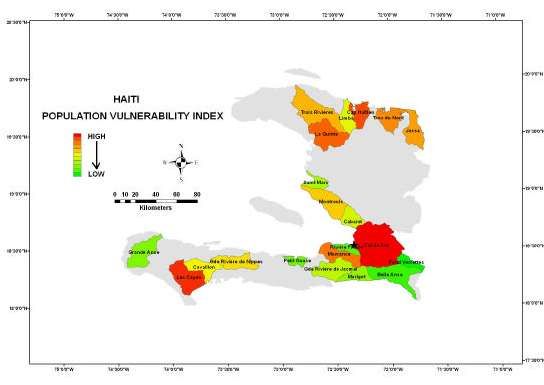
World Appl. Sci. J., 4 (6): 869-885, 2008

Table 6: Ranking of Population Vulnerability Index of Priority Watersheds
Rank                   Watershed                        Index                       Rank               Watershed                    Index
1                      Cul de Sac                       100                          11                Gde Rivière de Nippes          5
2                      Les Cayes                         30                          12                Cavaillon                      5
3                      Momance                           23                          13                Limbé                          4
4                      Cap Haïtien                       20                          14                Rivière Froide                 3
5                      La Quinte                         18                          15                Gde Rivière de Jacmel          2
6                      Montrouis                         13                          16                Saint Marc                     2
7                      Trois Rivières                      9                         17                Marigot                        2
8                      Jassa                               9                         18                Grande Anse                    2
9                      Trou du Nord                        9                         19                Petit Goave                    1
10                     Cabaret                             5                         20                Belle Anse                     0
                                                                                     21                Fond Verrettes                 0

Table 7: Ranking of Population Vulnerability Index of all Watersheds
Rank                   Watershed                        Index                       Rank               Watershed                    Index
1                      Cul de Sac                       100                          28                Tiburon-Port Salut             3
2                      Cours Inférieur                   38                          29                Gde Rivière de Jacmel          2
3                      Les Cayes                         30                          30                Guayamouc Aval                 2
4                      Momance                           23                          31                Miragoane                      2
5                      Cap Haïtien                       20                          32                Saint Marc                     2
6                      La Quinte                         18                          33                Colombier                      2
7                      Montrouis                         13                          34                Marigot                        2
8                      Aquin/St. Louis du Sud            10                          35                Les Irois-Jérémie              2
9                      Trois Rivières                      9                         36                Grande Anse                    2
10                     Jassa                               9                         37                Fer á Cheval                   1
11                     Trou du Nord                        9                         38                Petit Goave                    1
12                     Gde Rivière du Nord                 9                         39                Jean Rabel                     1
13                     Cours Moyen                         8                         40                Bainet                         1
14                     Port de Paix/Port Margot            7                         41                Voldrogue Roseaux              1
15                     Bouyaha                             6                         42                Peligre Sud                    1
16                     Cabaret                             5                         43                La Gonave                      1
17                     Gde Rivière de Nippes               5                         44                Moustique                      1
18                     Cavaillon                           5                         45                Lociane                        0
19                     Canot                               4                         46                Thomonde                       0
20                     Limbé                               4                         47                Libon                          0
21                     Anse Rouge                          3                         48                Anse á Pitre                   0
22                     Côtes de Fer                        3                         49                Belle Anse                     0
23                     Grand Goave                         3                         50                Baie de Henne                  0
24                     Corail-Anse à Veau                  3                         51                Môle Saint Nicolas             0
25                     Marion                              3                         52                La Tortue                      0
26                     Rivière Froide                      3                         53                Fond Verrettes                 0
27                     Gatinette                           3                        541

watersheds representing the largest metropolitan areas of                         residing in much smaller coastal plains. This is not to say
Haiti generated the highest index values. The combination                         that populations with relatively low index values are not
of high population densities residing in large areas of high                      vulnerable to deadly floods (e.g., Fond Verrettes in May
flood potential (e.g., low coastal plains) results in the                         2004; St. Marc in August 2003 and Rivière Froide in
highest indices. At the other extreme, the lowest indices                         October 2005). However, the potential for a large-scale
were characterized by relatively low population densities                         disaster is not as great. The index map is shown in Fig. 7.

                                                                            877
World Appl. Sci. J., 4 (6): 869-885, 2008

Fig. 7: Population vulnerability

Fig. 8: Road vulnerability

                                                     878
World Appl. Sci. J., 4 (6): 869-885, 2008
Table 8: Ranking of Road Vulnerability Index of Priority Watersheds
Rank Watershed Index Rank Watershed Index
1 Cul de Sac 100 11 Limbé 27
2 La Quinte 100 12 Cabaret 19
3 Les Cayes 90 13 Gde Rivière de Nippes 18
4 Trou du Nord 62 14 Saint Marc 17
5 Trois Rivières 55 15 Grande Anse 14
6 Montrouis 51 16 Marigot 13
7 Cap Haïtien 45 17 Gde Rivière de Jacmel 11
8 Petit Goave 29 18 Cavaillon 9
9 Momance 29 19 Rivière Froide 6
10 Jassa 27 20 Belle Anse 1
21 Fond Verrettes 0
Table 9: Ranking of Road Vulnerability Index of all Watersheds
Rank Watershed Index Rank Watershed Index
1 Cul de Sac 100 28 Corail/Anse à Veau 16
2 La Quinte 100 29 Grand Goave 15
3 Les Cayes 90 30 Fer à Cheval 15
4 Aquin/St. Louis du Sud 80 31 Grande Anse 14
5 Cours Inférieur 69 32 Marigot 13
6 Trou du Nord 62 33 Gde Rivière de Jacmel 11
7 Bouyaha 57 34 Guayamouc 11
8 Trois Rivières 55 35 Les Irois/Jérémie 11
9 Montrouis 51 36 Anse Rouge 10
10 Gde Riv. du Nord 50 37 Cavaillon 9
11 Cap Haïtien 45 38 Jean Rabel 6
12 Miragoane 36 39 Rivière Froide 6
13 Cours Moyen 31 40 Peligre Sud 4
14 Petit Goave 29 41 Anse à Pitre 4
15 Momance 29 42 Thomonde 3
16 Tiburon-Port Salut 29 43 Gatinette 2
17 Jassa 27 44 Bainet 2
18 Limbé 27 45 La Gonave 2
19 Côtes de Fer 23 46 Moustique 2
20 Port de Paix/Port Margot 23 47 Baie de Henne 2
21 Marion 23 48 Belle Anse 1
22 Cabaret 19 49 Lociane 1
23 Voldrogue Roseaux 19 50 Môle Saint Nicolas 1
24 Gde Riv. de Nippes 18 51 Libon 1
25 Colombier 18 52 La Tortue 0
26 Saint Marc 17 53 Fond Verrettes 0
27 Canot 17 541
Infrastructure Vulnerability Indices: Road Vulnerability for the priority watersheds and Table 9 compares the
Index: The length of roads, weighted according to index values for all watersheds. The index map for the
estimated life cycle costs and their location within the priority watersheds is shown in Fig. 8.
flood prone areas, determined the road vulnerability index.
The road vulnerability indices are based on relative values Market Vulnerability Index: The market vulnerability
(scaled from 0-100). Table 8 summarizes the index values index is based on the weighted value of markets (rural,
879World Appl. Sci. J., 4 (6): 869-885, 2008
Fig. 9: Market Vulnerability Index
Fig. 10: Irrigation Vulnerability Index
880World Appl. Sci. J., 4 (6): 869-885, 2008
Table 10: Ranking of Market Vulnerability Indices of Selected Watersheds
Rank Watershed Index Rank Watershed Index
1 Les Cayes 100 9 Montrouis 17
2 La Quinte 83 10 Saint Marc 9
3 Gde Rivière de Jacmel 45 11 Marigot 6
4 Cap Haïtien 43 12 Petit Goave 4
5 Cul de Sac 34 12 Trois Rivières 4
6 Trou du Nord 26 13 Belle Anse 2
6 Jassa 26 14 Cabaret 0
7 Momance 23 14 Fond Verrettes 0
7 Gde RiviÖre de Nippes 23 14 Rivière Froide 0
8 Limbé 21 14 Cavaillon 0
14 Grande Anse 0
Table 11: Ranking of Market Vulnerability Indices of all Watersheds
Rank Watershed Index Rank Watershed Index
1 Les Cayes 100 16 Jean Rabel 4
2 La Quinte 83 16 Guayamouc 4
3 Gde Rivière de Jacmel 45 16 Canot 4
4 Cap Haïtien 43 16 Lociane 4
5 Cul de Sac 34 16 Petit Goave 4
6 Cours Inférieur 30 16 Trois Rivières 4
7 Port de Paix/Port Margot 28 16 Côtes de Fer 4
8 Trou du Nord 26 16 Voldrogue Roseaux 4
8 Jassa 26 16 Grand Goave 4
8 Tiburon-Port Salut 26 16 Baie de Henne 4
9 Momance 23 17 Gatinette 2
9 Gde Rivière de Nippes 23 17 Belle Anse 2
9 Corail/Anse à Veau 23 18 Cabaret 0
10 Limbé 21 18 Anse Rouge 0
11 Marion 19 18 Môle Saint Nicolas 0
11 Cours Moyen 19 18 Thomonde 0
11 Aquin/St. Louis du Sud 19 18 Fond Verrettes 0
12 Montrouis 17 18 Rivière Froide 0
13 Peligre Sud 13 18 Cavaillon 0
13 Fer à Cheval 13 18 Grande Anse 0
13 Gde Riv. du Nord 13 18 La Tortue 0
13 Bouyaha 13 18 Moustique 0
14 Colombier 9 18 Libon 0
14 Saint Marc 9 18 Anse à Pitre 0
15 Marigot 6 18 Bainet 0
15 Miragoane 6 18 Les Irois/Jérémie 0
15 La Gonave 6 1
regional or urban) falling within flood prone areas. The noted for the absence of irrigation networks, as shown in
indices of the priority watersheds are shown in Table 10 Fig. 1. However, it is likely that many local irrigation
and those for all watersheds are shown in Table 11. The networks exist that are not shown.
index map for the priority watersheds is shown in The index values for the priority watersheds are
Fig. 9. shown in Table 12 and those for all watersheds are shown
in Table 13. The highest index value in Table 10 is not the
Irrigation Vulnerability Index: The largest irrigation highest in the country. This belonged to the large
networks in Haiti are located in the alluvial plains of the irrigation network along the lower Artibonite River.
Artibonite, the lower La Quinte River, the Cul-de-Sac, However, the top five indices in Table 8a are ranked
Leogane, Arcahaie and Cayes. Smaller networks occur second to sixth when compared to all the watersheds in
throughout the country along the major rivers of the Haiti. The index map for the priority watersheds is shown
country. Several watersheds selected in this study are in Fig. 10.
881World Appl. Sci. J., 4 (6): 869-885, 2008
Table 12: Ranking of Irrigation Vulnerability Index of Priority Watersheds
Rank Watershed Index Rank Watershed Index
1 Cul de Sac 71 11 Gde Rivière de Jacmel 3
2 Les Cayes 32 12 Cavaillon 3
3 La Quinte 30 13 Petit Goave 3
4 Momance 16 14 Marigot 2
5 Montrouis 16 15 Rivière Froide 1
6 Trois Rivières 9 16 Bassin du Limbé 1
7 Cabaret 8 17 Gde RiviÖre de Nippes 0
8 Jassa 7 18 Fond Verrettes 0
9 Cap Haïtien 4 18 Grande Anse 0
10 Saint Marc 3 18 Trou du Nord 0
18 Belle Anse 0
Table 13: Ranking of Irrigation Vulnerability Index of all Watersheds
Rank Watershed Index Rank Watershed Index
1 Cours Inférieur 100 28 Côtes de Fer 1
2 Cul de Sac 71 29 Marion 1
3 Les Cayes 32 30 Rivière Froide 1
4 La Quinte 30 31 Bassin du Limbé 1
5 Momance 16 32 Corail/Anse à Veau 1
6 Montrouis 16 33 Miragoane 1
7 Cours Moyen 13 34 Colombier 1
8 Canot 10 35 Peligre Sud 1
9 Fer à Cheval 9 36 Thomonde 1
10 Trois Rivières 9 37 Port de Paix/Port Margot 1
11 Cabaret 8 38 Aquin/St. Louis du Sud 1
12 Bouyaha 8 39 Môle Saint Nicolas 1
13 Gde Riv. du Nord 7 40 Baie de Henne 0
14 Jassa 7 41 Bainet 0
15 Lociane 4 42 Gde Rivière de Nippes 0
16 Cap Haïtien 4 43 Fond Verrettes 0
17 Saint Marc 3 43 Grande Anse 0
18 Guayamouc 3 43 Trou du Nord 0
19 Gde Rivière de Jacmel 3 43 Belle Anse 0
20 Cavaillon 3 43 Gatinette 0
21 Petit Goave 3 43 La Gonave 0
22 Tiburon-Port Salut 2 43 La Tortue 0
23 Marigot 2 43 Voldrogue/Roseaux 0
24 Anse Rouge 2 43 Libon 0
25 Moustique 2 43 Anse à Pitre 0
26 Jean Rabel 2 43 Les Irois/Jérémie 0
27 Grand Goave 2
Infrastructure Vulnerability Index: The infrastructure densely populated urban area, Port-au-Prince, ranks third
vulnerability index of the priority watersheds, as reflected behind Les Cayes and La Quinte (Gonaives), primarily
in the average vulnerability index of roads, markets and due to the differences in the market vulnerability
irrigation systems is shown in Table 14. The weakness of index. These watersheds also rank the highest in Table 15.
such an index is that the three categories of infrastructure The index map of the priority watersheds is provided in
are weighted equally. Thus, the watershed of the most Fig. 11.
882World Appl. Sci. J., 4 (6): 869-885, 2008
Table 14: Ranking of Productive Infrastructure Vulnerability Index of Priority Watersheds
Rank Watershed Index Rank Watershed Index
1 Les Cayes 73.9 11 Bassin du Limbé 16.5
2 La Quinte 70.9 12 Gde RiviÖre de Nippes 13.7
3 Cul de Sac 68.2 13 Petit Goave 12.1
4 Cap Haïtien 30.6 14 Saint Marc 9.6
5 Trou du Nord 29.3 15 Cabaret 8.8
6 Montrouis 28.0 16 Marigot 7.0
7 Momance 22.9 17 Grande Anse 4.8
8 Trois Rivières 22.8 18 Cavaillon 3.9
9 Jassa 19.9 19 Rivière Froide 2.3
10 Gde Rivière de Jacmel 19.6 20 Belle Anse 1.1
21 Fond Verrettes 0.0
Table 15: Ranking of Total Infrastructure Vulnerability Index of all Watersheds
Rank Watershed Index Rank Watershed Index
1 Les Cayes 73.9 28 Colombier 9.0
2 La Quinte 70.9 29 Cabaret 8.8
3 Cul de Sac 68.2 30 Voldrogue Roseaux 7.6
4 Cours Inférieur 66.4 31 Grand Goave 7.0
5 Aquin/St. Louis du Sud 33.3 32 Marigot 7.0
6 Cap Haïtien 30.6 33 Guayamouc Aval 6.1
7 Trou du Nord 29.2 34 Peligre Sud 5.8
8 Montrouis 28.0 35 Grande Anse 4.8
9 Bouyaha 25.8 36 Jean Rabel 4.0
10 Gde Rivière du Nord 23.5 37 Cavaillon 3.9
11 Momance 22.9 38 Anse Rouge 3.9
12 Trois Rivières 22.8 39 Les Irois-Jérémie 3.5
13 Cours Moyen 20.9 40 Lociane 3.2
14 Jassa 19.9 41 La Gonave 2.8
15 Gde Rivière de Jacmel 19.6 42 Rivière Froide 2.3
16 Tiburon-Port Salut 18.9 43 Baie de Henne 2.1
17 Port de Paix/Port Margot 17.1 44 Gatinette 1.5
18 Limbé 16.5 45 Moustique 1.3
19 Miragoane 14.4 46 Thomonde 1.2
20 Marion 14.4 47 Anse à Pitre 1.2
21 Gde Rivière de Nippes 13.7 48 Belle Anse 1.1
22 Corail-Anse à Veau 13.6 49 Bainet 1.0
23 Fer à Cheval 12.2 50 Môle Saint Nicolas 0.0
24 Petit Goave 12.1 51 Libon 0.3
25 Canot 10.2 52 La Tortue 0.0
26 Côtes de Fer 9.6 53 Fond Verrettes 0.0
27 Saint Marc 9.6 54 1
River Grise 3-D Flood Zone Map: Figure 12 is a 3D map, include Croix des Missions, Cité Soleil and the Industrial
showing the most likely high flood risk zones of the Grise Park.
River watershed. The results of the ArcGIS Hydro model
clearly show the vulnerability of areas within metropolitan Communal Section Vulnerability: Figure 13 shows
Port-au-Prince due to the high density of an urban population vulnerability within the Cul-de-Sac watershed
population residing on a coastal flood plain. These areas as delimited by communal section. Vulnerability is
883World Appl. Sci. J., 4 (6): 869-885, 2008
Fig. 11: Infrastructure Vulnerability Index
Fig. 12: Flood Risk Zones in the River Grise Catchment Area of the Cul-de-Sac Watershed
Fig. 13: Population Vulnerability of the Cul-de-Sac Watershed Showing Index Values by Communal Section
Jurisdictions
884World Appl. Sci. J., 4 (6): 869-885, 2008
concentrated among the most densely populated urban ACKNOWLEDGMENTS
areas of the Grise River flood plain. The population
residing in the upper catchment of the Grise River is not This project was supported by the United States
considered vulnerable due to the absence of flood prone Agency for International Development
areas.
Project: Environmental Vulnerability in Haiti. The work of
CONCLUSIONS Mr. Joel Timyan, Dr. Michael Bannister and Glenn
Smucker was invaluable to this research
When assessing an area for flood risk, many
variables must to take into account. In this study we REFERENCES
looked at population, the potential the soil was to erosion
potential, the utility of soil for agriculture, transportation 1. Farmer, Paul. The Uses of Haiti. Monroe, Maine:
network, shopping market locations, irrigation Common Courage Press 2003. ISBN 1-56751-242-9
infrastructure and total infrastructure. Depending on the 2. Diamond, Jared. 2005. Collapse: How Societies
weight applied to these variables (i.e., is it more important Choose to Fail or Succeed New York: Viking.
to protect roads from flood rather than voluble soil), ISBN 0-670-03337-5.
decision makers can use this tool to know were to build 3. Debs Heinl, Robert and Nancy Gordon Heinl. Written
flood control devices such as dams and levees. in Blood: The Story of the Haitian People 1492-1995.
Once databases such as the one developed here are Lanham, MD: University Press of America, 1996.
built, decision makers with limited or even no experience ISBN 0761831770
with GIS can use them for wise resource management. In 4. Deibert, Michael. Notes from the Last Testament:
the case if Haiti, the results from this study indicates that The Struggle for Haiti. Seven Stories Press, New
there are areas with high population and large York, 2005. ISBN-10: 1583226974.
infrastructure investment that are more flood-prone those 5. Smucker, Glenn, T. Anderson White and Michael
others. Likewise, there are areas that are not in emanate Bannister. Land Tenure and the Adoption of
need of flood protection either because there is nothing Agricultural Technology in Haiti. CAPRi Working
voluble to protect or they are not prone to flooding. Paper No, 6, 2006.
885You can also read