THE SIG DIGEST - Singapore University of Social Sciences
←
→
Page content transcription
If your browser does not render page correctly, please read the page content below
SUSS INVESTMENT GROUP | SEPTEMBER 2020 | ISSUE #1

THE SIG DIGEST
              FOREWORD                                              GREEN FINANCE
                  By Dr Tan Eng Joo, Senior Lecturer,
                  Singapore University of Social Sciences
                  Faculty Advisor, SUSS Investment
                  Group

 Bittersweet; deafening silence; open secret; humane
 slaughter.

 Is “green finance” also an oxymoron? After all, the term
 “finance” often evokes an image of the callous,
 calculating banker, a jarring contrast to the passionate,
 empathetic environmentalist associated with the term
 “green”. Indeed, protecting the environment, a global
 public good, is a costly activity that seems to be at odds
 with value maximization for an individual business.           Green finance is defined as the use of financial products to
                                                               achieve both financial returns and sustainable outcomes. The
 Yet, firms are becoming cognizant that environmental          term has exploded in popularity in recent years. From “green
 sustainability is increasingly intertwined with business      bonds” that finance climate and environmental projects to the
 sustainability. For some, it will be an existential concern   stocks of socially responsible companies to Environmental,
 in the near future. An unsustainable business cannot          Social and Governance (ESG) Exchange Traded Funds, the
 continue to create value. As policymakers realize that        number of avenues available for green investors has
 finance is a powerful force that can be leveraged in          skyrocketed, with the trend showing no signs of slowing.
 fighting climate change and put money where the mouth
 is, businesses will better appreciate the alignment between   Traditional energy companies are facing mounting pressure to
 environmental sustainability and value maximization.          transition away from fossil fuel production amidst investor
                                                               activism and rising competition from renewable energy
 Rare is the breed of students who care about                  companies. Some companies such as Shell and BP have
 environmental sustainability. Even rarer is the breed of      proactively made concrete steps toward a greener future, while
 finance students who do. As a step in this direction, the     others such as ExxonMobil and Chevron have lagged behind.
 SUSS Investment Group (SIG) has chosen to dedicate the        In this inaugural issue of the SIG Digest, we explore what the
 inaugural issue of its newsletter to covering companies       future holds for green finance.
 that are making an environmental impact.
                                                               In our Equity Research column, we analyse Bonheur ASA, a
 The SIG was formed in 2017 by a few passionate                Norway-based holding company specialising in the marine and
 individuals and has grown to a 21-strong group. The           renewable energy sector. We examine past and upcoming
 group has assisted in organizing the My Money @               events that influence Bonheur’s profitability and market
 Campus talk and the CFA Research Challenge internal           valuation.
 selection. Its members have represented the university for
 the CFA Ethics Challenge, CFA Research Challenge,              In our Global Macro Research column, we discuss renewable
 Eurasia Asset Management Challenge, GIC Stock Pitch           energy trends and the prospects of green investing. We also
 Challenge, and the McGill International Portfolio             explore a case study of the transition of a traditional Oil & Gas
 Challenge.                                                    company, British Petroleum, towards clean energy.
                                                               Disclaimer: Information in this newsletter is for educational purposes only
 This newsletter is the SIG’s latest initiative. I hope you    and do not constitute investment advice.
 will enjoy reading it and look forward to more exciting
                                                                                                                                     Editor
 initiatives from the group.                                                                                                 Chia Rui Yang
                                                               For enquiries on collaboration or partnership         VP (External Relations)
                                                               opportunities, please contact sussinvest@gmail.com.   rychia001@suss.edu.sg

                                                                                                                                 Page | 1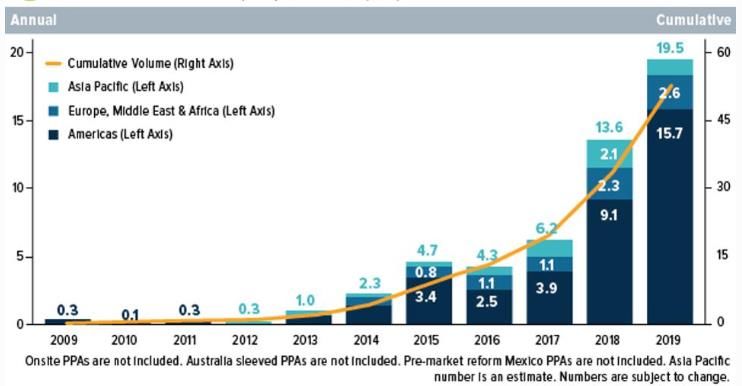
SUSS INVESTMENT GROUP | SEPTEMBER 2020 | ISSUE #1                                                                  Equity Research

                                Bonheur ASA (OB: BON) | Industry: Industrial Conglomerates

 A rising star in global energy transformation: SIG initiates coverage with a Buy      Basic Information
 recommendation on Bonheur ASA, with a target price of NOK 287.89,                     Recommendation                     BUY
 representing an upside of 26.0%.                                                      Current Price                 NOK 228.00
                                                                                       12 Mth Target Price           NOK 287.89
 Business Summary                                                                      Upside                            26.0%
 Headquartered in Oslo, Bonheur ASA is listed on the Oslo Stock Exchange and
                                                                                       1 Year Price vs OSLO OBX (Rebased)
 has long-term investments in three main industries – shipping, energy, and leisure.
 The group’s key business activities, wind energy generation, wind turbine             1.40
 installations, and cruise are carried out by Fred. Olsen Renewables (FORAS),
 Fred. Olsen Ocean (FOO), and First Olsen Holding AS. Bonheur’s wind energy            1.20
 business has entered its growth stage with new technology and business                1.00
 opportunities in North America and Asia. With a premium branding, FOCL is
 approaching maturity. In 1Q20, the group’s four business segments generated           0.80
 NOK 492 million in revenue. Offshore wind installation contributed the most to        0.60
 the group’s revenue (32%), followed by Renewable energy (29%), Cruise line                   Volume               Bonheur ASA
 (25%), and other investments (14%).                                                          OSLO OBX
                                                                                                       Source: Yahoo Finance, Team
 Highlights of the year:
                                                                                       Key Financials
 FOWIC clinched another Taiwanese offshore wind project in March 2020.
 The group is commissioned to transport and install wind turbines for the 600MW        Market Cap (NOK, mm)                9612.2
                                                                                       Shares Out. (mm)                       42.5
 Changfang and Xidao offshore wind complex.
                                                                                       Avg 3M Daily Vlm                       0.07
 Dividend payout in 2019 increased from NOK 2 per share to NOK 4 per                   Float %                              46.7%
 share, a 100% jump. For several years, Bonheur ASA’s annual dividend has              Enterprise Value                  14,137.6
 remained stagnant at NOK 2 per share. A NOK 4 per share dividend payout last          P/E Ratio                          -
 year reflects outstanding management, while the declared forward dividend of          Dividend Yield %                      1.9%
                                                                                       52 Wk High/Low                    232/134
 NOK 4.30 per share is a sign of the group’s confidence for growth.

 Our take on Bonheur:                                                                  Major Shareholders
 Bonheur can anticipate revenue growth alongside the burgeoning renewable              INVENTO AS                         28.99%
                                                                                       QUANTRO A/S                        20.54%
 energy sector. According to our research, renewable energy generation and
                                                                                       FOLKETRYGDFONDET                    4.31%
 consumption is looking positive in regions that renewable energy and offshore
                                                                                       Other shareholders                 46.16%
 wind installations have set foot in – Europe, North America and Asia. We see that
 the renewable energy industry has a very positive outlook with renewable energy
                                                                                                        Full report: bit.ly/34aF3ek
 generation forecasted to double in the current decade.

 Strong customer loyalty and innovative programs can bring further growth to                                             Analysts
 the Cruise Business. Cruise line remains competitive with its longstanding
                                                                                                         Cassandra Tan Tung Yan
 customer loyalty. The cruise line found opportunities amidst COVID-19 with its
                                                                                                    cassandratan003@suss.edu.sg
 innovative virtual cruising programs that makes its name unforgettable.
                                                                                                          Charlton Koh Yong En
 Valuation. We derived a 12M target price of NOK 289.89 through blended DCF
                                                                                                    VP (Global Macro Research)
 valuation and SotP relative valuation.
                                                                                                    charltonkoh001@suss.edu.sg
 Financial Valuation and Key Metrics:
                                                                                                            Daniel Nyau Zhi Mo
       Year          FY19A      FY20E     FY21E      FY22E      FY23E      FY24E                          President; VP (Equity)
                                                                                                     danielnyau001@suss.edu.sg
   Revenue (mm)       7,834.7   6,314.7    8,921.7    9,822.1   10,866.1   12,027.5
   Rev. Growth         15.5%    -19.4%      41.3%      10.1%     10.6%      10.7%
   Net income (mm)    (343.1)   (40,.4)    (319.8)    (315.9)    (11.7)      19.4                           Dione Goh Wen Hui
   ROA (%)           -174.7%    -20.6%    -162.8%    -160.8%     -6.0%      9.9%                       dionegoh001@suss.edu.sg
   ROE (%)             -2.9%     -0.3%      -2.8%      -2.9%     -0.1%      0.2%
   EV/EBITDA           11.8x     11.1x       4.2x       4.6x      3.8x       3.4x
   EV/REVENUE           1.6x      2.3x       0.6x       0.7x      0.7x       0.6x                               Song Bing Heng
   Dividend Yield      12.6%     11.8%      12.7%      13.7%     14.7%      15.8%
                                                                                                         bhsong001@suss.edu.sg

                                                                                                                           Page | 2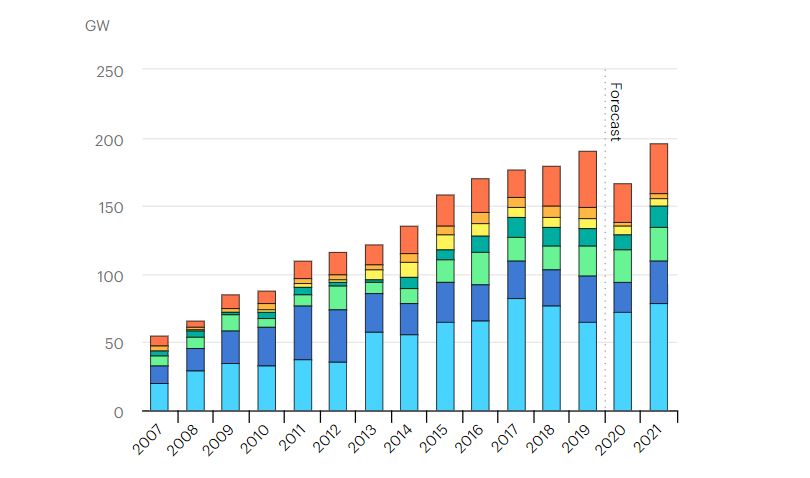
SUSS INVESTMENT GROUP | SEPTEMBER 2020 | ISSUE #1                                                              Global Macro Research

                                             Market Outlook: The Green Recovery

 Summary                                                                 In contrast, Europe’s clean energy investments peaked in
                                                                         2011 [Figure 5], with no signs of growth for 8 years. In
 As a vital resource in our lives, energy has spurred many modern        Europe, Wind energy is sub categorised into onshore, with
 advancements. Still, with rising concerns about global warming and      wind turbines installed on land, and offshore, with wind
 sustainability, traditional energy companies are pressured to find      turbines situated in water bodies. The popularity of
 alternative energy sources to avoid obsolescence. In this article, we   offshore wind has skyrocketed in recent years with
 analyse renewable energy trends and a case study of the transition      technological advancements as offshore wind speeds are
 towards renewable energy in a traditional oil & gas (O&G)               known to be higher and more consistent. By harnessing
 company, British Petroleum. We also examine the benefits and            the 3 sea basins surrounding Europe (the Baltic, the North
 drawbacks from the adoption of clean energy.                            Sea and part of the Atlantic), Europe is poised to increase
                                                                         its clean energy investments through offshore wind. Data
                                                                         from the IEA indicates that the increasingly competitive
Background Information                                                   offshore wind projects are on course to attract trillions of
A survey conducted by the Pew Research Center in November 2019           dollars in investments till 2040.
revealed that 77% of Americans believe that developing “alternative      With the COVID-19 pandemic devastating the global
energy” is of utmost importance. A separate survey by                    economy, governments have passed massive bills and
BloombergNEF observed an exponential trend in clean energy over          stimulus packages, rivalling those seen in the Global
the past 10 years, where a cumulative 59.5 GW have been purchased        Financial Crisis (GFC) of 2008. The ongoing crisis
representing a CAGR of 51.8%. Interestingly, the major players are       presents an opportune moment for a strategic ‘Green
tech companies such as Facebook, Google and Amazon, followed by          Recovery’. Back in 2008 after the GFC, 16% of global
traditional O&G companies. We believe that large tech companies are      stimulus was spent on green recovery with governments
aggressively pursuing renewable energy agreements due to investors’      giving subsidies for renewable energy and funding for
rising ESG concerns. Traditional O&G companies are also shifting         R&D of clean tech (e.g. electric vehicles). Although
towards cleaner energy by utilising solar/wind energy to power oil       renewable electricity capacity is forecasted by the IEA to
mining operations with investor sentiment in mind and to diversify       decline by 13% in 2020 [Figure 6], we attribute the
their individual exposure from unsystematic energy disasters. Overall,   decline to systematic factors such as policy uncertainty
from 2006-2019, new clean energy investments across the globe are        and market developments.
experiencing a steady upward trend, with no signs of slowing down in
the coming years [Figure 2].                                             Many countries still relate falling emissions with a
                                                                         faltering economy, although it has been proven to not be
                                                                         the case. Work is still needed to educate and ensure that
 Clean Investments Trends by Region                                      people see a clear path to high quality alternatives so as to
                                                                         achieve a sustainable future.
 APAC has outpaced the world in renewable energy dollar
 investments, with a CAGR of 10.7% from 2009-2019 compared to                                         *Refer to Appendix for figures
 0.46% and 7.8% in EMEA and America respectively [Figure 3].
 To illustrate its magnitude, BlackRock's global Head of Renewable
                                                                                                                            Analysts
 Power David Giordano highlighted that for every $10 spent
 globally on new renewables capacity, $4 goes towards APAC.                                                  Aaron Luke Devarajan
 Contributing to APAC’s popularity among green investors are the                                       VP (Global Macro Research)
 attractive 20 year feed-in-tariffs – payments to consumers for                                        kxdeverajan001@suss.edu.sg
 supplying excess clean energy to the grid – for the wind and solar
 markets in Taiwan, South Korea and Japan. Countries with high                                                   Bryan Lim Bei En
 renewable energy subsidies would likewise have high feed-in-                                             bryanlim006@suss.edu.sg
 tariffs and the opposite holds true as well.                                                                Charlton Koh Yong En
 In other regions, the US and Europe appear to diverge on clean                                        VP (Global Macro Research)
                                                                                                       charltonkoh001@suss.edu.sg
 energy investments [Figure 4 & Figure 5]. The US exhibits a
 positive trend over the past 10 years, indicating increasing clean                                                Shane Joachim
 energy investments. Investments in wind have eclipsed investments                                   shanejoachim001@suss.edu.sg
 in solar since 2014, a likely result of wind turbines being generally
 more efficient – a single wind turbine can generate the same                                              Quek Guang Xuan, Bryan
 amount of kWh as a thousand solar panels.                                                               bryanquek002@suss.edu.sg

                                                                                                                               Page | 3
SUSS INVESTMENT GROUP | SEPTEMBER 2020 | ISSUE #1 Global Macro Research
Figure 1: Renewables share of
A Case Study: British Petroleum (BP)
power generation by BP
In this case study, we analyse British Petroleum (BP), best chronicled as one of the
largest publicly traded oil companies in the world and a pioneer among titans, first
adopting clean energy into renewable energy sources as early as 1995 [Figure 1]. This
acceleration towards clean energy generation is largely due to immense public pressure
and scrutiny.
For example, in 2010, BP experienced the Deepwater Horizon oil spill. The oil spill
covered more than 112,000km2 of the ocean's surface with currents spreading the
spillage across 2,100km. This resulted in catastrophic effects on the environment with
the deaths of countless wildlife.
Figure 2: BP Share Price in 2010
The financial consequences were tremendous to BP. With 130 lawsuits filed against
them, BP’s share price plummeted [Figure 2]. Reportedly, US$11.6 billion was paid out
in reparations to coastal states with projected losses estimated at US$22.7 billion. In
addition, BP had to set up a US$2.3 billion fund for seafood & fishery business for the
job losses incurred by oil spill.
The Deepwater oil spill served as an expensive catalyst for BP to review their energy
sources and diversify their energy provisions. 10 years after the worst oil spill in human
history, it has taught large oil companies that ESG investing is not just a public relations
move, but also a growing market [Figure 3].
More recently, BP plans on cutting up to $17.5 billion from the value of their oil and
Figure 3: BP’s Renewable Share of
gas assets after their in-house research predicted that the pandemic may affect the Power Generation by Region
global oil demand for the next 30 years. This big move had to be executed to illustrate
the impact of the COVID-19 outbreak on the global economy as well as the increased
effort to build a better environment to be in line with the goals of the Paris Agreement,
as said by the CEO of BP, Bernard Looney.
Such traditional energy companies are constantly pressured by shareholders who want
to see ESG compliance and the practicing of responsible and sustainable operations.
The growing importance is also seen when Bloomberg announced the launch of the US
equity benchmark capabilities which aims to act as a basis for the Bloomberg SASB
ESG Index family. This product would also focus on realising the SASB’s vision of
“materiality-based ESG”. This materiality-based ESG by SASB aims to identify
financially material issues – issues which are more likely to make an impact on the
financial condition or operating performance of a company.
With renewables being the fastest-growing energy sector, BP has established a portfolio of renewable fuels, power and products.
Currently, they are also developing new business models in sectors such as the low carbon power and digital energy. These are
strategic efforts made by BP as it aims for net zero emissions by 2050 or earlier:
• Partnerships to maintain adherence to ESG criteria and • Led Series A funding in Grid Edge (Oct 2019), whose
permit use of alternative sources of energy. software predicts, controls and optimises a building’s energy
profile reducing carbon emissions by 10-15% on average.
• Invested in joint venture with DuPont (Apr 2017) producing
alternative fuel sources (bio-isobutanol) from corn. • Invested in joint venture with Bunge (Dec 2019) that
produces renewable energy from its biofuels manufacturing
• Increased stake in Lightsource BP, which aims to develop sites. Venture is now 2nd largest operator by effective crushing
10GW of solar projects by 2023. capacity in Brazil’s bioethanol market.
With the diversified portfolio illustrated above, BP aims to become an industry leader in clean energy. By bringing together the
expertise and assets of the partnerships and ventures, BP has a clear direction to improve and innovate more options for a better
environment, and also to prevent future energy disasters from crippling their operations. Overall, BP has a promising macro outlook
in terms of contributing towards the green recovery and providing a more sustainable future.
Page | 4SUSS INVESTMENT GROUP | SEPTEMBER 2020 | ISSUE #1 Appendix
Figure 1: Global Corporate Buying Clean Energy Power Purchase Agreements (PPA)
Source: BloombergNEF, U.S. Global Investors
Figure 2: Global New Investment in Clean Energy (2006-2019)
Source: BloombergNEF
Figure 3: Global New Investment in Clean Energy by Region (2006-2019)
Source: BloombergNEF
Page | A1SUSS INVESTMENT GROUP | SEPTEMBER 2020 | ISSUE #1 Appendix
Figure 4: United States New Investment in Clean Energy by Sector (2006-2019)
Source: BloombergNEF
Figure 5: Europe New Investment in Clean Energy by Sector (2006-2019)
Source: BloombergNEF
Figure 6: Renewable Electricity Capacity Additions, 2007-2021, Updated IEA Forecast
Source: International Energy Agency, 2020
Page | A2You can also read