Original Article Feasibility study of imaging diagnosis of diabetes mellitus patients with pulmonary tuberculosis
←
→
Page content transcription
If your browser does not render page correctly, please read the page content below
Int J Clin Exp Med 2021;14(1):365-373
www.ijcem.com /ISSN:1940-5901/IJCEM0119973

Original Article
Feasibility study of imaging diagnosis of diabetes
mellitus patients with pulmonary tuberculosis
Wencai Tang*, Weijin Xing*, Chuanzi Li, Zhongshi Nie, Mubin Cai

Department of Radiology, The Second Affiliated Hospital of Hainan Medical University, Haikou 570311, Hainan
Province, China. *Equal contributors and co-first authors.
Received August 10, 2020; Accepted September 29, 2020; Epub January 15, 2021; Published January 30, 2021

Abstract: Objective: To analyze the feasibility of CT diagnosis for patients with diabetes mellitus (DM) and pulmonary
tuberculosis (PTB). Methods: A total of 120 DM patients with PTB in our hospital were included in the combination
group, and 50 patients with PTB were included in the PTB group. CT examination was performed in all patients and
the diagnostic value of CT was analyzed. Results: No significant difference was found in PTB lesions between the
combination group and PTB group (P > 0.05). The incidence rates of cavities, necrosis and caseous pneumonia in
the combination group were higher than those in the PTB group (P < 0.05). In the combination group, the ratios of
tuberculosis (TB) in a single pulmonary lobe and two or more pulmonary lobes were 33.33% and 66.67% respec-
tively, while those were 54.00% and 46.00% respectively in the PTB group (P < 0.05). No significant difference was
found in the number of pulmonary segments in the classification of good, general and poor glycemic control effects
(P > 0.05). Significant differences were found in the incidence of large flakes of segmental and lobar shadows,
bronchial inflation signs, wall-less cavities, multiple cavities, thick-walled cavities, and bronchial TB among classifi-
cation of good, general and poor glycemic control effects (P < 0.05). Conclusion: There are certain differences in CT
manifestations between patients with both DM and PTB and patients with PTB. There are certain differences in CT
manifestations among DM patients with PTB with good, general and poor glycemic control effects. These results ex-
hibit that when using CT for diagnosis of whether DM patients have PTB can be performed and the glycemic control
effects on DM patients can be identified.

Keywords: Diabetes mellitus, pulmonary tuberculosis, imaging, CT, diagnosis, feasibility

Introduction                                                     cult to diagnose, confirm and treat DM patients
                                                                 with PTB [5]. For the diagnosis of DM patients
Pulmonary tuberculosis (PTB) is a common                         with PTB, an accurate diagnosis of PTB plays a
infectious disease, and its occurrence is close-                 pivotal role. An observation room was estab-
ly related to the living environment and nutri-                  lished to monitor the typical symptoms and
tional status of patients [1]. Diabetes mellitus                 signs, multiple auxiliary examination methods,
(DM) is a chronic metabolic disease with a high                  such as pulmonary biopsy, fiberoptic bronchos-
incidence rate in China. Recently, the incidence                 copy, sputum smear and culture for acid-fast
rate of DM, especially type 2 diabetes, has                      bacilli (AFB), and T-SPOT.TB examination were
been on the rise due to changes in diet and life-                adopted [6, 7]. In China, the diagnosis of PTB
style [2].
                                                                 is mainly based on sputum culture or sputum
Studies have found that the incidence rate of                    smear, and it is difficult to obtain a high posi-
DM patients with PTB is considerably higher                      tive detection rate. Additionally, some me-
than healthy people with PTB; DM and PTB are                     thods, such as T-SPOT.TB examination, have a
closely related they affect each other, and the                  higher cost. The PPD test is easily affected by
influence of DM on PTB is greater than that of                   multiple factors. There is some trauma in using
PTB on DM [3, 4]. DM patients with PTB show                      the pulmonary biopsy and fiberoptic bronchos-
no typical symptoms, but they have a high posi-                  copy, resulting in a low acceptance rate of
tive rate of cultured Mycobacterium TB. The                      patients. These factors hinder the promotion
pulmonary lesions are widely distributed and                     and application of the aforementioned meth-
they are of high severity. It remains very diffi-                ods [8, 9].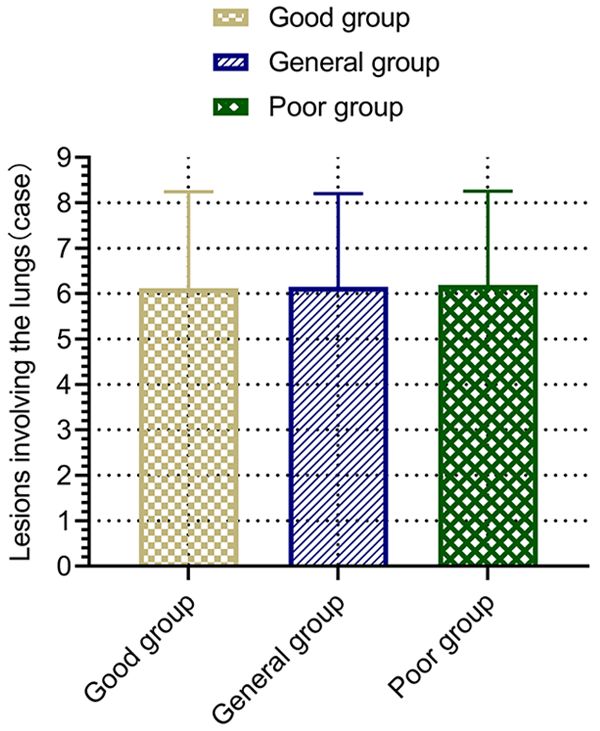
Feasibility of CT diagnosis of DM patients with PTB

Long-term studies suggest that the diagnosis          their breath after a deep inhalation. The scan
of DM patients with PTB must be comprehen-            was performed when the patients held their
sively analyzed based on the symptoms and             breath, with a top-down scan from pulmonary
multiple examination results, so as to ensure         tip to costophrenic angle. Parameter settings:
as high accuracy as possible. Compared with           reconstruction interval: 5 mm, reconstruction
the aforementioned methods, imaging meth-             layer thickness: 5 mm, thin layer reconstruc-
ods are more feasible. As a common imaging            tion: 1 mm, reconstruction matrix: 1024*1024,
method in clinical diagnosis, CT plays a crucial      image scanning matrix: 1024*1024, current:
role in the diagnosis of multiple diseases [10].      250 mA, voltage: 125 kV. The standard algo-
However, in previous studies, CT was mostly           rithm was selected.
adopted in the diagnosis of PTB in patients,
and very few studies used CT to diagnose DM           After the examination, two highly qualified phy-
patients with PTB. In this study, a total of 120      sicians from the Imaging Department read the
DM patients with PTB and 50 PTB patients in           films on PACS, and made unified diagnostic
our hospital were selected as the study sub-          opinions after consultation or discussion with
jects. The application value of CT in the diagno-     the supervising physicians. The exudation, dis-
sis of DM patients with PTB was extensively           tribution, proliferation, bronchus, pleural effu-
explored.                                             sion, cavities and lymph nodes of PTB lesion
                                                      patients were observed and accurately record-
Materials and methods                                 ed in the registration form.
Data                                                  Observation indices
From June 2018 to March 2020, a total of 50
                                                      Imaging manifestations: the distribution, fea-
PTB patients (PTB group) and 120 DM patients
                                                      tures and range of lesions were observed
with PTB (combination group) who were admit-
                                                      between the combination group and PTB group.
ted to our hospital were selected as the study
subjects. Inclusion criteria: patients who were       Fasting blood glucose detection: fasting blood
in line with the diagnostic criteria of PTB: refer-   glucose level (hexokinase method) was mea-
ring to the relevant diagnostic criteria in the       sured using a Hitachi 7600 automatic bio-
Guidelines for the Diagnosis and Treatment of         chemical analyzer and glucose diagnostic
Pulmonary Tuberculosis (2013 Edition). The            reagent. According to fasting blood glucose,
positive sputum examination was regarded as           the patients in the combination group were
the positive PTB marker [11]. The diagnostic          divided into three classifications: the group
criteria of type 2 diabetes were: clinical symp-      with good glycemic control (fasting blood glu-
toms of DM plus random blood glucose re-              cose level: < 7 mmol/L), the group of general
sults  10
plete diagnostic and treatment data; and
                                                      mmol/L). The number of pulmonary segments
those with good compliance were included in
                                                      involved, the incidence of large flakes of seg-
the study. The consent form was signed by the
                                                      mental and lobar shadows, bronchial inflation
patient or his/her guardian. The study was
                                                      signs, wall-less cavities, single cavities, multi-
approved by the Ethical Committee of The
                                                      ple cavities, thin-walled cavities, thick-walled
Second Affiliated Hospital of Hainan Medical
                                                      cavities, patchy shadows, proliferative nodules,
University. Exclusion criteria: Patients with type
                                                      enlarged lymph nodes, pleural effusion and
1 diabetes; those who recently received radio-
                                                      bronchial tuberculosis (BTB) were compared
therapy or chemotherapy; those complicated
                                                      among the three groups.
with AIDS; those with an allergic constitution;
and those with serious systemic diseases were         The analysis standard for CT manifestations
excluded.                                             of PTB: BTB: CT examination showed that the
Methods                                               bronchial wall was thickened, the lesion’s
                                                      range was long, the lumen was narrowed, and
All patients were examined using Philips 128-         the inner wall was irregular. Mediastinal en-
slice spiral CT scanner, and instructed to hold       larged lymph nodes referred to lymph nodes

366                                                           Int J Clin Exp Med 2021;14(1):365-373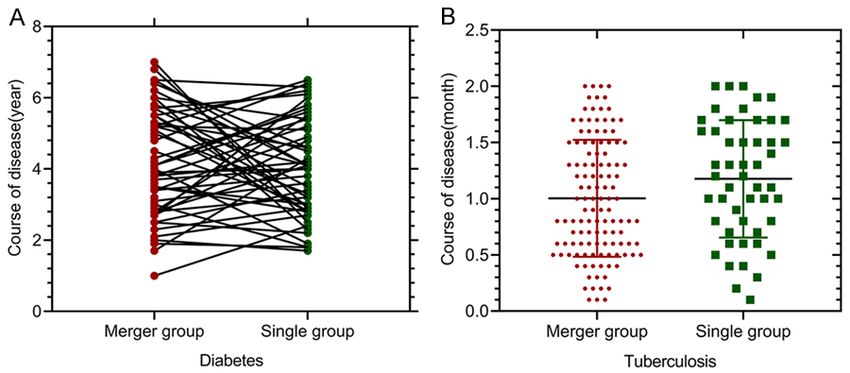
Feasibility of CT diagnosis of DM patients with PTB

                                                             _
Table 1. Comparison of general data between the two groups ( x ± s)/[n (%)]
Data                                   Combination group (n = 120)    PTB group (n = 50)      t/X2       P
Sex                      M                     72 (60.00)                31 (62.00)          0.059     0.808
                         F                     48 (40.00)                19 (38.00)
Age (years)                                  56.38 ± 15.49              58.41 ± 13.37        0.809     0.420
BMI (kg/m2)                                   21.16 ± 1.39              21.52 ± 1.42         1.529     0.128
Incidence of PTB         Incidence             83 (69.17)                35 (70.00)          0.012     0.914
                         Recurrence            37 (30.83)                15 (30.00)
Course of DM (years)                           4.19 ± 2.37               4.26 ± 2.54         0.172     0.864
Course of PTB (months)                        1.39 ± 0.57                1.42 ± 0.60         0.308     0.759

                                                                               increased obviously and the
                                                                               consolidation shadows were
                                                                               uniform.

                                                                               Statistical analysis

                                                                                   Statistical analysis was per-
                                                                                   formed using SPSS 23.0. The
                                                                                   measurement_ data were ex-
                                                                                   pressed as ( x ± sd), and the
                                                                                   results were compared using
                                                                                   the independent sample t
Figure 1. Comparison of courses between the combination group and the              test. Enumeration data were
PTB group. There was no significant difference in the course of DM between         expressed as [n (%)], results
the PTB group (A) and the combination group (P > 0.05). There was no sig-          were compared using chi-
nificant difference in the course of PTB between the PTB group (B) and the
combination group (P > 0.05).                                                      squared test. The multi-point
                                                                                   comparison within the group
                                                                                   was analyzed using ANVOA,
with the largest diameter exceeding 15 mm.                     and detected using F test. Figures were made
Cavity: cavity was formed as a result of the                   using Graphpad Prism 8. P < 0.05 indicated a
necrosis, liquefaction and drainage of patho-                  statistically significant difference.
logical tissues in the lung through the drainage
bronchus. Small patchy shadows: CT examina-                    Results
tion revealed that the plaques in pulmonary
lesions were high-density shadows, the density                 General data
of central lesions was higher than that of the
peripheral lesion, and the edge of the lesion                  There was no statistically significant differen-
was not clearly visible. Centrilobular nodular                 ce in the male-to-female ratio and the occur-
shadows: they were located in the center of                    rence and recurrence rates of PTB between
                                                               the combination group and PTB group (P >
lobule, and the nodule was not connected with
                                                               0.05). There was no significant difference in
the interlobular septum and pleura. CT showed
                                                               mean age, mean body mass index (BMI), cour-
the nodule shadow with a size of 2 mm-8 mm
                                                               se of DM and course of PTB between the com-
and an unclear edge. Bronchial inflation sign:
                                                               bination group and PTB group (P > 0.05) (Table
branch shadows and bright bronchus were vis-
                                                               1 and Figure 1).
ible in large flakes of segmental and lobar pul-
monary consolidation shadows. Segmental                        Distribution of lesions in the combination
and lobar consolidation shadows: pathological                  group and PTB group
tissues, such as inflammation, edema and
hemorrhage replaced the gas in alveolar cavi-                  There was no statistically significant difference
ties to form flaky shadows, and the density of                 in the ratios of PTB lesions in the anterior seg-
pulmonary segments and the lobar density                       ment of the upper lobe, dorsal segment of the

367                                                                  Int J Clin Exp Med 2021;14(1):365-373
Feasibility of CT diagnosis of DM patients with PTB
Table 2. Analysis of the distribution of lesions in combination group and single PTB group [n (%)]
Number of Anterior segment Dorsal segment of Posterior tip of Middle Basal segment of Lingual segment Posterior segment of
Group
patients of upper lobe lower lobe upper lobe lobe lower lobe of upper lobe upper lobe
Combination group 120 25 (20.83) 35 (29.17) 50 (41.67) 3 (2.50) 3 (2.50) 2 (1.67) 2 (1.67)
PTB group 50 15 (30.00) 10 (20.00) 21 (42.00) 1 (2.00) 1 (2.00) 1 (2.00) 1 (2.00)
X2 1.648 1.524 0.002 0.038 0.038 0.023 0.023
P 0.199 0.217 0.968 0.845 0.845 0.880 0.880
368 Int J Clin Exp Med 2021;14(1):365-373Feasibility of CT diagnosis of DM patients with PTB
Table 3. Analysis of characteristics of PTB lesions in the combination group and the PTB group [n (%)]
Number of Exudative Cavities and Signs of bronchial Caseous
Group Others
patients lesions necrosis dissemination pneumonia
Combination group 120 19 (15.83) 46 (38.33) 11 (9.17) 34 (28.33) 10 (8.33)
PTB group 50 14 (28.00) 11 (22.00) 9 (18. 00 ) 7 (14.00) 9 (18.00)
X2 3.340 4.225 2.653 3.962 3.322
P 0.068 0.040 0.103 0.047 0.068
Table 4. Analysis of the distribution range of PTB lesions in lesions in the anterior segment of
the combination group and the PTB group [n (%)] the upper lobe, dorsal segment of
Number of In a single In two or more the lower lobe and posterior tip of
Group the upper lobe in the combination
patients pulmonary lobe pulmonary lobes
Combination group 120 40 (33.33) 80 (66.67) group and PTB group were signifi-
PTB group 50 27 (54.00) 23 (46.00) cantly higher than those of PTB
X2
6.313
lesions in middle lobe, basal seg-
ment of the lower lobe, lingual seg-
P 0.012
ment and posterior segment of the
upper lobe in the combination
group and PTB group (P < 0.05), and there was
a statistically significant difference in the com-
parison of the aforementioned two ratios (Table
2).
Lesion characteristics in the combination
group and PTB group
The incidence rates of cavities and necrosis
and caseous pneumonia in the characteristics
of PTB lesions in the combination group were
higher than those in the PTB group (P < 0.05),
but there was no significant difference in the
incidence rates of exudative lesions, signs of
bronchial dissemination and other characteris-
tics between the combination group and PTB
group (P > 0.05) (Table 3).
Distribution range of lesions in combination
group and simple PTB group
The results of the distribution range of PTB
Figure 2. Blood glucose control level and lesion- lesions in the combination group exhibited that
involved pulmonary segments. There was no sig- the ratios of PTB lesions in a single lobe and
nificant difference in lesion-involved pulmonary seg- two or more lobes were 33.33% and 66.67%
ments among the classifications of good, general
and poor glycemic control (P > 0.05). There was no respectively, while those in the PTB group were
significant difference in lesion-involved pulmonary 54.00% and 46.00% respectively, showing sta-
segments between the classifications of general and tistically significant differences in the distribu-
poor glycemic control (P > 0.05). tion range of PTB lesions between the two
groups (P < 0.05) (Table 4).
lower lobe, posterior tip of the upper lobe, mid- Lesion-involved pulmonary segments in pa-
dle lobe, basal segment of the lower lobe, the tients with different glycemic control effects
lingual segment and posterior segment of the
upper lobe between the combination group Based on fasting glycemic control effects, the
and PTB group (P > 0.05). The ratios of PTB combination group was divided into three clas-
369 Int J Clin Exp Med 2021;14(1):365-373Feasibility of CT diagnosis of DM patients with PTB
Table 5. CT manifestations of patients with different glycemic control effects
Group of good Group of general Group of poor
Manifestations glycemic control glycemic control glycemic control F P
effects (n = 50) effects (n = 40) effects (n = 30)
Large flakes of segmental and lobar shadows 20 (40.00) 25 (62.50) 25 (83.33) 5.521 0.008
Bronchial inflation signs 18 (36.00) 24 (60.00) 24 (80.00) 5.489 0.005
Wall-less cavities 15 (30.00) 20 (50.00) 20 (66.67) 4.527 0.002
Single cavities 12 (24.00) 10 (25.00) 8 (26.67) 1.346 0.182
Multiple cavities 10 (20.00) 18 (45.00) 21 (70.00) 5.847 0.009
Thin-walled cavities 7 (14.00) 5 (12.50) 4 (13.33) 0.659 0.261
Thick-walled cavities 10 (20.00) 15 (37.50) 18 (60.00) 5.018 0.008
Small patchy shadows 44 (88.00) 35 (87.50) 26 (86.67) 1.126 0.419
Proliferative nodules 40 (80.00) 33 (82.50) 25 (83.33) 1.074 0.637
Enlarged lymph nodes 4 (8.00) 4 (10.00) 3 (10.00) 0.857 0.411
Pleural effusion 7 (14.00) 5 (12.50) 4 (13.33) 1.063 0.528
Bronchial tuberculosis 11 (22.00) 16 (40.00) 18 (60.00) 6.285 0.000
sifications, namely, the group with good glyce- ties, patchy shadows, proliferative nodules,
mic control (n = 50), the group with general gly- enlarged lymph nodes and pleural effusion
cemic control (n = 40) and the group with poor among the three groups (P > 0.05) (Table 5).
glycemic control (n = 30). There were (5.62 ±
4.19) lesions found in pulmonary segments in Discussion
the group with good glycemic control, (5.79 ±
4.14) lesions foundin the group with general Mycobacterium TB is the major pathogen of
glycemic control and (6.17 ± 4.27) lesions foun- TB, and Mycobacterium bovis is the primary
din the group with poor glycemic control. There pathogen of human TB [13]. A study of DM sug-
was no significant difference in the number of gests that type 2 diabetes is closely related to
pulmonary segments involved in the distribu- immune level and inflammation [14]. The
tion of lesions among the three groups (P > studies of PTB and DM reveal that there are
0.05) (Figure 2). mutual influences between PTB and DM, and
the influences of DM on PTB are: impaired
CT manifestations in patients with different glucose regulation in DM patients, continuous
glycemic control effects accumulation of fructose and sorbitol in the
microcirculation that provides the necessary
According to the statistical results in Table 5,
nutrient source for the reproduction of
the main CT manifestation found in DM pa-
Mycobacterium TB, and DM patients often
tients with PTB included large flakes of seg-
have different degrees of immune damage,
mental and lobar shadows, small patchy shad-
resulting in an elevated infection risk of
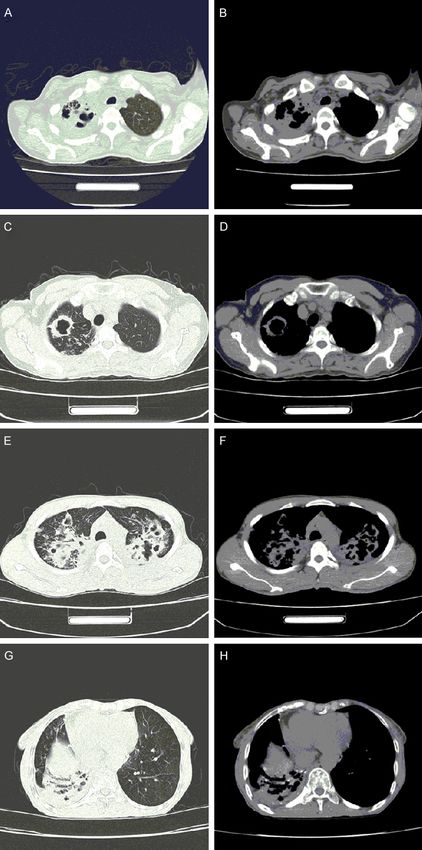
ows, wall-less cavities (Figure 3A, 3B), thick-
walled cavities (Figure 3C, 3D), thin-walled Mycobacterium TB [15, 16]. Another study
cavities, single cavities, multiple cavities (Fi- exhibited that the continuous high level of
gure 3E, 3F), bronchial TB, bronchial inflation blood glucose in DM patients significantly
signs (Figure 3G, 3H), proliferative nodules, reduces the immune activity of peripheral
enlarged lymph nodes and pleural effusion. blood lymphocytes [17]. The influence of PTB
There was a statistically significant difference on DM includes the occurrence of PTB that
in the incidence rates of large flakes of seg- leads to glucose intolerance and this affects
mental and lobar shadows, bronchial inflation the glycemic control in DM patients. During
signs, wall-less cavities, multiple cavities, thick- therapy, anti-tuberculosis drugs exert adverse
walled cavities and bronchial TB among the effects on blood glucose. Studies show that
classifications of good, general and poor glyce- isoniazid, an anti-tuberculosis drug, can inhibit
mic control effects (P < 0.05), but there was no liver cell enzymes, leading to the accumula-
statistically significant difference in the inci- tion of active metabolites of glimepiride and
dence rates of single cavities, thin-walled cavi- elevating the risk of hypoglycemia [18, 19].
370 Int J Clin Exp Med 2021;14(1):365-373Feasibility of CT diagnosis of DM patients with PTB
multiple cavities of different sizes
in the upper lobe of both lungs
(E), and the mediastinal window
revealed multiple cavities of dif-
ferent sizes in the upper lobes
of both lungs (F). The pulmonary
window showed the consolidation
with bronchial inflation signs in
the right lower lobe (G), and the
mediastinal window revealed con-
solidation with bronchial inflation
signs in the right lower lobe (H).
Therefore, patients with DM
should be regularly examined
for prevention and early diag-
nosis of PTB. The results of
this study exhibited that the
incidence rates of cavities,
necrosis and caseous pneu-
monia and the ratio of PTB
lesions in two or more lung
lobes in the combination
group were higher than those
in the PTB group. This exhibit-
ed that there were some dif-
ferences in CT imaging mani-
festations between the com-
bination group and PTB group.
This suggested that diagnos-
ing DM patients with PTB
could be assessed using
CT examination results. The
aforementioned imaging dif-
ferences may be related to
the recurrence of primary
lesions, and may also be
caused by inhalation infec-
tions as a result of caseous
lymphadenitis, or blood and
lymphatic infection [20]. Simi-
lar studies have also suggest-
ed that the ratio of TCR4 and
TCR3 cells in the peripheral
blood of DM patients with
PTB was significantly reduc-
ed, and the cellular immunity
mediated by T cells was inhib-
ited, which promoted the
growth and reproduction of
Figure 3. CT imaging manifestations of DM patients complicated with PTB. Mycobacterium TB and led to
The pulmonary window showed the wall-less cavity in the right upper lobe the fusion and necrosis of
(A), and the mediastinal window revealed the wall-less cavity in the right
upper lobe (B). The pulmonary window suggested the thick-walled cavity large lesions. In this case,
in the right upper lobe (C), and the mediastinal window showed the thick- the number of CD8+ T cells
walled cavity in the right upper lobe (D). The pulmonary window indicated increased remarkably, and the
371 Int J Clin Exp Med 2021;14(1):365-373Feasibility of CT diagnosis of DM patients with PTB
toxic effects of such cells damaged the normal have PTB can be performed and the glycemic
islet tissues. The combination of CD8+ T cells control effects on DM patients can be identi-
and the cord factor of Mycobacterium TB fied. However, the number of subjects enrolled
caused damage to the pulmonary tissue and in this study is insufficient, and the manifesta-
eventually led to cavities and caseous necrosis tions of PTB are classified based on different
[21, 22]. blood glucose levels, while the analysis of DM
was not performed based on PTB. There is a
This study also exhibited that there were lack of comprehensiveness in the analysis of
some differences in CT imaging manifesta- the study results, and the results obtained
tions of DM patients with PTB with different may be biased to some extent. In the future,
qualities of glycemic control. The CT imaging we will conduct more in-depth studies with a
manifestations were large flakes of segmental larger sample size and focus on prospective
and lobar shadows, bronchial inflation signs, studies, so as to obtain more scientific study
wall-less cavities, multiple cavities, thick-wall- conclusions, thus providing better references
ed cavities and bronchial TB, and they gradu- for the diagnosis and treatment of DM patients
ally increased with the decrease of blood glu- with PTB.
cose level control quality (P < 0.05). A similar
study also found that the increase in glucose Disclosure of conflict of interest:
concentration was positively correlated with
severity of TB at a certain concentration, that None.
is, a higher glucose concentration indicated
Address correspondence to: Mubin Cai, Depart-
higher severity of PTB [23]. This indicated that
ment of Radiology, The Second Affiliated Hospital
higher fasting blood glucose levels of DM
of Hainan Medical University, No. 48, Baishuitang
patients indicated a higher severity of TB
Road, Longhua District, Haikou 570311, Hainan
lesions after DM patients were complicated
Province, China. Tel: +86-0898-65399087; E-mail:
with PTB. This revealed that the blood glucose
zyh14a@163.com
level control quality in DM patients with PTB
could be assessed using CT examination, and References
the degree of PTB could be judged by measur-
ing blood glucose levels. DM complicated with [1] Cardona PJ. Pathogenesis of tuberculosis and
PTB is generally an active condition, and it can other mycobacteriosis. Enferm Infecc Microbiol
develop rapidly as a result of the decrease in Clin 2018; 36: 38-46.
[2] Chong PL, Pisharam J, Abdullah A and Chong
immunity of DM patients with PTB [24]. The
VH. Gestational diabetes insipidus. QJM 2019;
weakened cellular immune functions of DM
112: 123-124.
patients, reduced epithelial-like cells, gradually [3] Cheng J, Zhang H, Zhao YL, Wang LX and Chen
enlarged lesions of caseous necrosis, and MT. Mutual impact of diabetes mellitus and tu-
gradually increased infection of Mycobacte- berculosis in China. Biomed Environ Sci 2017;
rium TB or even completely lost cellular immu- 30: 384-389.
nity leads to a wide array of caseous necrosis [4] Lee MR, Huang YP, Kuo YT, Luo CH, Shih YJ,
[25]. Higher fasting blood glucose levels of DM Shu CC, Wang JY, Ko JC, Yu CJ and Lin HH. Dia-
patients indicates a higher incidence of bron- betes mellitus and latent tuberculosis infec-
chial issues. This may be due to the low immu- tion: a systematic review and meta-analysis.
nity and rapid progression of disease in DM Clin Infect Dis 2017; 64: 719-727.
patients with PTB. A large number of inflamma- [5] Salgado-Bustamante M, Rocha-Viggiano AK,
Rivas-Santiago C, Magaña-Aquino M, López JA
tory exudates replaces the gas originally exist-
and López-Hernández Y. Metabolomics ap-
ing in alveoli, and the pulmonary tissues have
plied to the discovery of tuberculosis and dia-
caseous consolidation [26]. betes mellitus biomarkers. Biomark Med
2018; 12: 1001-1013.
In summary, there are certain differences in
[6] Al-Rifai RH, Pearson F, Critchley JA and Abu-
CT manifestations between patients with DM Raddad LJ. Association between diabetes mel-
and PTB and PTB alone. There are certain dif- litus and active tuberculosis: a systematic re-
ferences in CT manifestations among DM view and meta-analysis. PLoS One 2017; 12:
patients with PTB with good, general and poor e0187967.
glycemic control effects. This indicates that [7] Workneh MH, Bjune GA and Yimer SA. Preva-
using CT, the diagnosis of whether DM patients lence and associated factors of tuberculosis
372 Int J Clin Exp Med 2021;14(1):365-373Feasibility of CT diagnosis of DM patients with PTB
and diabetes mellitus comorbidity: a system- [17] Bichet DG. Genetics and diagnosis of central
atic review. PLoS One 2017; 12: e0175925. diabetes insipidus. Ann Endocrinol (Paris)
[8] Jabri H, Lakhdar N, El Khattabi W and Afif H. 2012; 73: 117-127.
Diagnostic means for tuberculosis. Rev Pneu- [18] Rao S, Rahim M, Iqbal K, Haroon F and Hasan
mol Clin 2016; 72: 320-325. Z. Impact of diabetes on mechanisms of im-
[9] Sharma SK, Vashishtha R, Chauhan LS, Sreeni- munity against mycobacterium tuberculosis. J
vas V and Seth D. Comparison of TST and IGRA Pak Med Assoc 2019; 69: 94-98.
in diagnosis of latent tuberculosis infection in [19] Pizzol D, Di Gennaro F, Chhaganlal KD, Fabrizio
a high TB-burden setting. PLoS One 2017; 12: C, Monno L, Putoto G and Saracino A. Tubercu-
e0169539. losis and diabetes: current state and future
[10] Ranzani OT, Rodrigues LC, Waldman EA, Prina perspectives. Trop Med Int Health 2016; 21:
E and Carvalho CRR. Who are the patients with 694-702.
tuberculosis who are diagnosed in emergency [20] Kim J, Lee IJ and Kim JH. CT findings of pulmo-
facilities? An analysis of treatment outcomes nary tuberculosis and tuberculous pleurisy in
in the state of São Paulo, Brazil. J Bras Pneu- diabetes mellitus patients. Diagn Interv Radiol
mol 2018; 44: 125-133. 2017; 23: 112-117.
[11] Molicotti P, Bua A and Zanetti S. Cost-effective- [21] Li D, He W, Chen B and Lv P. Primary multidrug-
ness in the diagnosis of tuberculosis: choices resistant tuberculosis versus drug-sensitive
in developing countries. J Infect Dev Ctries tuberculosis in non-HIV-infected patients: com-
2014; 8: 24-38. parisons of CT findings. PLoS One 2017; 12:
[12] Robertson GL. Diabetes insipidus: differential e0176354.
diagnosis and management. Best Pract Res [22] Song Q, Zhang G, Jiang H, Ren Y and Lu X. Im-
Clin Endocrinol Metab 2016; 30: 205-218. aging features of pulmonary CT in type 2 dia-
[13] Schito M, Migliori GB, Fletcher HA, McNerney betic patients with multidrug-resistant tuber-
R, Centis R, D’Ambrosio L, Bates M, Kibiki G, culosis. PLoS One 2016; 11: e0152507.
Kapata N, Corrah T, Bomanji J, Vilaplana C, [23] Liu J, Sun Z, Xie R, Gao M and Li C. Special
Johnson D, Mwaba P, Maeurer M and Zumla A. computer-aided computed tomography (CT)
Perspectives on advances in tuberculosis diag- volume measurement and comparison meth-
nostics, drugs, and vaccines. Clin Infect Dis od for pulmonary tuberculosis (TB). Int J Clin
2015; 61 Suppl 3: S102-118. Exp Med 2015; 8: 15117-15126.
[14] Aleksandrov N, Audibert F, Bedard MJ, Mahone [24] Qian Y, Han Q, Liu W, Yuan WE and Fan C. Char-
M, Goffinet F and Kadoch IJ. Gestational diabe- acteristics and management of bone and joint
tes insipidus: a review of an underdiagnosed tuberculosis in native and migrant population
condition. J Obstet Gynaecol Can 2010; 32: in Shanghai during 2011 to 2015. BMC Infect
225-231. Dis 2018; 18: 543.
[15] Blanco-Guillot F, Delgado-Sánchez G, Mongua- [25] Huang LK, Wang HH, Lai YC and Chang SC. The
Rodríguez N, Cruz-Hervert P, Ferreyra-Reyes L, impact of glycemic status on radiological man-
Ferreira-Guerrero E, Yanes-Lane M, Montero- ifestations of pulmonary tuberculosis in dia-
Campos R, Bobadilla-Del-Valle M, Torres- betic patients. PLoS One 2017; 12: e0179750.
González P, Ponce-de-León A, Sifuentes-Osor- [26] Mathur M, Badhan RK, Kumari S, Kaur N and
nio J and Garcia-Garcia L. Molecular clustering Gupta S. Radiological manifestations of pul-
of patients with diabetes and pulmonary tuber- monary tuberculosis - a comparative study be-
culosis: a systematic review and meta-analy- tween immunocompromised and immunocom-
sis. PLoS One 2017; 12: e0184675. petent patients. J Clin Diagn Res 2017; 11:
[16] Prada-Medina CA, Fukutani KF, Pavan Kumar TC06-TC09.
N, Gil-Santana L, Babu S, Lichtenstein F, West
K, Sivakumar S, Menon PA, Viswanathan V, An-
drade BB, Nakaya HI and Kornfeld H. Systems
immunology of diabetes-tuberculosis comor-
bidity reveals signatures of disease complica-
tions. Sci Rep 2017; 7: 1999.
373 Int J Clin Exp Med 2021;14(1):365-373You can also read