Layer-specific strain and dyssynchrony index alteration in new-onset systemic lupus erythematosus patients without cardiac symptoms
←
→
Page content transcription
If your browser does not render page correctly, please read the page content below
Original Article

Layer-specific strain and dyssynchrony index alteration in
new-onset systemic lupus erythematosus patients without cardiac
symptoms
Tingting Luo1#, Zhenhua Wang2#, Zhen Chen3, Ermei Yu1, Chenglong Fang3
1
Department of Echocardiography, Second Affiliated Hospital of Fujian Medical University, Quanzhou, China; 2Department of Cardiology, Second
Affiliated Hospital of Fujian Medical University, Quanzhou, China; 3Department of Rheumatology, Second Affiliated Hospital of Fujian Medical
University, Quanzhou, China

#
These authors contributed equally to this work.

Correspondence to: Chenglong Fang. Department of Rheumatology, Second Affiliated Hospital of Fujian Medical University, Donghai Avenue 950,
Quanzhou 362000, China. Email: fangcl900523@126.com.

                  Background: Layer-specific speckle-tracking echocardiography (STE) is a noninvasive approach that
                  assesses subclinical left ventricular dysfunction. We aimed to investigate the (I) alteration of layer-specific
                  STE parameters and the dyssynchrony index; and (II) the disease parameters associated with layer-specific
                  STE change in drug-naïve patients with new-onset systemic lupus erythematosus (SLE) without cardiac
                  symptoms.
                  Methods: Thirty-five drug-naïve patients with new-onset SLE and twenty-five healthy controls were
                  enrolled. All individuals received both conventional echocardiographic and two-dimensional STE
                  assessment. The data of layer-specific global longitudinal strain (GLS), global circumferential strain (GCS),
                  and peak systolic dispersion (PSD) were acquired in layer-specific STE.
                  Results: All patients had a normal left ventricular ejection fraction (LVEF)(mean LVEF: 58%) and
                  conventional echocardiographic parameters were comparable between patients and controls. Decreased
                  layer-specific GLS and elevated PSD were observed in SLE patients (whole layer GLS: −17.6%±3.0% versus
                  −19.3%±2.6%, P=0.02; endocardial GLS: −20.0%±3.2% versus −22.1%±3.0%, P=0.01; epicardial GLS:
                  −15.6%±2.7% versus −16.8%±2.4%, P=0.04; PSD: 41.0±18.9 versus 28.8±10.1 msec, P=0.007). In contrast,
                  there was no difference in layer-specific GCS at three different levels between patients and controls (P>0.05).
                  More severely impaired GLS was observed in patients with higher disease activity, high-risk antiphospholipid
                  antibody (aPL) profile, or renal involvement. The PSD was increased in patients with higher disease activity
                  or a high-risk aPL profile. Correlational analysis showed that GLS at three layers and PSD correlated with
                  high-sensitivity C-reactive protein (hsCRP) levels (whole GLS: r=0.662, P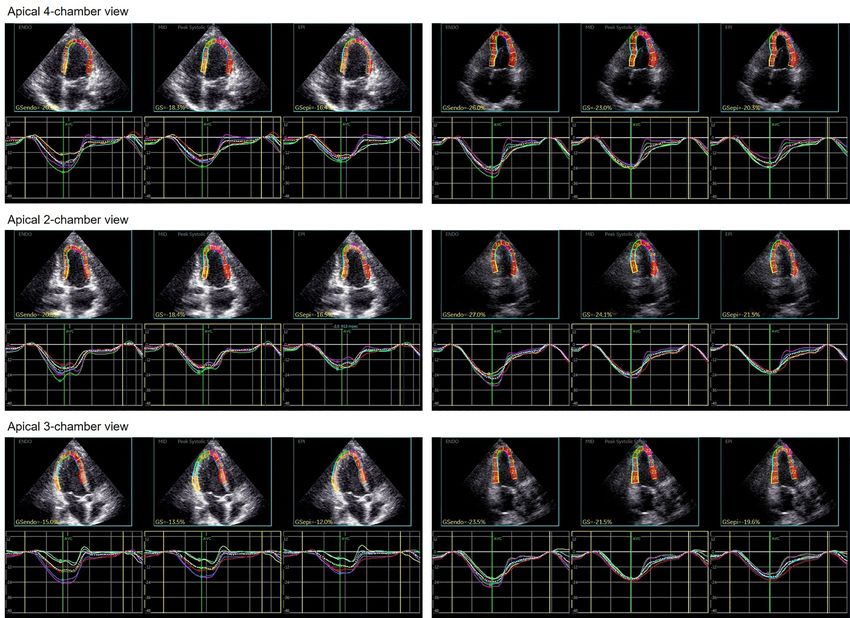
1272                                                                             Luo et al. Layer-specific speckle-tracking scan in SLE patients

                  Submitted Jul 13, 2020. Accepted for publication Oct 26, 2020.
                  doi: 10.21037/qims-20-859
                  View this article at: http://dx.doi.org/10.21037/qims-20-859

Introduction                                                                   2020. All patients fulfilled the 2012 American College
                                                                               of Rheumatology (ACR)/Systemic Lupus International
With advances in immunosuppressive therapies, the short-
                                                                               Collaborating Clinics (SLICC) criteria (10). The onset of
term outcome of patients with systemic lupus erythematosus
                                                                               SLE-related symptoms occurred within 1 month prior to
(SLE) has significantly improved. However, SLE patients
                                                                               study entry, and patients had no cardiac symptoms. Disease
have up to a 10-fold increased risk of cardiovascular
                                                                               activity was assessed by the Systemic Lupus Erythematosus
morbidity and mortality, and cardiac involvement still
                                                                               Disease Activity Index-2K (SLEDAI-2K). The high-risk
accounts for most deaths (1). Cardiac impairment in SLE is
                                                                               antiphospholipid antibody (aPL) profile was defined as
often asymptomatic and not always in parallel with disease
                                                                               the presence of lupus anticoagulant, or of double or triple
activity (2,3). While transthoracic echocardiography is a
                                                                               aPL positivity, or the presence of persistently high aPL
routine method to screen cardiovascular system involvement
                                                                               titres (11). A group of healthy controls included age-
in SLE, it often fails to detect subclinical ventricular
                                                                               matched volunteers with a negative result to antinuclear
dysfunction for several reasons. For example, abnormal left
                                                                               antibodies and no history of systemic disease was also
ventricular ejection fraction (LVEF) tends to reflect global
                                                                               established. Other inclusion criteria for this group were
but not regional myocardial dysfunction. Furthermore,
                                                                               normal echocardiography, electrocardiographic, N-terminal
disadvantages including load and angle dependency and low
                                                                               pro-B-type natriuretic peptide (NT-proBNP), and troponin
reproducibility exist in the measurement of LVEF (4).
                                                                               I results. Exclusion criteria included age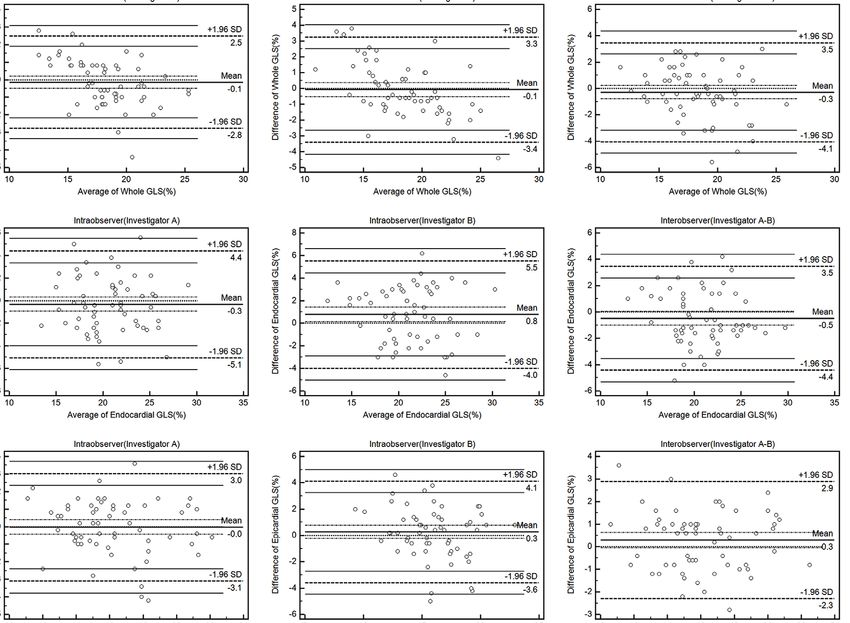
Quantitative Imaging in Medicine and Surgery, Vol 11, No 4 April 2021                                                                                1273

and trans-mitral peak velocity of late diastole, respectively.                 summarized in Table 1. A total of 35 SLE patients with new-
Left ventricular diastolic function was assessed according                     onset disease and 25 healthy controls were enrolled. Stable-
to the 2016 American Society of Echocardiography/                              to-mild disease activity was found in 51% of patients (n=18),
European Association of Cardiovascular Imaging                                 while 40% had moderate disease activity (n=14), and 9%
recommendations (12). In patients with normal LVEF, the                        had high disease activity (n=3). No cardiac symptoms were
four variables for identifying diastolic dysfunction, and                      reported in either SLE patients or controls. All participants
their abnormal cutoff values were the following: septal e’                     had normal serum markers of cardiac injury including
34 mL/m2, and peak TR velocity >2.8 m/sec.                               and troponin I, indicating an absence of clinical evidence of
                                                                               cardiac impairment in the SLE patients.

2D STE assessment
                                                                               Conventional echocardiographic parameters
Two-dimensional STE was performed using a GE VIVID
E95 ultrasound system. Images of the apical four-chamber,                      Conventional echocardiographic results are summarized in
apical two-chamber, apical LV long-axis, and LV short-                         Table 2. All participants had normal LVEF. No significant
axis views at the basal, papillary, and apical levels were                     differences of parameters assessing systolic and diastolic
collected within 3–5 cardiac cycles. The software package                      function including LVEDV, LVESV, LVEDD, LVESD,
EchoPAC (version 201 6.3, GE Vingmed Ultrasound) was                           IVS, PWT, E, A, septal e’, lateral e’, averaged e’, E/e’, TR
used to analyze images. Software tracked the endocardium                       velocity, or LAVI were found between SLE patients and
outline and divided the whole ventricle wall into three                        healthy controls (P>0.05, all).
layers (an endocardial, a mid-myocardial and an epicardial
layer). Quantitative myocardial parameters for the global                      Layer-specific STE characteristics, left ventricular
longitudinal strain (GLS) and global circumference strain                      dyssynchrony index (PSD), and disease parameters in SLE
(GCS) of each layer, and PSD, were obtained. STE data                          patients
analyses were conducted by two investigators (TL and ZW)
who had experience with layer-specific STE and were blind                      The representative images of layer-specific STE’s of
to the clinical data.                                                          one SLE patient and one healthy control are shown in
                                                                               Figures 1 and 2 respectively, and the results of layer-
                                                                               specific STE parameters are displayed in Table 3. Although
Statistical analysis                                                           clinical evidence of cardiac involvement was not detected
Differences and correlations between patients and controls                     in SLE patients through routine assessment, an increase
were analyzed using t-test and Pearson’s correlation analysis,                 in impairment of left ventricular GLS at three layers
respectively, when the data was normally distributed. When                     (whole layer GLS, endocardial GLS, and epicardial GLS)
it was not, the nonparametric Mann-Whitney rank-sum test                       was observed in drug-naïve patients with new-onset SLE,
and Spearman’s correlation analysis were applied. Partial                      compared with controls (P=0.02, 0.01, 0.04, respectively).
                                                                               Elevation of PSD, which reflects left ventricular
correlation analysis and multivariate linear regression
                                                                               dyssynchrony, was also found in SLE patients (P
1274 Luo et al. Layer-specific speckle-tracking scan in SLE patients Table 1 Characteristics of SLE patients and controls Variables SLE (n=35) Healthy controls (n=25) P Female/male 29/6 20/5 0.778 Age (years) 33±6 32±6 0.863 Immune parameters Serum C3, gm/liter 0.62±0.18 1.13±0.08
Quantitative Imaging in Medicine and Surgery, Vol 11, No 4 April 2021 1275
Table 2 Conventional and TDI echocardiographic parameters in SLE patients and controls
Variables SLE (n=35) Healthy controls (n=25) P
LVEDV (mL) 94.4±13.4 92.5±16.8 0.553
LVESV (mL) 39.6±6.4 37.6±7.0 0.337
LVEDD (mm) 45.8±2.5 45.6±3.3 0.838
LVESD (mm) 31.6±1.9 31.4±2.8 0.915
IVS (mm) 9.4±0.8 9.6±0.7 0.340
PWT (mm) 8.9±0.7 9.1±0.9 0.360
E (cm/s) 88.0±11.3 90.2±11.6 0.553
A (cm/s) 59.5±11.3 62.4±9.1 0.162
Septal e’ (cm/s) 10.7±2.0 11.1±1.9 0.429
Lateral e’ (cm/s) 13.5±1.7 13.7±1.7 0.656
Averaged e’ (cm/s) 12.3±1.7 12.2±1.8 0.863
E/e’ 7.2±0.7 7.4±0.7 0.163
TR velocity (m/s) 2.4±0.2 2.3±0.2 0.377
2
LAVI (mL/m ) 25.1±3.8 25.8±3.7 0.479
LVEDV, left ventricular end-diastolic volume; LVESV, left ventricular end-systolic volume; LVEDD, left ventricular end-diastolic diameter;
LVESD, left ventricular end-systolic diameter; IVS, interventricular septum; PWT, posterior wall thickness; E, transmitral peak velocity
of early diastole; A, transmitral peak velocity of late diastole; e’, velocity of early diastole of the mitral annulus; TR velocity, tricuspid
regurgitation velocity; LAVI, left atrial volume index.
higher disease activity or high-risk aPL, but not in those Discussion
with lupus nephritis (Table 4).
In 2016, Ozawa et al. first analyzed the relationship
Correlation analysis showed that endocardial GLS, whole
between layer-specific strain parameters and heart failure
layer GLS, epicardial GLS, and PSD correlated with high-
indicators in 20 systemic autoimmune disorder patients,
sensitivity CRP (hsCRP) levels in SLE patients, but not in
including 7 SLE patients. They found that GCS values,
healthy controls. PSD also correlated with the three layer-
but not GLS in whole, endocardial, or epicardial layers,
specific GLS parameters above (Figure 3). Partial correlation correlated with serum B-type natriuretic peptide (BNP)
analysis showed that PSD correlated with epicardial GLS, levels (13). In addition, GCS in the endocardial layer was
but not with whole layer GLS or endocardial GLS, when significantly positively correlated with LVEF. To the best
treating hsCRP level, renal involvement, aPL profile, and of our knowledge, the present study is the first to examine
disease activity as control variables (Table 5). Multivariate asymptomatic myocardial dysfunction in drug-naïve patients
regression analysis showed that hsCRP level and epicardial with new-onset SLE via a speckle-tracking-based multilayer
GLS are the predictors of layer-specific GLS impairment approach. The main findings are that decreased whole
and PSD change, respectively (Table 6). layer GLS, endocardial GLS, and epicardial GLS could be
found in SLE patients, when compared with age- and sex-
matched healthy individuals. This suggests that subclinical
Intra- and inter-observer variability of GLS
impairment of left ventricular function can occur as early as
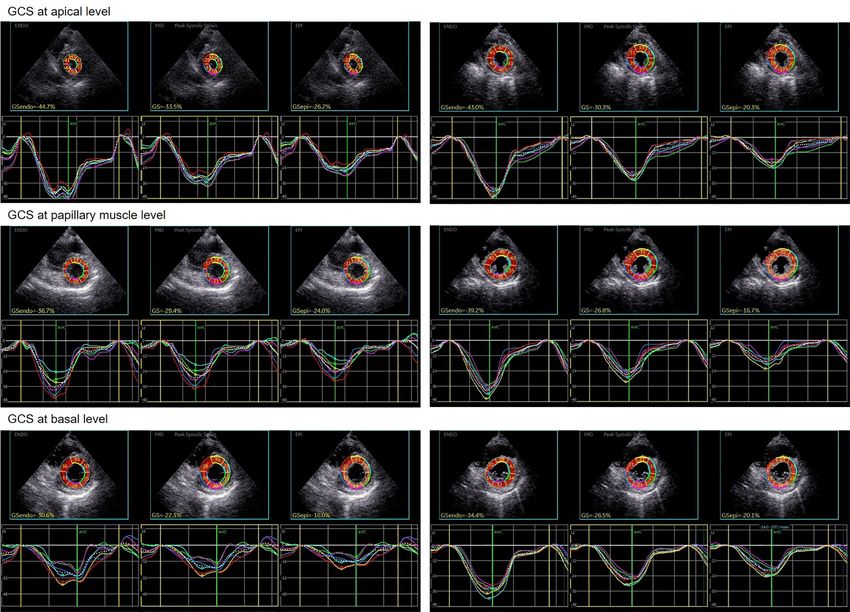
Intra-observer variabilities and inter-observer reliability for the time when SLE is newly diagnosed and LVEF remains
whole GLS, endocardial GLS, and epicardial GLS were preserved.
analyzed by a Bland-Altman plot presented (Figure 4), and Interestingly, SLE patients had impaired myocardial
were all within the limits of agreement. GLS but not GCS. The relationship between LS and CS is
© Quantitative Imaging in Medicine and Surgery. All rights reserved. Quant Imaging Med Surg 2021;11(4):1271-1283 | http://dx.doi.org/10.21037/qims-20-8591276 Luo et al. Layer-specific speckle-tracking scan in SLE patients Apical 4-chamber view Apical 2-chamber view Apical 3-chamber view Figure 1 Typical layer-specific global longitudinal strain (GLS) images of the left ventricle (LV) from a patient with systemic lupus erythematosus (left) and a healthy individual (right). LV GLS was measured from three different views [apical 4 (upper level images)-, 2 (middle level images)-, and 3 (bottom level images)-chamber views]. Measurement of whole layer GLS, endocardial GLS, and epicardial GLS were performed. still not clear. Emerging evidence shows that different roles patients. are played by CS and LS in left ventricular ejection (14), PSD has been proven to be a relatively new and useful with circumferential shortening contributing more to LVEF marker for the early detection of LVMD (17,18). Mounting (14,15). In contrast, patients with impaired longitudinal evidence suggests that LVMD has an independent and shortening constantly have preserved LVEF. This result was incremental negative impact on myocardial mechanics and also consistent with the study by Kraigher-Krainer et al. who remodeling. In the study by Leong et al., left ventricular found that in heart failure with preserved ejection fraction (LV) dyssynchrony was independently associated with (HFpEF), after adjustment for 10 baseline covariates, lower changes in the LVEF over time in idiopathic dilated LS but not CS was associated with higher NT-proBNP, a cardiomyopathy and the occurrence of ventricular prognostically relevant biomarker in HFpEF (16). In our tachycardia after myocardial infarction (19). Fudim et al. study, decreased GLS was found in new-onset SLE patients demonstrated that LV dyssynchrony was strongly associated with normal LVEF, suggesting GLS might be a marker with adverse outcomes among patients with coronary heart for the early detection of myocardial dysfunction in SLE disease (20). In our study, elevation of PSD was detected © Quantitative Imaging in Medicine and Surgery. All rights reserved. Quant Imaging Med Surg 2021;11(4):1271-1283 | http://dx.doi.org/10.21037/qims-20-859
Quantitative Imaging in Medicine and Surgery, Vol 11, No 4 April 2021                                                                                1277

 GCS at apical level

 GCS at papillary muscle level

 GCS at basal level

Figure 2 Representative plot of layer-specific global circumferential strain (GCS) in the left ventricle (LV) of an SLE patient (left)
and a healthy individual (right). LV GCS was measured from three different levels (apical level, papillary muscle level, and basal level).
Measurement of midmyocardium GCS, endocardium GCS, and epicardium GCS were performed.

in drug-naïve SLE patients for the first time, suggesting                      (24-26). Similarly, our results showed that more active
subclinical LVMD in SLE. Moreover, previous studies                            disease, high-risk aPL profile, renal involvement, and
have shown that LVMD was particularly prevalent in                             higher hsCRP level were linked with the tendency towards
patients with microvascular involvement (21), which is                         more severe; 7 impaired GLS parameters and higher PSD
also a characteristic lesion mediated by immune complex                        (although not always with statistical significance). Active
deposition in SLE. Whether or not higher PSD predicts a                        disease is associated with macrophage activation, which
poorer myocardial prognosis in patients with SLE needs to                      enhances the pro-inflammatory process of CVD occurrence
be clarified in further research.                                              in SLE (27). A high-risk aPL profile not only mediates
   Both mouse models and clinical evidence have                                hypercoagulable states and endothelial dysfunction, but
shown that lupus-associated risk factors play key roles                        also exacerbates atherosclerosis inflammation in SLE with
in the pathogenesis of cardiovascular disease (CVD) in                         antiphospholipid syndrome (28). Gustafsson et al. reported
SLE patients (22,23). Disease activity, inflammation,                          that accelerated atherosclerosis in SLE is mainly confined
antiphospholipid antibody, and lupus nephritis are among                       to a subgroup with lupus nephritis (29). The four factors
the most studied SLE-associated cardiovascular risk factors                    above may work alone or coordinate to cause LS and PSD

© Quantitative Imaging in Medicine and Surgery. All rights reserved.   Quant Imaging Med Surg 2021;11(4):1271-1283 | http://dx.doi.org/10.21037/qims-20-859
1278                                                                              Luo et al. Layer-specific speckle-tracking scan in SLE patients

 Table 3 Layer-specific strain data and left ventricular dyssynchrony index parameters in SLE patients and controls
 Variables                                                    SLE                        Healthy controls                               P

 Whole layer GLS (%)                                       −17.6±3.0                        −19.3±2.6                                 0.02

 Endocardial GLS (%)                                       −20.0±3.2                        −22.1±3.0                                 0.01

 Epicardial GLS (%)                                        −15.6±2.7                        −16.8±2.4                                 0.04

 GCS at basal level

   Endocardium (%)                                         −25.6±6.3                        −24.4±6.0                                 0.458

   Mid-myocardium (%)                                      −18.0±4.4                        −16.9±4.5                                 0.376

   Epicardium (%)                                          −12.8±4.0                        −12.2±3.9                                 0.675

 GCS at papillary muscle level

   Endocardium (%)                                         −29.0±5.5                        −27.1±7.0                                 0.239

   Mid-myocardium (%)                                      −20.3±3.9                        −18.3±5.3                                 0.124

   Epicardium (%)                                          −14.2±4.5                        −12.5±4.3                                 0.136

 GCS at apical level

   Endocardium (%)                                         −33.8±5.7                        −32.7±8.4                                 0.605

   Mid-myocardium (%)                                      −23.4±4.9                        −22.5±6.3                                 0.686

   Epicardium (%)                                          −16.0±5.6                        −15.5±5.9                                 0.708

 PSD (msec)                                                41.0±18.9                        28.8±10.1                                 0.007
 STE, speckle-tracking echocardiography; GCS, global circumferential strain; GLS, global longitudinal strain; PSD, peak systolic dispersion.

 Table 4 Layer-specific longitudinal parameters, PSD, and certain disease-related contributors of cardiovascular risk in SLE patients
 Variable                                   Whole layer GLS (%)        Endocardial GLS (%)           Epicardial GLS (%)                PSD (msec)

 Disease activity

   Inactive-to-mild active disease                 −19.3±2.3                −21.8±2.6                     −17.1±2.2                     34.1±16.1

   Moderate-to-severe active                       −15.8±2.5                −18.1±2.8                     −13.9±2.3                     48.2±19.3
   disease

   P
Quantitative Imaging in Medicine and Surgery, Vol 11, No 4 April 2021                                                                                                                                                                                                1279

                    0                                                                     0                                                             100                                  r=0.390                              0

                                                                   Endocardial GLS (%)
                                                    r=0.662                                                                 r=0.637                                                                                                                         r=0.658

                                                                                                                                                                                                            Epicardial GLS (%)
                                                                                                                                                                                             P=0.021
GLS in whole (%)

                                                    P
1280 Luo et al. Layer-specific speckle-tracking scan in SLE patients
Table 6 Multivariate linear regression to analyze predictors of layer-specific GLS parameters and PSD
Unstandardized coefficients Standardized coefficients
Model p
B Std. error Beta t
Whole layer GLS
Constant −21.725 0.815 −26.656Quantitative Imaging in Medicine and Surgery, Vol 11, No 4 April 2021 1281
Intraobserver (investigator A) Intraobserver (investigator B) Intraobserver (investigator A-B)
4 5 6
3 4
Difference of whole GLS (%)
Difference of whole GLS (%)
4
Difference of whole GLS (%)
2 3
2
1 2
1
0
0 0
–1
–1
–2 –2
–2
–3 –3
–4
–4 –4
–5 –5 –6
10 15 20 25 30 10 15 20 25 30 10 15 20 25 30
Average of whole GLS (%) Average of whole GLS (%) Average of whole GLS (%)
Intraobserver (investigator A) Intraobserver (investigator B) Intraobserver (investigator A-B)
6 8 6
Difference of endocardial GLS (%)
Difference of endocardial GLS (%)
Difference of endocardial GLS (%)
4 6 4
2 4
2
0 2
0
–2 0
–2
–4 –2
–6 –4 –4
–8 –6 –6
10 15 20 25 30 35 10 15 20 25 30 35 10 15 20 25 30 35
Average of endocardial GLS (%) Average of endocardial GLS (%) Average of endocardial GLS (%)
Intraobserver (investigator A) Intraobserver (investigator B) Intraobserver (investigator A-B)
4 6 4
Difference of epicardial GLS (%)
Difference of epicardial GLS (%)
Difference of epicardial GLS (%)
3
4 3
2
2
1 2
0 1
0
–1 0
–2 –2
–1
–3
–4 –2
–4
–5 –6 –3
10 12 14 16 18 20 22 24 5 10 15 20 25 10 12 14 16 18 20 22 24
Average of epicardial GLS (%) Average of epicardial GLS (%) Average of epicardial GLS (%)
Figure 4 Bland-Altman analysis of (I) intra-observer reliability for whole global longitudinal strain (GLS), endocardial GLS, and epicardial
GLS of two investigators (left and middle); (II) interobserver reliability of whole GLS, endocardial GLS, and epicardial GLS (right).
Acknowledgments Hospital of Fujian Medical University.
Funding: This work was supported by Key Clinical Specialty
Open Access Statement: This is an Open Access article distributed
Discipline Construction Program of Fujian, China,
in accordance with the Creative Commons Attribution-
Natural Science Foundation of Fujian Province (grant No.
NonCommercial-NoDerivs 4.0 International License (CC BY-
2019J01473) and the Science and Technology Program of NC-ND 4.0), which permits the non-commercial replication
Quanzhou (grant No. 2018N014S, 2017Z009). and distribution of the article with the strict proviso that no
changes or edits are made and the original work is properly
Footnote cited (including links to both the formal publication through the
relevant DOI and the license). See: https://creativecommons.
Conflicts of Interest: All authors have completed the ICMJE org/licenses/by-nc-nd/4.0/.
uniform disclosure form (available at http://dx.doi.
org/10.21037/qims-20-859). The authors have no conflicts
References
of interest to declare.
1. Thomas G, Mancini J, Jourde-Chiche N, Sarlon G, Amoura
Ethical Statement: Written informed consent forms were Z, Harlé JR, Jougla E, Chiche L. Mortality associated
obtained from all individuals included. This study was with systemic lupus erythematosus in France assessed by
approved by the ethics committee of the Second Affiliated multiple-cause-of-death analysis. Arthritis Rheumatol
© Quantitative Imaging in Medicine and Surgery. All rights reserved. Quant Imaging Med Surg 2021;11(4):1271-1283 | http://dx.doi.org/10.21037/qims-20-8591282 Luo et al. Layer-specific speckle-tracking scan in SLE patients
2014;66:2503-11. fraction. Eur J Heart Fail 2017;19:1043-52.
2. Bernatsky S, Boivin JF, Joseph L, Manzi S, Ginzler E, 9. Haugaa KH, Grenne BL, Eek CH, Ersbøll M, Valeur N,
Gladman DD, Urowitz M, Fortin PR, Petri M, Barr S, Svendsen JH, Florian A, Sjøli B, Brunvand H, Køber L,
Gordon C, Bae SC, Isenberg D, Zoma A, Aranow C, Voigt JU, Desmet W, Smiseth OA, Edvardsen T. Strain
Dooley MA, Nived O, Sturfelt G, Steinsson K, Alarcón echocardiography improves risk prediction of ventricular
G, Senécal JL, Zummer M, Hanly J, Ensworth S, Pope arrhythmias after myocardial infarction. JACC Cardiovasc
J, Edworthy S, Rahman A, Sibley J, El-Gabalawy H, Imaging 2013;6:841-50.
McCarthy T, St Pierre Y, Clarke A, Ramsey-Goldman 10. Petri M, Orbai AM, Alarcón GS, Gordon C, Merrill JT,
R. Mortality in systemic lupus erythematosus. Arthritis Fortin PR, Bruce IN, Isenberg D, Wallace DJ, Nived
Rheum 2006;54:2550-7. O, Sturfelt G, Ramsey-Goldman R, Bae SC, Hanly JG,
3. Guo Q, Wu LM, Wang Z, Shen JY, Su X, Wang CQ, Sánchez-Guerrero J, Clarke A, Aranow C, Manzi S,
Gong XR, Yan QR, He Q, Zhang W, Xu JR, Jiang M, Pu Urowitz M, Gladman D, Kalunian K, Costner M, Werth
J. Early Detection of Silent Myocardial Impairment in VP, Zoma A, Bernatsky S, Ruiz-Irastorza G, Khamashta
Drug-Naive Patients With New-Onset Systemic Lupus MA, Jacobsen S, Buyon JP, Maddison P, Dooley MA, van
Erythematosus: A Three-Center Prospective Study. Vollenhoven RF, Ginzler E, Stoll T, Peschken C, Jorizzo
Arthritis Rheumatol 2018;70:2014-24. JL, Callen JP, Lim SS, Fessler BJ, Inanc M, Kamen DL,
4. Mor-Avi V, Lang RM, Badano LP, Belohlavek M, Cardim Rahman A, Steinsson K, Franks AG Jr, Sigler L, Hameed
NM, Derumeaux G, Galderisi M, Marwick T, Nagueh S, Fang H, Pham N, Brey R, Weisman MH, McGwin G
SF, Sengupta PP, Sicari R, Smiseth OA, Smulevitz B, Jr, Magder LS. Derivation and validation of the Systemic
Takeuchi M, Thomas JD, Vannan M, Voigt JU, Zamorano Lupus International Collaborating Clinics Classification
JL. Current and evolving echocardiographic techniques Criteria for systemic lupus erythematosus. Arthritis Rheum
for the quantitative evaluation of cardiac mechanics: ASE/ 2012;64:2677-86.
EAE consensus statement on methodology and indications 11. Tektonidou MG, Andreoli L, Limper M, Amoura Z,
endorsed by the Japanese Society of Echocardiography. Cervera R, Costedoat-Chalumeau N, Cuadrado MJ,
Eur J Echocardiogr 2011;12:167-205. Dörner T, Ferrer-Oliveras R, Hambly K, Khamashta
5. Voigt JU, Pedrizzetti G, Lysyansky P, Marwick TH, MA, King J, Marchiori F, Meroni PL, Mosca M, Pengo
Houle H, Baumann R, Pedri S, Ito Y, Abe Y, Metz S, V, Raio L, Ruiz-Irastorza G, Shoenfeld Y, Stojanovich
Song JH, Hamilton J, Sengupta PP, Kolias TJ, d'Hooge L, Svenungsson E, Wahl D, Tincani A, Ward MM.
J, Aurigemma GP, Thomas JD, Badano LP. Definitions EULAR Recommendations for the Management of
for a common standard for 2D speckle tracking Antiphospholipid Syndrome in Adults. Ann Rheum Dis
echocardiography: consensus document of the EACVI/ 2019;78:1296-304.
ASE/Industry Task Force to standardize deformation 12. Nagueh SF, Smiseth OA, Appleton CP, Byrd BF 3rd,
imaging. J Am Soc Echocardiogr 2015;28:183-93. Dokainish H, Edvardsen T, Flachskampf FA, Gillebert
6. Chu M, Qian L, Zhu M, Yao J, Xu D, Chen M. TC, Klein AL, Lancellotti P, Marino P, Oh JK,
Circumferential strain rate to detect lipopolysaccharide- Popescu BA, Waggoner AD. Recommendations for the
induced cardiac dysfunction: a speckle tracking Evaluation of Left Ventricular Diastolic Function by
echocardiography study. Quant Imaging Med Surg Echocardiography: An Update from the American Society
2019;9:151-9. of Echocardiography and the European Association
7. Sarvari SI, Haugaa KH, Zahid W, Bendz B, Aakhus S, of Cardiovascular Imaging. J Am Soc Echocardiogr
Aaberge L, Edvardsen T. Layer-specific quantification of 2016;29:277-314.
myocardial deformation by strain echocardiography may 13. Ozawa K, Funabashi N, Sugiura A, Kobayashi Y. Layer
reveal significant CAD in patients with non-ST-segment specific strain measurement and its relationship to heart
elevation acute coronary syndrome. JACC Cardiovasc failure indicators in systemic autoimmune disorder
Imaging 2013;6:535-44. patients: A multi-layer transthoracic echocardiography
8. Biering-Sørensen T, Shah SJ, Anand I, Sweitzer N, study. Int J Cardiol 2016;220:693-9.
Claggett B, Liu L, Pitt B, Pfeffer MA, Solomon SD, Shah 14. Carlsson M, Heiberg E, Ostenfeld E, Steding-Ehrenborg
AM. Prognostic importance of left ventricular mechanical K, Kovács SJ, Flachskampf F, Arheden H. Functional
dyssynchrony in heart failure with preserved ejection Contribution of Circumferential Versus Longitudinal
© Quantitative Imaging in Medicine and Surgery. All rights reserved. Quant Imaging Med Surg 2021;11(4):1271-1283 | http://dx.doi.org/10.21037/qims-20-859Quantitative Imaging in Medicine and Surgery, Vol 11, No 4 April 2021 1283
Strain: Different Concepts Suggest Conflicting Results. J Sattler S. Cardiac phenotype in mouse models of systemic
Am Coll Cardiol 2018;71:254-5. autoimmunity. Dis Model Mech 2019;12:dmm036947.
15. Stokke TM, Hasselberg NE, Smedsrud MK, Sarvari SI, 23. Bessant R, Duncan R, Ambler G, Swanton J, Isenberg DA,
Haugaa KH, Smiseth OA, Edvardsen T, Remme EW. Gordon C, Rahman A. Prevalence of Conventional and
Geometry as a Confounder When Assessing Ventricular Lupus-Specific Risk Factors for Cardiovascular Disease
Systolic Function: Comparison Between Ejection Fraction in Patients With Systemic Lupus Erythematosus: A Case-
and Strain. J Am Coll Cardiol 2017;70:942-54. Control Study. Arthritis Rheum 2006;55:892-9.
16. Kraigher-Krainer E, Shah AM, Gupta DK, Santos A, 24. Roman MJ, Crow MK, Lockshin MD, Devereux RB,
Claggett B, Pieske B, Zile MR, Voors AA, Lefkowitz MP, Paget SA, Sammaritano L, Levine DM, Davis A, Salmon
Packer M, McMurray JJ, Solomon SD;PARAMOUNT JE. Rate and determinants of progression of atherosclerosis
Investigators. Impaired systolic function by strain imaging in systemic lupus erythematosus. Arthritis Rheum
in heart failure with preserved ejection fraction. J Am Coll 2007;56:3412-9.
Cardiol 2014;63:447-56. 25. Skaggs BJ, Hahn BH, McMahon M. Accelerated
17. Cianciulli TF, Saccheri MC, Rísolo MA, Lax JA, Méndez atherosclerosis in patients with SLE-mechanisms and
RJ, Morita LA, Beck MA, Kazelián LR. Mechanical management. Nat Rev Rheumatol 2012;8:214-23.
dispersion in Fabry disease assessed with speckle tracking 26. McHugh J. Systemic lupus erythematosus: Atherosclerosis
echocardiography. Echocardiography 2020;37:293-301. confined to patients with nephritis. Nat Rev Rheumatol
18. Lavall D, Kuprat LK, Kandels J, Stöbe S, Hagendorff A, 2017;13:322.
Laufs U. Left ventricular mechanical dispersion in flow- 27. Labonte AC, Kegerreis B, Geraci NS, Bachali P,
gradient patterns of severe aortic stenosis with narrow Madamanchi S, Robl R, Catalina MD, Lipsky PE,
QRS complex. Int J Cardiovasc Imaging 2020;36:605-14. Grammer AC. Identification of alterations in macrophage
19. Leong DP, Hoogslag GE, Piers SR, Höke U, Thijssen J, activation associated with disease activity in systemic lupus
Marsan NA, Schalij MJ, Zeppenfeld K, Bax JJ, Delgado V. erythematosus. PLoS One 2018;13:e0208132.
The relationship between time from myocardial infarction, 28. Benagiano M, Borghi MO, Romagnoli J, Mahler M,
left ventricular dyssynchrony, and the risk for ventricular Bella CD, Grassi A, Capitani N, Emmi G, Troilo A,
arrhythmia: speckle-tracking echocardiographic analysis. J Silvestri E, Emmi L, Alnwaisri H, Bitetti J, Tapinassi
Am Soc Echocardiogr 2015;28:470-7. S, Prisco D, Baldari CT, Meroni PL, D'Elios MM.
20. Fudim M, Fathallah M, Shaw LK, Liu PR, James O, Interleukin-17/Interleukin-21 and Interferon-γ producing
Samad Z, Piccini JP, Hess PL, Borges-Neto S. The T cells specific for β2 Glycoprotein I in atherosclerosis
Prognostic Value of Diastolic and Systolic Mechanical inflammation of systemic lupus erythematosus patients
Left Ventricular Dyssynchrony Among Patients With with antiphospholipid syndrome. Haematologica
Coronary Heart Disease. JACC Cardiovasc Imaging 2019;104:2519-27.
2019;12:1215-26. 29. Gustafsson JT, Herlitz Lindberg M, Gunnarsson I,
21. Chen J, Kalogeropoulos AP, Verdes L, Butler J, Garcia Pettersson S, Elvin K, Öhrvik J, Larsson A, Jensen-
EV. Left-ventricular systolic and diastolic dyssynchrony Urstad K, Svenungsson E. Excess atherosclerosis
as assessed by multi-harmonic phase analysis of gated in systemic lupus erythematosus, -A matter of renal
SPECT myocardial perfusion imaging in patients with involvement: Case control study of 281 SLE patients and
end-stage renal disease and normal LVEF. J Nucl Cardiol 281 individually matched population controls. PLoS One
2011;18:299-308. 2017;12:e0174572.
22. Sanghera C, Wong LM, Panahi M, Sintou A, Hasham M,
Cite this article as: Luo T, Wang Z, Chen Z, Yu E, Fang C.
Layer-specific strain and dyssynchrony index alteration in new-
onset systemic lupus erythematosus patients without cardiac
symptoms. Quant Imaging Med Surg 2021;11(4):1271-1283.
doi: 10.21037/qims-20-859
© Quantitative Imaging in Medicine and Surgery. All rights reserved. Quant Imaging Med Surg 2021;11(4):1271-1283 | http://dx.doi.org/10.21037/qims-20-859You can also read