Predictive Value of the Triglyceride to High-Density Lipoprotein Cholesterol Ratio for All-Cause Mortality and Cardiovascular Death in Diabetic ...
←
→
Page content transcription
If your browser does not render page correctly, please read the page content below
ORIGINAL RESEARCH
                                                                                                                            published: 21 July 2021
                                                                                                                   doi: 10.3389/fcvm.2021.718604

                                            Predictive Value of the Triglyceride to
                                            High-Density Lipoprotein Cholesterol
                                            Ratio for All-Cause Mortality and
                                            Cardiovascular Death in Diabetic
                                            Patients With Coronary Artery
                                            Disease Treated With Statins
                                            Le Wang, Hongliang Cong*, Jingxia Zhang, Yuecheng Hu, Ao Wei, Yingyi Zhang,
                                            Hua Yang, Libin Ren, Wei Qi and Wenyu Li

                                            Department of Cardiology, Tianjin Chest Hospital, Tianjin, China

                          Edited by:
                                            Background and Aims: Studies have highlighted the role of the triglyceride to
                       Hanrui Zhang,        high-density lipoprotein cholesterol (TG/HDL-C) ratio on subsequent cardiovascular
   Columbia University, United States
                                            events. However, the association of the TG/HDL-C ratio with survival outcomes in
                         Reviewed by:
                                            diabetic patients with coronary artery disease (CAD) treated with statins remains
                           Jianting Shi,
    Columbia University, United States      unknown. This study aimed to assess the predictive value of the TG/HDL-C ratio
                           Josep Julve,     for all-cause mortality and cardiovascular death in diabetic patients with CAD treated
 Institut de Recerca de l’Hospital de la
           Santa Creu i Sant Pau, Spain
                                            with statins.
                  *Correspondence:          Methods: The data of patients with type 2 diabetes and angiographically-confirmed
                      Hongliang Cong
                                            CAD who were undergoing statin therapy and visited Tianjin Chest Hospital between
             hongliangcong@126.com
                                            January 2016 and September 2016 were retrospectively collected. The patients were
                    Specialty section:      categorized based on the baseline TG/HDL-C ratio tertile. Kaplan-Meier analysis and
          This article was submitted to     multivariate Cox proportional hazard regression were applied to assess the role of the
     Lipids in Cardiovascular Disease,
                a section of the journal    TG/HDL-C ratio in predicting all-cause mortality and cardiovascular death.
  Frontiers in Cardiovascular Medicine
                                            Results: A total of 2,080 patients were included. During the 4-year follow-up, 209
             Received: 01 June 2021
                                            patients died, 136 of whom from cardiovascular death. The Kaplan-Meier analyses
             Accepted: 29 June 2021
             Published: 21 July 2021        showed that an increased TG/HDL-C ratio was associated with an increased risk of
                              Citation:     all-cause mortality (P < 0.001) and cardiovascular death (P < 0.001). The multivariate
     Wang L, Cong H, Zhang J, Hu Y,         cox hazard regression analysis revealed a similar effect of the TG/HDL-C ratio on the
 Wei A, Zhang Y, Yang H, Ren L, Qi W
   and Li W (2021) Predictive Value of
                                            risk of all-cause mortality (P = 0.046) and cardiovascular death (P = 0.009). The role of
       the Triglyceride to High-Density     the TG/HDL-C ratio in predicting all-cause mortality and cardiovascular death was similar
      Lipoprotein Cholesterol Ratio for
                                            among all subgroups (P > 0.050). For all-cause mortality, the TG/HDL-C ratio significantly
                All-Cause Mortality and
      Cardiovascular Death in Diabetic      improved the C-statistic from 0.799 to 0.812 (P = 0.018), and the net reclassification
Patients With Coronary Artery Disease       index (NRI) and integrated discrimination index (IDI) were 0.252 (95% CI: 0.112–0.392;
                   Treated With Statins.
   Front. Cardiovasc. Med. 8:718604.
                                            P < 0.001) and 0.012 (95% CI: 0.003–0.022; P = 0.012), respectively. Similarly, for
      doi: 10.3389/fcvm.2021.718604         cardiovascular death, the TG/HDL-C ratio significantly improved the C-statistic from

Frontiers in Cardiovascular Medicine | www.frontiersin.org                         1                           July 2021 | Volume 8 | Article 718604
Wang et al.                                                                                                                Predictive Value of TG/HDL-C Ratio

                                            0.771 to 0.804 (P < 0.001), and the NRI and IDI were 0.508 (95% CI: 0.335–0.680;
                                            P < 0.001) and 0.033 (95% CI: 0.015–0.050; P < 0.001).
                                            Conclusion: TG/HDL-C ratio might be useful for predicting all-cause mortality and
                                            cardiovascular death in diabetic patients with CAD treated with statins.

                                            Keywords: triglyceride to high-density lipoprotein cholesterol ratio, type 2 diabetes, coronary artery disease,
                                            statin, all-cause mortality, cardiovascular death

INTRODUCTION                                                                       retrospective cohort study. A total of 2,678 patients with
                                                                                   T2DM and angiographically-confirmed CAD were included.
The role of diabetes mellitus (DM) on subsequent coronary                          CAD comprised stable angina pectoris (SAP) and acute coronary
artery disease (CAD) is well-illustrated (1), and studies have                     syndrome (ACS). ACS included unstable angina pectoris, non-
demonstrated that the use of statins could reduce the risk of                      ST-segment elevation myocardial infarction, and ST-segment
major cardiovascular events (MACEs) in diabetic patients (2–5).                    elevation myocardial infarction (STEMI). Patients were excluded
However, patients with CAD have a higher prevalence of type 2                      if they met any of the following criteria: (1) aged < 18.0 or >80.0
DM, and the risk of mortality remains high even in those treated                   years (n = 72), (2) severe valvular heart disease or congenital
with statins. The residual risk could be attributed to abnormal                    heart disease (n = 34), (3) alanine aminotransferase level >
lipoprotein and lipid levels (6). Therefore, it is necessary that the              3-fold greater than the normal upper limit (n = 15), (4) serum
lipid status be re-evaluated in diabetic patients with CAD treated                 creatinine level > 1.5-fold greater than the normal upper limit
with statins to identify those with higher residual risk such that                 (n = 96), (5) hyperthyroidism or hypothyroidism (n = 16),
tailored risk reduction strategies can be developed.                               (6) incomplete clinical data (n = 75), and (7) not treated with
    Dyslipidemia is characterized by elevated triglyceride (TG)                    statins (n = 99). The remaining 2,271 patients were recruited, and
and reduced dense high-density lipoprotein cholesterol particles                   2,080 patients with full clinical data after 4-year follow-up were
levels, and lower high-density lipoprotein cholesterol (HDL-                       included in the final analysis. The patients were categorized based
C) levels in diabetic patients (7, 8). Elevated TG and lower                       on the tertiles of the baseline TG/HDL-C ratio, as follows: tertile
HDL-C are associated with poor prognosis in diabetic patients                      1 (n = 693, TG/HDL-C ratio ≤ 1.20), tertile 2 (n = 693, 1.20
(9–12), but the use TG or HDL-C alone does not reflect the                         < TG/HDL-C ratio ≤ 1.92), and tertile 3 (n = 694, TG/HDL-C
risk of atherosclerosis and cardiovascular disease (CVD) (13).                     ratio > 1.92). The study was approved by the Ethical Committee
The TG/HDL-C ratio may reflect the actual lipid profiles, and                      of Tianjin Chest Hospital (NO:2021LW-006), and the need to
is considered an important marker of plasma atherosclerosis                        obtain informed consent requirement was waived as the study
(14). Moreover, studies found that the TG/HDL-C ratio was an                       comprised a retrospective analysis of clinical data.
important predictor of insulin resistance and could evaluate the
degree of abnormal glucose metabolism (15–17).
    Numerous studies have reported a positive relationship                         Data Collection and Definitions
between the TG/HDL-C ratio and hypertension (18–20), obesity                       Baseline demographic characteristics, clinical presentation,
(21), metabolic syndrome (22–24), hyperuricemia (25), and non-                     cardiac function, extent of lesion, treatment strategy, laboratory
alcoholic fatty liver disease (26, 27). Moreover, an elevated                      findings at fasting status, and medication data at discharge were
TG/HDL-C ratio plays an important role on heart rate                               collected from medical records and the data managers were
recovery after exercise (28), increased arterial stiffness (29,                    blinded to the study purpose. The demographic characteristics
30) and increased carotid atherosclerosis (31). Studies have                       included age; sex ratio; duration of diabetes; smoker proportion;
indicated that the TG/HDL-C ratio should be considered as an                       hypertension; prior myocardial infarction (MI), percutaneous
important primary prevention cardiovascular risk factor, while                     coronary intervention (PCI), coronary artery bypass graft
the strength of the predictive value differs for patients undergoing               (CABG), or stroke; and body mass index (BMI). The cardiac
various status (32–43). Furthermore, the predictive value of the                   function included left ventricle ejection fraction (LVEF). The
TG/HDL-C ratio for all-cause mortality and cardiovascular death                    clinical presentation included SAP and ACS, and the extent
in diabetic patients with CAD treated with statins is unknown.                     of lesion included left main disease and multi-vessel disease
This retrospective cohort study was therefore performed to assess                  (>2 vessels with ≥50% diameter stenosis in major coronary
the potential role of the TG/HDL-C ratio in the prediction of all-                 arteries). The treatment strategies included medical therapy,
cause mortality and cardiovascular death in diabetic patients with                 PCI, and CABG. Laboratory findings included fasting plasma
CAD who were treated with statins.                                                 glucose (FPG), hemoglobin A1c (HbA1c), total cholesterol
                                                                                   (TC), TG, low-density lipoprotein cholesterol (LDL-C), HDL-C,
                                                                                   the TG/HDL-C ratio, serum uric acid, high-sensitivity C-
METHODS                                                                            reactive protein (hs-CRP), and estimated glomerular filtration
                                                                                   rate (eGFR). The medications at discharge included aspirin,
Study Population                                                                   clopidogrel/ticagrelor, β-blocker, angiotensin II coenzyme
Patients who were admitted to Tianjin Chest Hospital between                       inhibitor (ACEI) or angiotensin II receptor blocker (ARB),
January 2016 and September 2016 were recruited in this                             calcium channel blocker (CCB), nitrate, and insulin.

Frontiers in Cardiovascular Medicine | www.frontiersin.org                     2                                         July 2021 | Volume 8 | Article 718604
Wang et al. Predictive Value of TG/HDL-C Ratio
Endpoints and Follow-Up Data information was collected by telephone or electronic medical
The investigated endpoints included all-cause mortality record review.
and cardiovascular death. All-cause mortality was
defined as death from any cause, and cardiovascular Statistical Analysis
death was defined as death caused by acute MI, heart Continuous variables are presented as the mean [standard
failure, cardiac arrhythmia, or stroke. The follow-up deviation (SD)] and median (interquartile) based on data
TABLE 1 | Baseline characteristics of included patients.
Clinical characteristics Tertile 1 Tertile 2 Tertile 3 P-value
N = 693 N = 693 N = 694
Age, years 66.2 ± 6.7 66.2 ± 6.9 66.1 ± 6.7 0.870
Female 293 (42.3) 302 (43.6) 318 (45.8) 0.405
Duration of diabetes 9.5 ± 7.9 9.8 ± 7.5 9.9 ± 7.7 0.636
Smoker 265 (38.2) 289 (41.7) 267 (38.5) 0.337
Hypertension 529 (76.3) 531 (76.6) 525 (75.6) 0.909
Previous MI 80 (11.5) 86 (12.4) 91 (13.1) 0.674
Previous PCI 153 (22.1) 130 (18.8) 132 (19.0) 0.228
Previous CABG 24 (3.5) 25 (3.6) 32 (4.6) 0.479
Previous stroke 157 (22.7) 143 (20.6) 134 (19.3) 0.303
BMI, kg/m2 25.3 ± 2.9 25.5 ± 2.7 25.7 ± 2.8 0.020
LVEF 58 ± 8 58 ± 9 58 ± 9 0.193
Clinical presentation 0.353
SAP 131 (18.9) 111 (16.0) 118 (17.0)
ACS 562 (81.1) 582 (84.0) 576 (83.0)
Left main disease 69 (10.0) 78 (11.3) 71 (10.2) 0.707
Multi-vessel disease 561 (81.0) 563 (81.2) 570 (82.1) 0.841
Treatment strategy 0.880
MT 219 (31.6) 202 (29.1) 214 (30.8)
PCI 399 (57.6) 410 (59.2) 406 (58.5)
CABG 73 (10.5) 79 (11.4) 73 (10.5)
Laboratory findings
FPG, mmol/L 7.9 ± 2.9 8.0 ± 3.0 8.2 ± 3.3 0.077
HbA1c, % 7.4 ± 1.3 7.5 ± 1.4 7.7 ± 1.6 0.002
TC, mmol/L 4.58 ± 1.16 4.45 ± 1.07 4.31 ± 1.10Wang et al. Predictive Value of TG/HDL-C Ratio
distribution, and the differences among groups were compared TG/HDL-C ratio over the established model (including age,
using an analysis of variance or the Kruskal-Wallis test. duration of diabetes, previous PCI, LVEF, left main disease,
Categorical variables are presented as frequencies and multi-vessel disease, FPG, and eGFR). The optimal cut-off values
proportions, and the differences among groups were compared of the TG/HDL-C ratio for predicting all-cause mortality and
using the Chi-square or Fisher’s exact tests. The association cardiovascular death were determined using receiver operating
between the TG/HDL-C ratio and subsequent all-cause mortality characteristic (ROC) curves. Subgroup analyses for all-cause
and cardiovascular death were assessed using Kaplan-Meier mortality and cardiovascular death were conducted according
analysis and the log-rank test. Multivariate Cox regression to sex (male or female), smoker (yes or no), BMI (≤28 or >28
analysis was performed to identify the independent predictors of kg/m2 ), duration of DM (≤10 or >10 years), ACS (yes or no),
all-cause mortality and cardiovascular death. All the variables in HbA1c (≤7.0 or >7.0%), LDL-C (≤1.8 or >1.8 mmol/L), insulin
Table 1 were listed in univariate model and then were introduced treatment (yes or no), and revascularization (yes or no). The
into the multivariate model if the P-value was 0.050). However, there were significant
differences among the three groups in BMI (P = 0.020), HbA1c
(P = 0.002), TC (P < 0.001), TG (P < 0.001), HDL-C (P <
0.001), TG/HDL-C ratio (P < 0.001), serum uric acid (P < 0.001),
hs-CRP (P < 0.001), and eGFR (P = 0.003).
TG/HDL-C Ratio and All-Cause Mortality
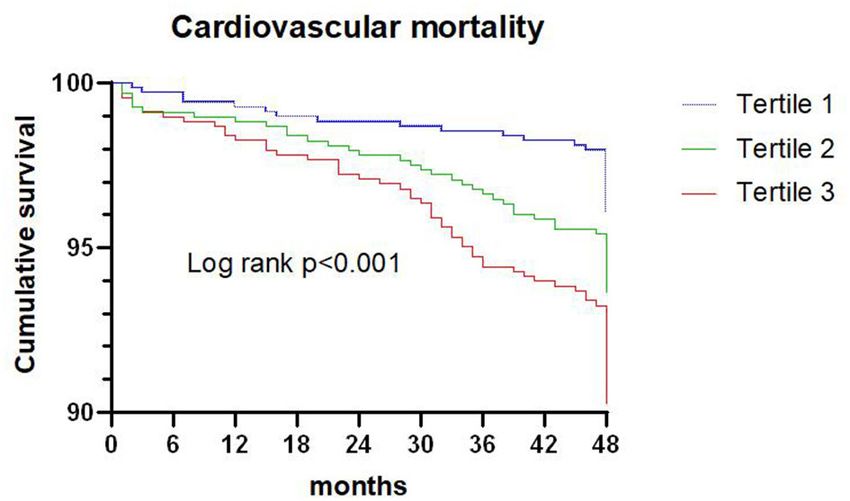
FIGURE 1 | Kaplan-Meier survival curve for all-cause mortality across
triglyceride to high density lipoprotein-C ratio tertiles.
A total of 209 patients died during the 4-year follow-up, and
the proportions of all-cause mortality in tertiles 1, 2, and 3
TABLE 2 | Cox regression models in the prediction of all-cause mortality and cardiovascular death according to the triglyceride to high density lipoprotein-C ratio at
baseline.
Endpoint Events, n/total (%) Crude HR (95% CI) Crude P-value Adjusted HR (95% CI) Adjusted P-value
All-cause mortalityWang et al. Predictive Value of TG/HDL-C Ratio
were 6.6, 10.1, and 13.4%, respectively. Kaplan-Meier analysis under the curve (AUC) was 0.601 (95% CI: 0.561–0.640;
indicated that an increased TG/HDL-C ratio was associated with P < 0.001). Adding the TG/HDL-C ratio to the model of
an increased risk of all-cause mortality (P < 0.001; Figure 1). The established risk factors including age, duration of diabetes,
Cox proportional hazard regression indicated that an increased previous PCI, LVEF, left main disease, multi-vessel disease,
TG/HDL-C ratio tertile was associated with an increased risk FBG, and eGFR improved the prediction of all-cause mortality
of all-cause mortality, irrespective of whether the unadjusted in terms of the C-statistic (from 0.799 to 0.812; P = 0.018),
(P < 0.001) or adjusted (P = 0.046) was used. Moreover, per and the NRI and IDI were 0.252 (95% CI: 0.112–0.392;
SD increment in the TG/HDL-C ratio was associated with an P < 0.001) and 0.012 (95% CI: 0.003–0.022; P = 0.012),
increased risk of all-cause mortality in both the unadjusted model respectively (Table 4).
(HR: 1.17; 95% CI: 1.10–1.24; P < 0.001) and the adjusted The results of subgroup analyses for all-cause mortality
model (HR: 1.20; 95% CI: 1.11–1.30; P < 0.001) (Table 2). The are illustrated in Table 5. An elevated TG/HDL-C ratio was
role of the TG/HDL-C ratio in predicting the risk of all-cause associated with an increased risk of all-cause mortality in all
mortality was robust after sequential adjustment for potential subgroups, and the differences between subgroups were not
confounders (Table 3). significant based on sex (P = 0.985), smoker (P = 0.173), BMI
ROC analysis indicated that the optimal cutoff value of (P = 0.741), duration of DM (P = 0.090), ACS (P = 0.438),
the TG/HDL-C ratio for predicting all-cause mortality was HbA1c (P = 0.524), LDL-C (P = 0.788), insulin treatment (P =
1.77 (sensitivity: 53.1% and specificity: 62.8%), and the area 0.265), and revascularization (P = 0.780).
TABLE 3 | Sensitivity analysis of the association of the triglyceride to high density lipoprotein-C ratio per 1 standard deviation with mortality after separate adjustment for
each of the other significant variables.
Multivariable analysis for all-cause mortality Multivariable analysis for cardiovascular death
Adjustment HR for TG/HDL-C per HR for TG/HDL-C per
Variable 1-SD 95%CI P-value 1-SD 95%CI P-value
Age 1.20 1.13–1.28Wang et al. Predictive Value of TG/HDL-C Ratio
TABLE 5 | All-cause mortality and cardiovascular death in the various patient subgroups.
Variable Subgroups All-cause mortality Cardiovascular death
≤1.77 >1.77 HR (95%CI) P for ≤1.57 >1.57 HR (95%CI) P for
interaction interaction
All patient Total 99/1,274 110/806 1.821 (1.388–2.389) 36/1,083 100/997 3.124 (2.135–4.573)
Sex Women 45/555 47/358 1.661 (1.104–2.500) 0.985 15/462 49/451 3.453 (1.936–6.156) 0.552
Men 54/719 63/448 1.956 (1.360–2.813) 21/621 51/546 2.867 (1.725–4.766)
Smoker No 61/770 57/489 1.498 (1.044–2.150) 0.173 21/646 59/613 3.041 (1.848–5.003) 0.537
Yes 38/504 53/317 2.360 (1.556–3.580) 15/437 41/384 3.262 (1.805–5.893)
BMI (kg/m2 ) ≤28 79/1,058 91/655 1.930 (1.428–2.609) 0.741 33/905 83/808 2.918 (1.949–4.367) 0.285
>28 20/216 19/151 1.409 (0.752–2.640) 3/178 17/189 5.504 (2.613–8.783)
Duration of DM ≤10 53/773 63/491 1.933 (1.341–2.785) 0.090 17/654 62/610 4.052 (2.369–6.929) 0.442
(years) >10 46/501 47/315 1.697 (1.130–2.548) 19/429 38/387 2.291 (1.321–3.973)
ACS No 16/241 15/119 1.973 (0.975–3.990) 0.438 4/241 12/119 6.312 (2.036–9.587) 0.346
Yes 83/1,033 95/687 1.783 (1.328–2.394) 32/842 88/878 2.726 (1.819–4.085)
HbA1c (%) ≤7.0 41/584 46/336 2.016 (1.323–3.071) 0.524 14/499 43/421 3.803 (2.081–6.952) 0.697
>7.0 58/690 64/470 1.682 (1.179–2.400) 22/584 57/576 2.700 (1.651–4.415)
LDL-C (mmol/L) ≤1.8 13/149 16/118 1.608 (0.773–3.343) 0.788 8/136 11/131 3.853 (1.075–13.810) 0.345
>1.8 86/1,125 94/688 1.854 (1.384–2.483) 51/947 89/866 3.064 (2.055–4.568)
Insulin treatment No 51/751 66/492 2.065 (1.433–2.976) 0.265 18/632 61/611 3.616 (2.136–6.112) 0.502
Yes 48/523 44/314 1.566 (1.040–2.357) 18/451 39/386 2.641 (1.511–4.617)
Revascularization No 31/393 35/247 1.876 (1.157–3.042) 0.780 9/327 37/313 4.432 (2.139–9.183) 0.476
Yes 68/881 75/559 1.796 (1.293–2.494) 27/726 63/684 2.673 (1.703–4.195)
BMI, body mass index; DM, diabetes mellitus; ACS, acute coronary syndrome; HbA1c, Hemoglobin A1c; LDL-C, low-density lipoprotein cholesterol; HR, hazard ratio; CI,
confidential interval.
model (P < 0.001) and the adjusted model (P = 0.009).
Furthermore, the risk of cardiovascular death was significantly
increased per SD increment in the TG/HDL-C ratio in both
the unadjusted model (HR: 1.22; 95% CI: 1.16–1.29; P < 0.001)
and the adjusted model (HR: 1.27; 95% CI: 1.19–1.36; P <
0.001) (Table 2). Sensitivity analysis revealed that the association
between the TG/HDL-C ratio and the risk of cardiovascular death
was robust and not altered by sequential adjustment for potential
confounders (Table 3).
ROC analysis indicated that the optimal cutoff value of the
TG/HDL-C ratio for predicting cardiovascular death was 1.57
(sensitivity: 74.3% and specificity: 53.8%), with an AUC of
0.672 (95% CI: 0.625–0.718; P < 0.001). Adding the TG/HDL-
FIGURE 2 | Kaplan-Meier survival curve for cardiovascular death across C ratio to the established model improved the prediction of
triglyceride to high density lipoprotein-C ratio tertiles. cardiovascular death in terms of the C-statistic (from 0.771 to
0.804; P < 0.001), and the NRI and IDI were 0.508 (95% CI:
0.335–0.680; P < 0.001) and 0.033 (95% CI: 0.015–0.050; P <
0.001), respectively (Table 4).
TG/HDL-C Ratio and Cardiovascular Death The results of the subgroup analyses for cardiovascular
A total of 136 patients died from cardiovascular death during the death based on pre-defined variables are shown in Table 5.
4-year follow-up, and the proportion of cardiovascular death in An elevated TG/HDL-C ratio was associated with an
tertiles 1, 2, and 3 were 3.9, 6.2, and 9.5%, respectively. Kaplan- increased risk of cardiovascular death in all subgroups,
Meier analysis suggested that the risk of cardiovascular death was and sex (P = 0.552), smoker (P = 0.537), BMI (P =
significantly increased with an elevated TG/HDL-C ratio (P < 0.285), duration of DM (P = 0.442), ACS (P = 0.346),
0.001; Figure 2). HbA1c (P = 0.697), LDL-C (P = 0.345), insulin treatment
Cox proportional hazard regression indicated that an (P = 0.502), and revascularization (P = 0.476) did not
increased TG/HDL-C ratio tertile was associated with an affect the role of TG/HDL-C ratio in predicting the risk of
increased risk of cardiovascular death in both the unadjusted cardiovascular death.
Frontiers in Cardiovascular Medicine | www.frontiersin.org 6 July 2021 | Volume 8 | Article 718604Wang et al. Predictive Value of TG/HDL-C Ratio
DISCUSSION The Swedish National Diabetes Register found that elevated
TG/HDL-C ratio could increase the risk of CVD independent
This study systematically analyzed the predictive value of of the LDL-C level in obese T2DM patients (56). Yang et al.
the TG/HDL-C ratio for subsequent all-cause mortality and reported that the TG/HDL-C ratio was an important predictor
cardiovascular death in diabetic patients with CAD who of MACEs in patients with diabetes and CAD (42). Contrary
were treated with statins. An elevated TG/HDL-C ratio was to these studies, several other studies did not find significant
associated with an increased risk of all-cause mortality and associations between the TG/HDL-C ratio and the prognosis of
cardiovascular death. Sensitivity analyses indicated that the T2DM. Tohidi et al. demonstrated that the TG/HDL-C ratio
role of TG/HDL-C ratio in predicting subsequent all-cause was not an independent predictor of cardiovascular events in
mortality and cardiovascular death was robust and not altered by diabetic patients without CVD (57). The sub analysis of the
sequential adjusted potential confounders. Furthermore, adding Management of Elevated Cholesterol in the Primary Prevention
the TG/HDL-C ratio to the established model resulted in a Group of Adult Japanese (MEGA) study was not able to
significant enhancement of the predictive value. The risk of establish an independent association between TG/HDL ration
all-cause mortality and cardiovascular death was significantly and CVD risk in patients with DM and without history of
increased when the TG/HDL-C ratio was increased in all CVD (43). The potential reasons for this discrepancy could be
subgroups, and these associations were not affected by sex, the variation in definition of endpoints, patient characteristics
smoker, BMI, duration of DM, ACS, HbA1c, LDL-C, insulin among studies.
treatment, or revascularization. The above results indicate This study is the first to focus on the role of the TG/HDL-C
that the TG/HDL-C ratio is a marker of poor prognosis ratio in the prediction of prognosis in diabetic patients with CAD
even in the era of statin treatment and may contribute who were treated with statins. Compared with previous studies
to the early identification of high-risk diabetic patients and focusing on patients with diabetes or CAD, this large cohort study
CAD. Furthermore, routine TG/HDL-C ratio calculation may included higher risk patients with a higher prevalence of a history
further improve risk stratification for all-cause mortality and of CVD. This study demonstrated that an elevated TG/HDL-
cardiovascular death. C ratio was associated with poor prognosis in diabetic patients
LDL-C plays a key role in the development and progression with CAD treated with statins. Although higher TG/LDL-C
of atherosclerotic CVD (ASCVD) and statins are the first- ratio were relevant for chronic kidney disease (CKD) in patients
line therapy for lowering LDL-C levels to reduce ASCVD with diabetes (58), TG/LDL-C ratio remained a significant and
risk. However, diabetic patients with CAD remain at high independent predictor of all-cause mortality and cardiovascular
cardiovascular risk even after LDL-C reduction, which indicates death after adjustment for potential confounders including renal
that there are residual cardiovascular risk factors other than LDL- function measures (eGFR). This finding suggested that the
C. One study found that diabetic patients treated with statins association between TG/HDL-C ratio and the risk of mortality
had a high prevalence of persistent atherogenic dyslipidemia might not be mediated by the presence of kidney dysfunction.
(13). Elevated TG levels and lower HDL-C levels, as typical These associations were persistent in sensitivity and subgroup
lipid features of diabetes, are considered to indicate atherogenic analyses. An elevated TG/HDL-C ratio was still associated with
dyslipidemia in diabetic patients (44, 45). However, the levels an increased risk of mortality in patients with LDL-C levels of
of TG and HDL-C are mutually independent, and the single ≤1.80 mmol/L, suggesting that the ratio may explain part of the
lipid parameter could not reflect the actual status of plasma residual cardiovascular risk. The use of statins has less impact on
atherogenicity and CVD risk in the absence of insulin resistance the prognostic value of the TG/HDL-C ratio in diabetic patients
(13). Therefore, the TG/HDL-C ratio could reflect TG and with CAD. Several potential mechanisms may account for the
HDL-C simultaneously, and is regarded as a better marker in association of the TG/HDL-C ratio with all-cause mortality
primary and secondary prevention of CVD (34, 36, 46). A and cardiovascular death in diabetic patients with CAD: (1)
study conducted by Edwards et al. suggested that the TG/HDL- an elevated TG level and lower HDL-C plays an important
C ratio has better predictive value for mortality than that of role in endothelial dysfunction and atherosclerosis. Combined
individual lipid parameters (47). Furthermore, a high TG/HDL- TG and HDL-C are significantly related to other atherogenic
C ratio may strongly predict the extent of coronary lesions lipid phenotypes, characterized by higher levels of small dense
(48, 49). Moreover, the TG/HDL-C ratio is significantly related LDL particles along with higher levels of remnant particle
to vulnerable plaque features in diabetic patients treated with cholesterol and non-HDL-C, which contribute to the progression
statins (50). Routine lipid examinations do not reflect the of atherosclerosis (14, 58, 59); (2) the TG/HDL-C ratio is
actual compositional changes of lipid parameters in diabetic significantly related to insulin resistance and glycemic control
patients with CAD. Therefore, evaluation of the TG/HDL-C in diabetic patients (15, 16, 60, 61). Insulin resistance is related
ratio may have great clinical significance with regards to risk to the progression of atherosclerosis, vulnerability of coronary
stratification for diabetic patients with CAD who are treated plaques, and MACEs in patients with CAD (62–64). Moreover,
with statins. a hyperglycemic environment could induce the progression of
Although previous studies have demonstrated the role of the macrovascular and microvascular disease in diabetic patients,
TG/HDL-C ratio in predicting adverse cardiovascular events in including diabetic nephropathy, CAD and peripheral artery
patients with CAD (51–55), the potential role of TG/HDL-C ratio disease, which could cause excess risk of all-cause mortality and
as a prognostic marker for patients with diabetes is still debated. cardiovascular death (65, 66).
Frontiers in Cardiovascular Medicine | www.frontiersin.org 7 July 2021 | Volume 8 | Article 718604Wang et al. Predictive Value of TG/HDL-C Ratio
Additionally, the addition of the TG/HDL-C ratio in the CONCLUSION
risk prediction model for subsequent all-cause mortality and
cardiovascular death was associated with a high predictive An elevated TG/HDL-C ratio was associated with an increased
value. These results suggest that the use of TG/HDL-C ratio risk of all-cause mortality and cardiovascular death in diabetic
could refine risk stratification for all-cause mortality and patients with CAD who were treated with statins. Moreover, the
cardiovascular death in diabetic patients with CAD who addition of the TG/HDL-C ratio into the traditional risk model
are treated with statins. Moreover, this study identified increased the predictive value for subsequent all-cause mortality
the optimal cutoff value of the TG/HDL-C ratio in this and cardiovascular death. Therefore, the TG/HDL-C ratio may be
context, suggesting that the ratio should be maintained a useful marker for evaluating the prognosis in diabetic patients
atWang et al. Predictive Value of TG/HDL-C Ratio
12. Ogita M, Miyauchi K, Miyazaki T, Naito R, Konishi H, Tsuboi S, et al. Low 28. Shishehbor MH, Hoogwerf BJ, Lauer MS. Association of triglyceride-to-HDL
high-density lipoprotein cholesterol is a residual risk factor associated with cholesterol ratio with heart rate recovery. Diabetes Care. (2004) 27:936–
long-term clinical outcomes in diabetic patients with stable coronary artery 41. doi: 10.2337/diacare.27.4.936
disease who achieve optimal control of low-density lipoprotein cholesterol. 29. Chen C, Dai JL. Triglyceride to high-density lipoprotein cholesterol
Heart Vessels. (2014) 29:35–41. doi: 10.1007/s00380-013-0330-5 (HDL-C) ratio and arterial stiffness in Japanese population: a secondary
13. Quispe R, Martin SS, Jones SR. Triglycerides to high-density lipoprotein- analysis based on a cross-sectional study. Lipids Health Dis. (2018)
cholesterol ratio, glycemic control and cardiovascular risk in obese patients 17:130. doi: 10.1186/s12944-018-0776-7
with type 2 diabetes. Curr Opin Endocrinol Diabetes Obes. (2016) 23:150– 30. Chung TH, Shim JY, Kwon YJ, Lee YJ. High triglyceride to high-density
6. doi: 10.1097/MED.0000000000000241 lipoprotein cholesterol ratio and arterial stiffness in postmenopausal Korean
14. Yokoyama K, Tani S, Matsuo R, Matsumoto N. Increased triglyceride/high- women. J Clin Hypertens. (2019) 21:399–404. doi: 10.1111/jch.13484
density lipoprotein cholesterol ratio may be associated with 31. Li X, Deng YP, Yang M, Wu YW, Sun SX, Sun JZ. Triglyceride to high-density
reduction in the low-density lipoprotein particle size: assessment lipoprotein cholesterol ratio and carotid intima-medial thickness in Chinese
of atherosclerotic cardiovascular disease risk. Heart Vessels. (2019) adolescents with newly diagnosed type 2 diabetes mellitus. Pediatr Diabetes.
34:227–36. doi: 10.1007/s00380-018-1247-9 (2016) 17:87–92. doi: 10.1111/pedi.12250
15. Ren X, Chen ZA, Zheng S, Han T, Li Y, Liu W, et al. Association between 32. Turak O, Afşar B, Ozcan F, Öksüz F, Mendi MA, Yayla Ç, et al. The role
triglyceride to HDL-C ratio (TG/HDL-C) and insulin resistance in Chinese of plasma triglyceride/high-density lipoprotein cholesterol ratio to predict
patients with newly diagnosed type 2 diabetes mellitus. PLoS ONE. (2016) new cardiovascular events in essential hypertensive patients. J Clin Hypertens.
11:e0154345. doi: 10.1371/journal.pone.0154345 (2016) 18:772–7. doi: 10.1111/jch.12758
16. Zhou M, Zhu L, Cui X, Feng L, Zhao X, He S, et al. The triglyceride 33. Park JH, Lee J, Ovbiagele B. Nontraditional serum lipid
to high-density lipoprotein cholesterol (TG/HDL-C) ratio as a predictor variables and recurrent stroke risk. Stroke. (2014) 45:3269–
of insulin resistance but not of beta cell function in a Chinese 74. doi: 10.1161/STROKEAHA.114.006827
population with different glucose tolerance status. Lipids Health Dis. (2016) 34. Chen Z, Chen G, Qin H, Cai Z, Huang J, Chen H, et al. Higher triglyceride
15:104. doi: 10.1186/s12944-016-0270-z to high-density lipoprotein cholesterol ratio increases cardiovascular risk: 10-
17. Uruska A, Zozulinska-Ziolkiewicz D, Niedzwiecki P, Pietrzak M, Wierusz- year prospective study in a cohort of Chinese adults. J Diabetes Investig. (2020)
Wysocka B. TG/HDL-C ratio and visceral adiposity index may be useful 11:475–81. doi: 10.1111/jdi.13118
in assessment of insulin resistance in adults with type 1 diabetes in clinical 35. Chang TI, Streja E, Soohoo M, Kim TW, Rhee CM, Kovesdy CP, et al.
practice. J Clin Lipidol. (2018) 12:734–40. doi: 10.1016/j.jacl.2018.01.005 Association of serum triglyceride to HDL cholesterol ratio with all-cause and
18. Liu D, Guan L, Zhao Y, Liu Y, Sun X, Li H, et al. Association of triglycerides to cardiovascular mortality in incident hemodialysis patients. Clin J Am Soc
high-density lipoprotein-cholesterol ratio with risk of incident hypertension. Nephrol. (2017) 12:591–602. doi: 10.2215/CJN.08730816
Hypertens Res. (2020) 43:948–55. doi: 10.1038/s41440-020-0439-8 36. He S, Wang S, Chen X, Jiang L, Peng Y, Li L, et al. Higher ratio of triglyceride
19. Yeom H, Kim HC, Lee JM, Jeon Y, Suh I. Triglyceride to high to high-density lipoprotein cholesterol may predispose to diabetes mellitus:
density lipoprotein cholesterol ratio among adolescents is associated 15-year prospective study in a general population. Metabolism. (2012) 61:30–
with adult hypertension: the Kangwha study. Lipids Health Dis. (2018) 6. doi: 10.1016/j.metabol.2011.05.007
17:212. doi: 10.1186/s12944-018-0861-y 37. Vega GL, Barlow CE, Grundy SM, Leonard D, DeFina LF. Triglyceride-
20. Tohidi M, Hatami M, Hadaegh F, Azizi F. Triglycerides and triglycerides to to-high-density-lipoprotein-cholesterol ratio is an index of heart disease
high-density lipoprotein cholesterol ratio are strong predictors of incident mortality and of incidence of type 2 diabetes mellitus in men. J Investig Med.
hypertension in Middle Eastern women. J Hum Hypertens. (2012) 26:525– (2014) 62:345–9. doi: 10.2310/JIM.0000000000000044
32. doi: 10.1038/jhh.2011.70 38. Chen Z, Hu H, Chen M, Luo X, Yao W, Liang Q, et al. Association of
21. Karelis AD, Pasternyk SM, Messier L, St-Pierre DH, Lavoie JM, Garrel D, et al. triglyceride to high-density lipoprotein cholesterol ratio and incident of
Relationship between insulin sensitivity and the triglyceride-HDL-C ratio in diabetes mellitus: a secondary retrospective analysis based on a Chinese cohort
overweight and obese postmenopausal women: a MONET study. Appl Physiol study. Lipids Health Dis. (2020) 19:33. doi: 10.1186/s12944-020-01213-x
Nutr Metab. (2007) 32:1089–96. doi: 10.1139/H07-095 39. Zheng D, Li H, Ai F, Sun F, Singh M, Cao X, et al. Association
22. Ho CI, Chen JY, Chen SY, Tsai YW, Weng YM, Tsao YC, et al. Relationship between the triglyceride to high-density lipoprotein cholesterol ratio
between TG/HDL-C ratio and metabolic syndrome risk factors with chronic and the risk of type 2 diabetes mellitus among Chinese elderly: the
kidney disease in healthy adult population. Clin Nutr. (2015) 34:874– Beijing longitudinal study of aging. BMJ Open Diabetes Res Care. (2020)
80. doi: 10.1016/j.clnu.2014.09.007 8:e000811. doi: 10.1136/bmjdrc-2019-000811
23. Shin HG, Kim YK, Kim YH, Jung YH, Kang HC. The relationship 40. Cheng C, Liu Y, Sun X, Yin Z, Li H, Zhang M, et al. Dose-response
between the triglyceride to high-density lipoprotein cholesterol association between the triglycerides: high-density lipoprotein cholesterol
ratio and metabolic syndrome. Korean J Fam Med. (2017) ratio and type 2 diabetes mellitus risk: the rural Chinese cohort study
38:352–7. doi: 10.4082/kjfm.2017.38.6.352 and meta-analysis. J Diabetes. (2019) 11:183–92. doi: 10.1111/1753-0407.
24. Aslan Çin NN, Yardimci H, Koç N, Uçaktürk SA, Akçil Ok M. 12836
Triglycerides/high-density lipoprotein cholesterol is a predictor similar to 41. Lee MY, Hsiao PJ, Huang JC, Hsu WH, Chen SC, Chang JM, et al. Associations
the triglyceride-glucose index for the diagnosis of metabolic syndrome between triglyceride/high-density lipoprotein cholesterol ratio and micro-
using international diabetes federation criteria of insulin resistance in obese and macroangiopathies in type 2 diabetes mellitus. Endocr Pract. (2018)
adolescents: a cross-sectional study. J Pediatr Endocrinol Metab. (2020) 24:615–21. doi: 10.4158/EP-2017-0254
33:777–84. doi: 10.1515/jpem-2019-0310 42. Yang SH, Du Y, Li XL, Zhang Y, Li S, Xu RX, et al. Triglyceride to
25. Liu XY, Wu QY, Chen ZH, Yan GY, Lu Y, Dai HJ, et al. Elevated triglyceride high-density lipoprotein cholesterol ratio and cardiovascular events in
to high-density lipoprotein cholesterol (TG/HDL-C) ratio increased risk of diabetics with coronary artery disease. Am J Med Sci. (2017) 354:117–
hyperuricemia: a 4-year cohort study in China. Endocrine. (2020) 68:71– 24. doi: 10.1016/j.amjms.2017.03.032
80. doi: 10.1007/s12020-019-02176-5 43. Sone H, Nakagami T, Nishimura R, Tajima N, MEGA Study Group.
26. Wu KT, Kuo PL, Su SB, Chen YY, Yeh ML, Huang CI, et al. Nonalcoholic Comparison of lipid parameters to predict cardiovascular events in Japanese
fatty liver disease severity is associated with the ratios of total cholesterol mild-to-moderate hypercholesterolemic patients with and without type 2
and triglycerides to high-density lipoprotein cholesterol. J Clin Lipidol. (2016) diabetes: Subanalysis of the MEGA study. Diabetes Res Clin Pract. (2016)
10:420–5.e1. doi: 10.1016/j.jacl.2015.12.026 113:14–22. doi: 10.1016/j.diabres.2015.12.002
27. Fan N, Peng L, Xia Z, Zhang L, Song Z, Wang Y, et al. Triglycerides to 44. Miller M, Cannon CP, Murphy SA, Qin J, Ray KK, Braunwald E, et al. Impact
high-density lipoprotein cholesterol ratio as a surrogate for nonalcoholic of triglyceride levels beyond low-density lipoprotein cholesterol after acute
fatty liver disease: a cross-sectional study. Lipids Health Dis. (2019) coronary syndrome in the PROVE IT-TIMI 22 trial. J Am Coll Cardiol. (2008)
18:39. doi: 10.1186/s12944-019-0986-7 51:724–30. doi: 10.1016/j.jacc.2007.10.038
Frontiers in Cardiovascular Medicine | www.frontiersin.org 9 July 2021 | Volume 8 | Article 718604Wang et al. Predictive Value of TG/HDL-C Ratio
45. Bos G, Dekker JM, Nijpels G, de Vegt F, Diamant M, Stehouwer CD, et al. 57. Tohidi M, Hatami M, Hadaegh F, Safarkhani M, Harati H, Azizi F. Lipid
A combination of high concentrations of serum triglyceride and non-high- measures for prediction of incident cardiovascular disease in diabetic and
density-lipoprotein-cholesterol is a risk factor for cardiovascular disease in non-diabetic adults: results of the 8.6 years follow-up of a population
subjects with abnormal glucose metabolism–The Hoorn Study. Diabetologia. based cohort study. Lipids Health Dis. (2010) 9:6. doi: 10.1186/1476-
(2003) 46:910–6. doi: 10.1007/s00125-003-1141-5 511X-9-6
46. Matsumoto I, Misaki A, Kurozumi M, Nanba T, Takagi Y. Impact 58. Tsuruya K, Yoshida H, Nagata M, Kitazono T, Hirakata H, Iseki K, et al.
of nonfasting triglycerides/high-density lipoprotein cholesterol ratio on Association of the triglycerides to high-density lipoprotein cholesterol ratio
secondary prevention in patients treated with statins. J Cardiol. (2018) 71:10– with the risk of chronic kidney disease: analysis in a large Japanese population.
5. doi: 10.1016/j.jjcc.2017.07.012 Atherosclerosis. (2014) 233:260–7. doi: 10.1016/j.atherosclerosis.2013.12.037
47. Edwards MK, Blaha MJ, Loprinzi PD. Atherogenic index of 59. Moriyama K. The association between the triglyceride to high-density
plasma and triglyceride/high-density lipoprotein cholesterol ratio lipoprotein cholesterol ratio and low-density lipoprotein subclasses. Intern
predict mortality risk better than individual cholesterol risk Med. (2020) 59:2661–9. doi: 10.2169/internalmedicine.4954-20
factors, among an older adult population. Mayo Clin Proc. (2017) 60. Quispe R, Manalac RJ, Faridi KF, Blaha MJ, Toth PP, Kulkarni KR,
92:680–1. doi: 10.1016/j.mayocp.2016.12.018 et al. Relationship of the triglyceride to high-density lipoprotein cholesterol
48. da Luz PL, Favarato D, Faria-Neto JR Jr, Lemos P, Chagas AC. High ratio of (TG/HDL-C) ratio to the remainder of the lipid profile: the very large
triglycerides to HDL-cholesterol predicts extensive coronary disease. Clinics. database of lipids-4 (VLDL-4) study. Atherosclerosis. (2015) 242:243–
(2008) 63:427–32. doi: 10.1590/S1807-59322008000400003 50. doi: 10.1016/j.atherosclerosis.2015.06.057
49. Yunke Z, Guoping L, Zhenyue C. Triglyceride-to-HDL cholesterol ratio. 61. Zonszein J, Lombardero M, Ismail-Beigi F, Palumbo P, Foucher S,
Predictive value for CHD severity and new-onset heart failure. Herz. (2014) Groenewoud Y, et al. Triglyceride high-density lipoprotein ratios predict
39:105–10. doi: 10.1007/s00059-013-3788-0 glycemia-lowering in response to insulin sensitizing drugs in type 2
50. Takata K, Kataoka Y, Andrews J, Puri R, Hammadah M, Duggal B, et al. diabetes: a post hoc analysis of the BARI 2D. J Diabetes Res. (2015)
Triglyceride-to-high-density lipoprotein cholesterol ratio and vulnerable 2015:129891. doi: 10.1155/2015/129891
plaque features with statin therapy in diabetic patients with coronary artery 62. An X, Yu D, Zhang R, Zhu J, Du R, Shi Y, et al. Insulin resistance
disease: frequency-domain optical coherence tomography analysis. JACC predicts progression of de novo atherosclerotic plaques in patients with
Cardiovasc Imaging. (2018) 11:1721–3. doi: 10.1016/j.jcmg.2018.02.017 coronary heart disease: a one-year follow-up study. Cardiovasc Diabetol.
51. Wan K, Zhao J, Huang H, Zhang Q, Chen X, Zeng Z, et al. The association (2012) 11:71. doi: 10.1186/1475-2840-11-71
between triglyceride/high-density lipoprotein cholesterol ratio and all-cause 63. Nishimura M, Tokoro T, Nishida M, Hashimoto T, Kobayashi H, Yamazaki
mortality in acute coronary syndrome after coronary revascularization. PLoS S, et al. Association of insulin resistance with de novo coronary stenosis after
ONE. (2015) 10:e0123521. doi: 10.1371/journal.pone.0123521 percutaneous coronary artery intervention in hemodialysis patients. Nephron
52. Dai XY, Zheng YY, Tang JN, Yang XM, Guo QQ, Zhang JC, et al. Clin Pract. (2008) 109:c9–17. doi: 10.1159/000132391
Triglyceride to high-density lipoprotein cholesterol ratio as a predictor of 64. Iguchi T, Hasegawa T, Otsuka K, Matsumoto K, Yamazaki T, Nishimura S, et al.
long-term mortality in patients with coronary artery disease after undergoing Insulin resistance is associated with coronary plaque vulnerability: insight
percutaneous coronary intervention: a retrospective cohort study. Lipids from optical coherence tomography analysis. Eur Heart J Cardiovasc Imaging.
Health Dis. (2019) 18:210. doi: 10.1186/s12944-019-1152-y (2014) 15:284–91. doi: 10.1093/ehjci/jet158
53. Sultani R, Tong DC, Peverelle M, Lee YS, Baradi A, Wilson AM. Elevated 65. Sowers JR, Stump CS. Insights into the biology of diabetic
triglycerides to high-density lipoprotein cholesterol (TG/HDL-C) ratio vascular disease: what’s new? Am J Hypertens. (2004)
predicts long-term mortality in high-risk patients. Heart Lung Circ. (2020) 17:2S−6S. doi: 10.1016/j.amjhyper.2004.08.007
29:414–21. doi: 10.1016/j.hlc.2019.03.019 66. Wolf G. New insights into the pathophysiology of diabetic nephropathy: from
54. Bittner V, Johnson BD, Zineh I, Rogers WJ, Vido D, Marroquin OC, et al. haemodynamics to molecular pathology. Eur J Clin Invest. (2004) 34:785–
The triglyceride/high-density lipoprotein cholesterol ratio predicts all-cause 96. doi: 10.1111/j.1365-2362.2004.01429.x
mortality in women with suspected myocardial ischemia: a report from the
women’s ischemia syndrome evaluation (WISE). Am Heart J. (2009) 157:548– Conflict of Interest: The authors declare that the research was conducted in the
55. doi: 10.1016/j.ahj.2008.11.014 absence of any commercial or financial relationships that could be construed as a
55. Prasad M, Sara J, Widmer RJ, Lennon R, Lerman LO, Lerman A. Triglyceride potential conflict of interest.
and triglyceride/ HDL (high density lipoprotein) ratio predict major adverse
cardiovascular outcomes in women with non-obstructive coronary artery Copyright © 2021 Wang, Cong, Zhang, Hu, Wei, Zhang, Yang, Ren, Qi and Li.
disease. J Am Heart Assoc. (2019) 8:e009442. doi: 10.1161/JAHA.118.009442 This is an open-access article distributed under the terms of the Creative Commons
56. Eeg-Olofsson K, Gudbjörnsdottir S, Eliasson B, Zethelius B, Cederholm J; Attribution License (CC BY). The use, distribution or reproduction in other forums
NDR. The triglycerides-to-HDL-cholesterol ratio and cardiovascular disease is permitted, provided the original author(s) and the copyright owner(s) are credited
risk in obese patients with type 2 diabetes: an observational study from the and that the original publication in this journal is cited, in accordance with accepted
Swedish National Diabetes Register (NDR). Diabetes Res Clin Pract. (2014) academic practice. No use, distribution or reproduction is permitted which does not
106:136–44. doi: 10.1016/j.diabres.2014.07.010 comply with these terms.
Frontiers in Cardiovascular Medicine | www.frontiersin.org 10 July 2021 | Volume 8 | Article 718604You can also read