D2.4 Environmental monitoring baseline report - PowerKite project
←
→
Page content transcription
If your browser does not render page correctly, please read the page content below
Ref. Ares(2016)5651620 - 29/09/2016
Power Take-Off System for a Subsea Tidal Kite
D2.4
Environmental monitoring
baseline report
Deliverable Lead Beneficiary Type Dissemination Due Delivery
number level date date
D2.4 QUB Other PU M9
Editor Louise Kregting
Authors Pal Schmitt
Ross Culloch
Lilian Lieber
Powerkite Horizon 2020/RIA Contract number: 654438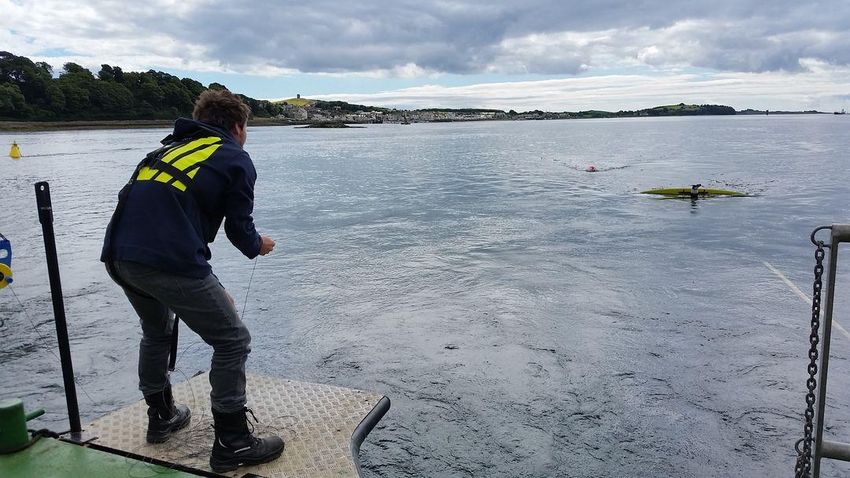
D2.4 Environmental monitoring baseline report
Document history
Kregting, Version Author Beneficiary Date Comment
Louise
1 Kregting, Louise QUB 2016-09-16 Draft
2 Kregting, Louise QUB 2016-09-26 Final
1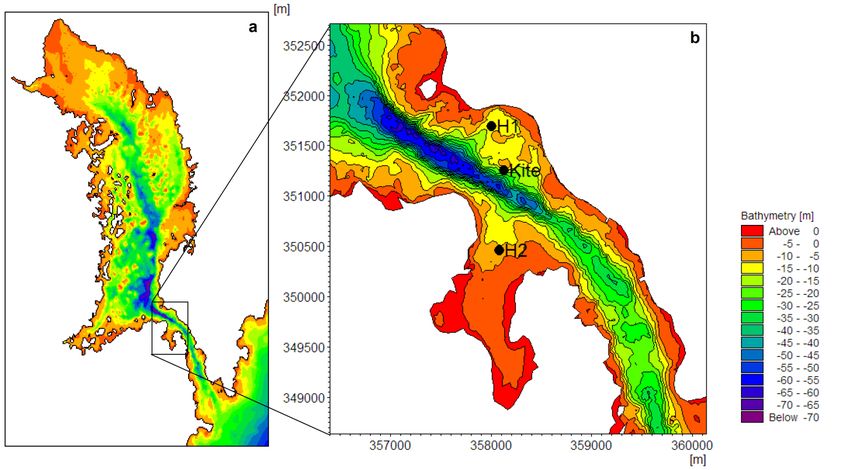
D2.4 Environmental monitoring baseline report
Content
DOCUMENT HISTORY ...........................................................................................................................................................1
CONTENT..............................................................................................................................................................................2
INTERNAL APPROVAL ...........................................................................................................................................................3
ABBREVIATIONS/ACRONYMS ...............................................................................................................................................4
1. EXECUTIVE SUMMARY .................................................................................................................................................5
2. BACKGROUND AND SCOPE .......................................................................................................................................6
3. COLLECTION OF ENVIRONMENTAL DATA ................................................................................................................7
3.1 NOISE MEASUREMENTS......................................................................................................................................7
3.1.1 ENVIRONMENTAL AMBIENT NOISE ..............................................................................................................7
3.1.2 PTO NOISE ...................................................................................................................................................9
3.2 COLLISION RISK MODEL ................................................................................................................................. 10
3.2.1 HAZARD ZONE 4D MODEL ...................................................................................................................... 11
3.2.2 MODEL COMPONENTS .............................................................................................................................. 12
3.3 BENTHIC SURVEY ........................................................................................................................................... 13
4. REFERENCES .............................................................................................................................................................. 15
2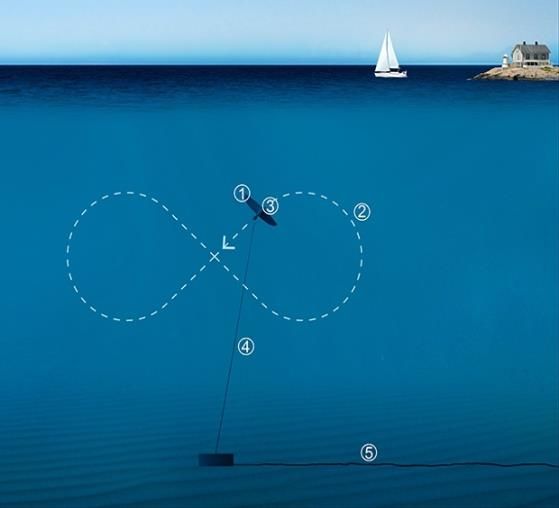
D2.4 Environmental monitoring baseline report
Internal Approval
Coordinator signature
Digitally signed by Salomonsson,
Salomonsson, Per
DN: cn=Salomonsson, Per,
Per ou=Common
Date: 2016.09.28 18:45:54 +02'00'
Name Company Date
Reviewer signature
Louise Kregting Queen's University Belfast 28/09/2016
Name Company Date
3
D2.4 Environmental monitoring baseline report Abbreviations/Acronyms CRM Collision Risk Model HZ4DM Hazard Zone 4 Dimensional Model MMO Marine Mammal Observer MRE Marine Renewable Energy PTO Power Take-Off QUB Queen’s University Belfast TEC Tidal Energy Converter 4

D2.4 Environmental monitoring baseline report 1. Executive summary This report is a deliverable of the Powerkite project, a Horizon 2020 project funded by the European Union’s Horizon 2020 research and innovation programme. The Powerkite project will design, build and deploy a power take-off system (PTO) for the novel tidal energy concept, Deep Green referred to in this document as the ‘kite’. The environmental monitoring baseline report describes the progress in obtaining the environmental data, up to month 9 (M9) for deliverable D2.4, Environmental monitoring baseline report. The report details information on the noise data collected to date, the progress of the CRM and the benthic survey. This is a progress report (M9) with an interim report (M24) and final environmental impact report to be completed in M30 with the achievements from WP2 and WP6. 5
D2.4 Environmental monitoring baseline report
2. Background and scope
While there is understandably a great concern of the environmental impacts of tidal energy converters on
marine life, there are in fact very few field observations of interactions between marine animals and these
devices. This data gap is reflected in the fact that very few operational turbines are in existence. The few field-
based quantitative studies available on collision risk have been on fish and have been for fixed horizontal axis
turbines that were either limited or not in operation at the time of the observations (Broadhurst & Barr 2011,
Hammar et al. 2013). The kite tidal energy converter quarter-scale prototype power plant in Strangford Lough,
Northern Ireland and the full scale device in Holyhead Wales, to be deployed in 2017, will provide us with
environmental data from both scales in order to make important predictions on the environmental risk that
energy devices pose on the environment.
This project therefore provides a unique opportunity to gather and analyse data from a working prototype tidal
energy converter (TEC) in realistic flow environments and to identify the issues and problems associated with
collecting data in these physically challenging environments. Monitoring the noise of TECs and obtaining a
better understanding of the collision risk posed to marine animals such as basking sharks, marine turtles or
teleost fish with tidal turbine devices is considered one of the key challenges when determining the potential
environmental impacts of marine renewable devices. The challenges arise owing to a highly dynamic
environment in terms of high flow velocities, turbulence as a result of the fast flow velocities, and generally low
visibility.
Unlike other horizontal axis turbines, the entire kite is ‘dynamic’ as the only static component of the device is
the mooring located close to the seabed with the tether and kite continuously moving (Fig. 1a & b). Any work
that is carried out therefore needs to consider the movement of the entire structure which occupies a volume
of water considerably larger than horizontal axis turbines.
The overall objective of the environmental work package is to assess the environmental interactions of the kite.
The aim of this report is to outline the progress of the environmental data gathered up to M9.
a b
Figure 1. The components of the kite (a) and the figure of eight track of the kite underwater(b).
6 D2.4 Environmental monitoring baseline report
3. Collection of environmental data
This section focuses on the collection of environmental data in order to assess the kite’s influence of, and the
interaction with, the marine environment. The particular aspects of the environment that the first nine months
have focused on include: noise and collision risk of animals with the device. Determining the influence of the
kite on benthic communities within the vicinity of the operational area will also be discussed.
3.1 Noise measurements
Two separate noise studies have been carried out in order to meet the deliverable aims of D2.10a, collection
of noise data, of the Powerkite project. The first study investigates the background (ambient) noise in the
environment to provide a baseline to determine the natural variability of noise in an operational flow
environment. The second study has been carried out to understand the noise emitted by the PTO system in
operation.
3.1.1 Environmental ambient noise
As pointed out in Annex IV (Copping et al. 2016), understanding sound in high tidal flow environments has
been poorly studied. This reflects the difficulty in trying to measure the noise in this highly energetic
environment owing to the added complexity of noise generated from the turbulence advected over the
hydrophones (often referred to as pseudo-noise), with no suitable solution found to date.
Noise in the marine environment in general is a result of numerous physical, biological and anthropogenic
sources such as turbulence, sediment and boulder movement, marine organisms and boat traffic. The physical
and biological ‘noises’ may be termed ambient noise which is classified as broadband as it is composed of a
range of frequencies over the entire frequency spectrum. The Strangford Narrows (Fig. 2) reaches velocities in
excess of 3.5 m/s (Kregting & Elsaesser 2014) with visible turbulence during ebb and flood tides, and has a
highly spatially heterogeneous flow regime (Savidge et al. 2014). The Narrows is therefore presumed to be a
biologically noisy environment; however, this is something that we still need to quantify.
Narrows
Narrows
Figure 2. Map of Strangford Lough, Northern Ireland (a) and locations of hydrophone deployments, H1 and H2
(b) located near the main channel of the Narrows and in the vicinity of the kite.
7 D2.4 Environmental monitoring baseline report In order to measure ambient noise of the Narrows in the vicinity of the kite, two calibrated high frequency soundtraps hydrophones (ST 300 HF, Ocean Instruments) were deployed for a two week period (18th to 29th July 2016), each with an acoustic doppler current profiler (2 MHz Nortek Aquadopp® Profiler) (Fig. 2) to record noise (hydrophone) and flow velocity (Aquadopp) simultaneously to establish the correlation between flow rate and noise. The locations were selected based on depth (between 10 – 15 m) and flow velocities, which were extracted from the Strangford Lough model (Kregting & Elsaesser 2014). The prior stipulation was that maximal velocity did not exceed 0.4 m/s during spring tide, so as to reduce noise over the hydrophones, but that the sites were as close to the main channel of the Narrows as possible. Based on bathymetry and flow velocity data, H1 and H2 were chosen for the deployment of the hydrophones (Fig. 2). The deployment of the instruments at the two locations will be replicated in February 2017 in order to capture the seasonal variation between summer and winter ambient and anthropogenic noise in the Strangford Narrows. It is expected that biological activity from animals such as fish and shrimps will be maximal in summer, and minimal in winter, when animals migrate to the Irish Sea outside of the Lough. The same principle is applied to boating activity which is high in the summertime and low in the winter. Figure 3. Frame with 2 MHz Aquadopp (Nortek) and hydrophone deployed at H1 (Fig. 1b) Analysis of the ambient noise measurement data is ongoing and it is anticipated that the winter sampling will be carried out without any problems. Problems with data collection anticipated: There are no foreseeable problems anticipated with collection of ambient noise measurements in winter 2017 or the analysis of the noise data which is to be presented in WP6. 8
D2.4 Environmental monitoring baseline report
3.1.2 PTO noise
During the same timeframe as the deployment of the underwater hydrophones (18th to 29th July 2016),
intensive acoustic monitoring of the kite was carried out. A calibrated hydrophone (SoundTrap 300 STD,
Ocean Instruments) was used for the following measurements. The hydrophone was connected to a leaded 2m
rope that was suspended from a surface buoy, in order to carry out drift profiles.
Sound measurement sampling profiles included:
Drifts throughout the channel with no device (control)
Drifts over the kite flying from the testing platform
Drifts over the kite flying from the seabed
For the control drifts, the hydrophone was placed into the main channel near the location of the kite (Fig. 2b)
and allowed to drift for approximately 2 km with the currents on both, the ebb and flood tides. This was to (i)
assess the ambient noise (ii) assess the audibility of the Strangford ferry (which operates daily between 7:30 to
22:45 crossing the Narrows between Portaferry and Strangford every 15 min approximately 2 km from the
kite). Preliminary analysis of the noise data indicates that during the ebb tide when Minesto is testing the kite,
the ferry noise is not detectable at the location of the kite.
During the kite trials mounted from the testing platform, the hydrophone was placed into the water and
allowed to drift 50 m with the current flow from the testing platform (Fig. 4). This method of deployment was
repeated at different locations across the width of the testing platform to get noise measurements off to the
side of the kite as well as directly above it to allow a controlled positioning of the hydrophone in the proximity
of the kite. In order to assess the noise radiation of the kite during the testing platform mounted kite trials,
drift measurements were collected beginning approximately 1 km upstream of the kite, letting the hydrophone
drift past the testing platform before collecting the hydrophone 1 km downstream of the kite. To determine
distances that the hydrophone travelled, Global Positioning System (GPS) readings were noted at the start,
during, and at the end of each drift.
Figure 4. Hydrophone deployed from the testing platform.
9 D2.4 Environmental monitoring baseline report Similar to the testing platform mounted kite trials, when the kite was being flown from the seafloor, the hydrophone measurement began approximately 1 km upstream of the device and was collected approximately 1 km downstream of the device. Hydrophone positions were again noted using a GPS. Each kite trial is never the same owing to changes in factors such as flight path settings, turbine PTO system as well as flow velocities continually changing. Therefore, data from Minesto on the flow velocities and the kite configuration during the noise measurement will be used to assess the noise emitted by the PTO system and how this may change under different environmental conditions and with the different configurations of the PTO system. Analysis of the PTO noise data is ongoing, as it progresses, it will provide information to Minesto on the noise levels of the device in comparison with the environment and how the noise propagates during the operation of the kite. Problems with data collection anticipated: There are no foreseeable problems anticipated with analysis of the noise data collected; these will be presented in WP6. 3.2 Collision risk model Possibly the greatest concern regarding the infrastructure of tidal MRE devices in the environment is the collision risk with an animal and, as a consequence, this is a primary concern for consenting, permitting and licensing of tidal developments (Copping et al. 2016). While there have been no known collisions observed or recorded with the few prototypes currently in existence, there is still a great uncertainty (Hutchison & Copping, 2016). This uncertainty is primarily due to the limitation in research on collision owing to the few working MRE devices in existence or because the device is shutdown during operation if a ‘target’ is observed within the vicinity of the device, as was the case for SeaGen (Royal Haskoning 2012) and is the case for the kite in Strangford Lough under the current license. The concern of an animal colliding with the kite is paramount in Strangford Lough, which is a Special Area of Conservation, with harbour seals (Phoca vitulina) listed as a qualifying feature. Currently, to meet the environmental requirements for field testing the kite in Strangford Lough, Minesto must carry out marine mammal observations (MMO: marine mammal observer) whilst the kite is operational. This is costly and it is widely acknowledged that MMOs can only observe animals that are close to or at the surface. While direct observations of animal movements and behaviour in the vicinity of devices is considered the best method to evaluate the risk (ABPmer 2010), the highly turbid waters make visual observations under the water logistically impossible. Consequently, in an effort to quantify the probability of collision risk in such a challenging environment, the use of CRMs has become commonplace. In order to inform the CRM, a variety of components are required, including: population dynamics, animal movement and specific information on the tidal device (e.g. rotor swept area, rotational speed). The more information used and the more accurate that information is, the better the model will be at predicting collision risk. This section focuses on the development of the CRM for the kite, up to M9, in order to meet the aims of the deliverable D2.10b, data collection from collision risk model, of the Powerkite project. The model will be based on the one developed by Hammar et al. (2015) which is a generic fault tree based probabilistic model using the harbour seal as the test case. 10
D2.4 Environmental monitoring baseline report 3.2.1 Hazard zone 4D model CRMs for standard horizontal axis tidal turbines are often based on simplified representations in a two dimensional domain covering the swept area. However, the equivalent model for a subsea kite must take into account the complex interaction between the kite and animal motion in time and space. This has been the starting point for the CRM. A fully three dimensional, transient model of the kite and animal shape has been developed in freeCAD, an open-source CAD engine. The kite follows a prescribed motion similar to Figure 1and objects representing the fauna to be investigated can be released at predefined positions upstream. Simulations are then run and collisions between the kite, tether and animal are recorded (Fig. 5). By varying numerous parameters like animal size, initial position, shape, kite speed and flight trajectory the probability of a collision can be assessed. This has been termed the Hazard Zone 4D Model, as the model also incorporates time. Figure 5. Starting point of the kite and animal of interest on the left, then the figure of 8 of the flight path and, in this instance, the graphic shows the point of collision between the kite and animal on the right. The principal purpose of the HZ4DM is to provide probabilities of collision across a range of realistic scenarios. In order to achieve this, we will use published information and existing data on harbour seal behaviour and ecology, such as seal length, swim speed and dive profile. This information will be used to simulate realistic data distributions that will be passed to the HZ4DM; for example, from published studies we know that harbor seals spend less time in the mid-section of the water column (Figure 6). Therefore, the probability of collision is not uniform across water depth; this will be factored in to the HZ4DM. Using these simulated data sets, we will run a large number of iterations to obtain confidence intervals for collision. Subsequently, the probability distributions obtained from the HZ4DM will feed into the CRM and, as the Powerkite project begins to gather site specific data, the HZ4DM will be updated to better inform the CRM. Initial validation tests of the HZ4DM were successful and work is now underway to integrate statistical pre- and post-processing tools. A suitable number of iterations per scenario will be identified prior to running the final HZ4DM toolbox on High Performance Computing environments. 11
D2.4 Environmental monitoring baseline report
Harbour seal dive profile
50
40
Time Spent (Sec)
30
20
10
0
0 5 10 15 20
Water Depth (m)
Figure 6. Simulated harbour seal dive profile for Strangford Lough. Several studies have shown that harbour
seals have a ‘U’ shaped dive profile (Wood et al., 2016; Zydlewski et al., 2016), spending more time closer to
the surface and the sea floor. At the test site in Strangford Lough, the water depth is ca. 20 m.
3.2.2 Model components
Where published studies are extremely useful for providing general aspects of harbour seal ecology and
behaviour, some aspects of the model will benefit greatly from site specific information. In particular,
information on the population dynamics (e.g. numbers, birth rates) is extremely important for informing the
CRM and when extrapolating the model output to the population-level. For example, should the CRM suggest
that one seal per year collides with the device, we need to be able to assess whether or not this will be
detrimental to the population.
The National Trust (UK Conservation Charity) and the Department of Agriculture, Environment and Rural
Affairs (DAERA) of Northern Ireland have conducted seal counts at 26 haul out sites within Strangford Lough
at regular (typically monthly) intervals since 1992. These data include targeted counts during the harbour seal
breeding season and moulting period. Consequently, these data will be extremely valuable for quantifying
several aspects of the population dynamics in relation to the input and output of the CRM. As such, we are
currently working with the National Trust (who, since 2016, are now solely responsible for the seal counts
within Strangford Lough), with the aim of incorporating these data into the final CRM.
A further component required for the CRM that is ongoing will be the use of sonar to collect real-time data on
the fine-scale behaviour of animals around the kite to assess animal-kite interactions. The tender process is still
ongoing.
Problems with data collection anticipated: While some of the data required for the CRM is available, the
movement of animals near the device can only be provided by sonar technology. This will become an issue if
the sonar is not procured in the coming months.
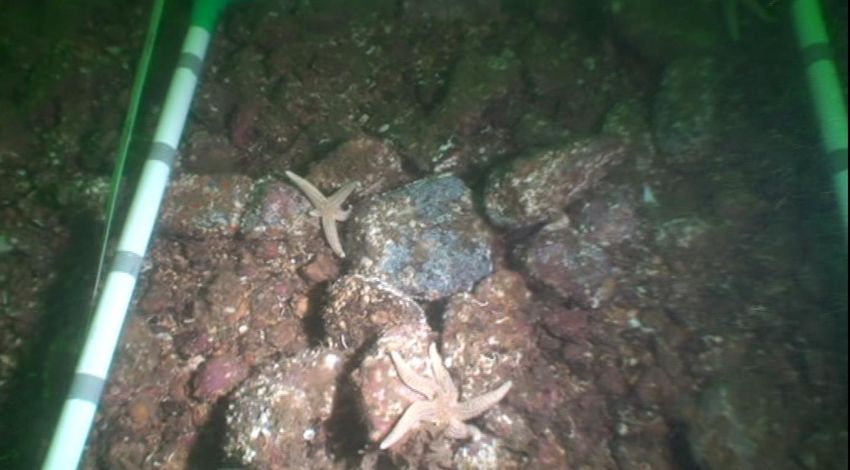
12 D2.4 Environmental monitoring baseline report 3.3 Benthic Survey The influence of the installation and operation of the kite on benthic communities is unknown. Questions remain on the impact of factors such as continual localised noise and changes in flow velocities on the benthic fauna within the vicinity of the device. A recent study by Kregting et al. (2016) suggests that an array of tidal devices is unlikely to have an influence on benthic communities as a result of the physical changes in flow velocities. Benthic surveys of SeaGen before and during operation also suggest that there was little influence of SeaGen on the benthic communities except at the installation phase of the quadraopiles (Savidge et al. 2014). Whether these results are similar for the kite is the focus of deliverable D2.10c, subtidal survey. Prior to the installation operations of the kite in 2013, a benthic survey was undertaken in order to assess the ecological composition of the proposed site. Three sites were surveyed during July and August 2012 from which one was chosen for the testing of the kite (Fig. 7). It is proposed to revisit these sites again in order to assess if any changes have taken place during the years of operation. Owing to seasonal changes in benthic communities i.e summer opportunistic species, it is best to carry out the survey during the same months as the initial survey. Due to prior commitments and noise work, the benthic subtidal surveys were not carried out during July and August 2016. These will now be carried out during July and August 2017 and will not affect the planned deliverable in M24. Figure 7. Snapshot of benthic sampling survey site I 2012. Problems with data collection anticipated: Clarification on whether surface supply diving or scuba is ongoing, but regardless, no problems in data collection are anticipated. 13
D2.4 Environmental monitoring baseline report
Information on EU funding / Disclaimer
This project has received funding from the European Union’s Horizon 2020 research and
innovation programme under grant agreement No 654438.
The content of this report reflects only the author’s view and the Agency is not
responsible for any use that may be made of the information it contains.
14 D2.4 Environmental monitoring baseline report 4. References ABPmer (ABP Marine Environmental Research Ltd). 2010. Collision Risk of Fish with Wave and Tidal Devices. Commissioned by RPS Group plc on behalf of the Welsh Assembly Government, R/3836/01. Published by ABP Marine Environmental Research Ltd, Southampton, UK. Pp. 106. Broadhurst M, Barr S. 2011. Short Term Temporal Behavioural Responses in Pollack, Pollachius pollachius to Marine Tidal Turbine Devices; a Combined Video and ADCP Doppler Approach. Paper Presented at the European Wave and Tidal Energy Conference, Southampton, United Kingdom. Copping A, Sather N, Hanna L, Whiting J, Zydlewski G, Staines G, Gill A, Hutchison I, O’Hagan A, Simas T, Bald J, Sparling C, Wood J and Masden E. 2016. Annex IV 2016 State of the Science Report: Environmental Effects of Marine Renewable Energy Development around the World. Hammar L, Andersson S, Eggertsen L, Haglund J, Gullström M, et al. 2013. Hydrokinetic Turbine Effects on Fish Swimming Behaviour. PLoS ONE 8(12): e84141. doi:10.1371/journal.pone.0084141 Hammar L, Eggertsen L, Andersson S, Ehnberg J, Arvidsson R, Gullström M, et al. 2015. A Probabilistic Model for Hydrokinetic Turbine Collision Risks: Exploring Impacts on Fish. PLoS ONE 10(3): e0117756. doi:10.1371/journal.pone.0117756 Hutchison I, Copping A. 2016. A Coordinated Action Plan for Addressing Collision Risk for Marine Mammals and Tidal Turbines. http://tethys.pnnl.gov/events/annex-iv-workshop- collision-risk-marine-mammals-and- tidal-turbines Kregting L, Elsaesser B. 2014. A hydrodynamic modelling framework for Strangford Lough Part 1: Tidal Model. Journal of Marine Science and Engineering. 2:46-65. Kregting L, Elsaesser B, Kennedy R, Smyth D, O’Carroll J, Savidge G. (2016). Do Changes in Current Flow as a Result of Arrays of Tidal Turbines Have an Effect on Benthic Communities? PLoS ONE 11(8): e0161279. doi:10.1371/journal.pone.0161279 Royal Haskoning. 2012. SeaGen Environmental Monitoring Programme Final Report. Ref. 9S8562/R/303719/Edin. http://seageneration.co.uk/files/SeaGen-Environmental-Monitoring-Pro- gramme- Final-Report.pdf Savidge G, Ainsworth D, Bearhop S, Christen N, Elsäßer B, Fortune F, et al. 2014. Strangford Lough and the SeaGen tidal turbine. In: Shields MA, Payne AIL, editors. Marine Renewable Energy Technology and Environmental Interactions, Humanity and the Sea. pp. 153-172. Wood J, Joy R, Sparling C. (2016). Harbor Seal - Tidal Turbine Collision Risk Models. An Assessment of Sensitivities. Report by SMRU Consulting. pp 57 Zydlewski, Staines, Sparling, Madsen & Wood (2016) Chapter 3: Collision risk for animals around tidal turbines. In: Copping A, Sather N, Hanna L, Whiting J, Zydlewski G, Staines G, Gill A, Hutchison I, O’Hagan A, Simas T, Bald J, Sparling C, Wood J, Masden E. 2016. Annex IV 2016 State of the Science Report: Environmental Effects of Marine Renewable Energy Development around the World. 15
You can also read