False Alarm Reduction in Self-Care by Personalized Automatic Detection of ECG Electrode Cable Interchanges
←
→
Page content transcription
If your browser does not render page correctly, please read the page content below
Hindawi
International Journal of Telemedicine and Applications
Volume 2020, Article ID 9175673, 8 pages
https://doi.org/10.1155/2020/9175673

Research Article
False Alarm Reduction in Self-Care by Personalized Automatic
Detection of ECG Electrode Cable Interchanges

          Jocelyne Fayn              and Paul Rubel
           SFR Santé Lyon-Est: eTechSanté, INSERM US7, Université de Lyon, Lyon 69372, France

          Correspondence should be addressed to Jocelyne Fayn; jocelyne.fayn@inserm.fr

          Received 7 June 2019; Accepted 30 August 2019; Published 27 January 2020

          Academic Editor: Velio Macellari

          Copyright © 2020 Jocelyne Fayn and Paul Rubel. This is an open access article distributed under the Creative Commons Attribution
          License, which permits unrestricted use, distribution, and reproduction in any medium, provided the original work is properly
          cited.

          Introduction. False alarm reduction is an important challenge in self-care, whereas one of the most important false alarm causes in
          the cardiology domain is electrodes misplacements in ECG recordings, the main investigations to perform for early and pervasive
          detection of cardiovascular diseases. In this context, we present and assess a new method for electrode reversals identification for
          Mason-Likar based 3D ECG recording systems which are especially convenient to use in self-care and allow to achieve, as previously
          reported, high computerized ischemia detection accuracy. Methods. We mathematically simulate the effect of the six pairwise
          reversals of the LA, RA, LL, and C2 electrodes on the three ECG leads I, II, and V2. Our approach then consists in performing
          serial comparisons of the newly recorded 3D ECG and of the six derived ECGs simulating an electrode reversal with a standard,
          12-lead reference ECG by means of the CAVIAR software. We further use a scoring method to compare these analysis results and
          then apply a decision tree model to extract the most relevant measurements in a learning set of 121 patients recorded in ICU.
          Results. The comparison of the seven sets of serial analysis results from the learning set resulted in the determination of a composite
          criteria involving four measurements of spatial orientation changes of QRS and T and providing a reversal identification accuracy
          of 100%. Almost the same results, with 99.99% of sensitivity and 100% of specificity, were obtained in two test sets from 90 patients,
          composed of 2098 and 2036 representative ECG beats respectively recorded during PTCA balloon inflation, a procedure which
          mimics ischemia, and before PTCA for control. Conclusion. Personalized automatic detection of ECG electrode cable interchanges
          can reach almost the maximal accuracy of 100% in self-care, and can be performed in almost real time.

1. Introduction                                                           PEM for personal ECG monitor, which is endowed with
                                                                          self-adaptive embedded intelligence, mobile health record
According to the World Health Organization, ischemic heart                management support on smart-media card, embedded web
disease is still the leading cause of death in the world [1], and         server, and wireless communication. The EPI-MEDICS solu-
the electrocardiogram, which can be easily recorded anywhere,             tion, which stands for Enhanced Personal, Intelligent, and
at any time, and at low cost, remains the main source of infor-           Mobile system for Early Detection and Interpretation of
mation for the early detection of myocardial ischemia or                  Cardiac Syndromes, provides ambient intelligent and perva-
infarction [2]. Prehospital ECGs are highly recommended to                sive computing services for a reliable detection of life-threat-
reduce the time to diagnosis and treatment, and it is further             ening myocardial ischemia and arrhythmia, and alarms
advised to perform serial computer-assisted ECG recordings                management [4]. Only four active electrodes, that are easy to
to improve the detection of dynamic ECG changes [2]. With                 set-up on the thorax by the patients themselves, are needed to
the development of pHealth and mHealth strategies, various                retrieve the spatiotemporal information of the electrical activ-
smart ECG devices solutions have been proposed for the per-               ity of the heart, which is necessary and sufficient for accurate
vasive detection of cardiac events from the first symptoms.                ischemia detection [5, 6]. These electrodes are LA (left arm),
The personal self-care system we designed and developed at                RA (right arm), and LL (left leg) or LF (left foot), also called
the beginning of the 2000’s [3], allows any citizen to record             as L, R and F, which are placed in the Mason-Likar position,
high quality ECGs on demand with a portable device, called                and the precordial C2, yielding for a pseudo-orthogonal 3D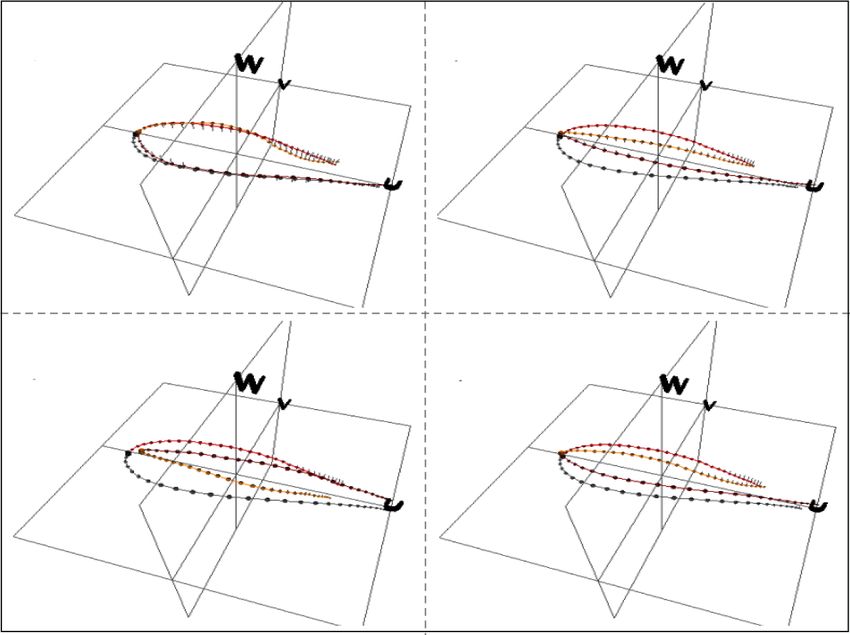
2                                                                        International Journal of Telemedicine and Applications

ECG (I, II, V2). We demonstrated that a diagnostic accuracy         store in the ECG device both a standard 12-lead ECG as well
of 98%, with 98% of sensitivity and specificity, can be obtained     as a 3D reference ECG, recorded at some minutes or hours of
for ischemia detection by using these three standard ECG            interval, to which any new ECG will be compared for the
leads, thus exceeding by 23% the performance of the standard        detection of serial ECG changes, as recommended by the inter-
ECG criteria [6].                                                   national societies in cardiology. The reference ECGs should
     The main problem to solve at present in self-care is to        be validated by a physician.
reduce the number of false alarms which may be caused by                In this paper, we mathematically simulate all the six pos-
ECG electrode cables reversals. The incidence of the electrode      sible pairwise electrode reversals on the 3D ECGs, including
cables misplacements on the diagnosis accuracy and the              the interchanges between limb and precordial leads, with the
importance of their automatic detection have been largely           challenge of finding, in a learning set, powerful detection cri-
reported, even for ECGs recorded at the hospital [7–11]. All        teria for self-care situations, which are then assessed in two
these authors highlight the increasing number of medical            independent test sets.
errors which are responsible for deaths, in particular in the
US, ECG cable reversal being one prevalent reason. Incorrect
                                                                    2. Materials and Methods
electrode configurations can simulate rhythm or conduction
disturbances, myocardial ischemia or infarction [11]. Bond et       2.1. Study Populations. Three data sets were considered. The
al. demonstrated that the clinical diagnosis is affected in          learning set is composed of 170 pairs of rest ECGs of 10 s
17–24% of patients, and STEMI diagnosis is missed in 11%            duration, a standard 12-lead ECG and a 3D ECG, recorded on
[9]. Nilsson et al. found that the incidence of reversals for       121 patients admitted in the ICU of the Lyon Cardiovascular
ECGs in the emergency department was twice that of those            Hospital, France. All pairs were recorded the same day,
obtained within the hospital [10]. They have also shown that        except for one pair which was recorded at 6 days interval.
the most common reversal is of the right and left arm electrode     The acquisition time difference of the 169 pairs of ECGs is in
cables. Various methods of detection have been published.           average 40 min 28 s with a standard deviation of 30 min 50 s
Hedén et al. developed an artificial neural network for the          (Min: 2 min 9 s, Max: 1 hour 16 min 29 s). 97 pairs of ECGs
recognition of right/left arm lead reversal, which is known to      have been recorded by one technician and the other 73 pairs by
be the easiest to detect. They obtain a high specificity of about    another technician. The 121 patients are composed of 83 men
99.9%, and a sensitivity of 98.7% [12]. Kors and van Herpen         and 38 women, aged of 61 years in average with a standard
obtained similar results for the RA-LA and RA-LL reversals          deviation of 15 years (Min: 18, Max: 87), and were admitted
by using the correlation between recorded and reconstructed         for coronary heart diseases and/or arrhythmias. The 12-lead
ECG leads, but only a sensitivity of 17.9% for the LA-LL inter-     ECGs were acquired with a legacy electrocardiograph, and
change [13]. Han et al. have shown that the same algorithm          the 3D ECGs with our PEM device, both at a sampling rate of
based on a decision tree classifier may be used for conventional     500 samples/s with an amplitude resolution of 5 µV. Written
and Mason-Likar electrode placements [14]. They obtained a          informed consent was obtained from each patient.
sensitivity of 91.3% and 72.8% for respectively the LA-RA and            The two test sets respectively called C and I are continuous
RA-LL reversals with a specificity of 97.9% and 97.5% for con-       12-lead ECG recordings performed in 90 coronary patients
ventional ECGs, versus 88.9% and 75.9% of sensitivity with          who underwent elective percutaneous transluminal coronary
96.5% and 98.5% of specificity for Mason-Likar ECGs. Using           angioplasty (PTCA) at the Charleston Area Medical Center,
linear support vector machine, these authors found a sensi-         WV. The ECGs were recorded during balloon inflation that
tivity and a specificity of 56.5% and 99.9% for detecting seven      mimics myocardial ischemia (test set I), and before PTCA in
precordial cable interchanges (V1-V2, V1–V3, V2-V3, V3-V4,          the catheterization laboratory for control (test set C), within
V4-V5, V4–V6, and V5-V6), and respectively 93.8% and                the framework of the STAFF Studies Investigations approved
99.9% for limb cable interchanges, but they did not consider        by the Investigational Review Board. Informed consent was
the LA-LL interchange which requires serial ECGs in their           obtained from each subject. We already described this data-
opinion [15]. Jekova et al. considered in their study, based on     base [5, 6] which includes four locations of balloon inflation:
interlead correlation, four LA, RA and LL reversals (RA-LA,         left anterior descending coronary artery (LAD) for 31 patients,
LL-RA, clockwise and counter-clockwise), and the 15 pairwise        left circumflex coronary artery (LCX) for 15 patients, left main
precordial leads [16]. Their results in three test sets vary from   coronary artery (LM) for 2 patients and right coronary artery
91.7% to 97.6% of sensitivity and from 99.2% to 99.7% of spec-      (RCA) for 42 patients. The duration of the control recordings
ificity for RA-LA and LL-RA interchanges. We found no stud-          was 5–10 min, and the mean duration of the balloon inflation
ies involving reversals between the limb leads and the              was 4 min 28 s (SD: 1 min 15 s), resulting in more than 2000,
precordial leads.                                                   10 s duration ECG recordings per test set.
     The aim of this paper is to present a new method able to
automatically detect a possible electrodes reversal during an       2.2. Simulation of Electrode Cables Reversals. We
ECG recording, intended, in case of the occurrence of changes       mathematically simulated all six possible pairwise electrodes
of the recorded ECG in comparison with a previously recorded        reversals of the four considered electrodes: LA, RA, LL, and
reference ECG which is stored in the personal device, to rec-       C2 (for V2) by using the standard equations defining the ECG
ommend in real time to the user of the device to check if there     leads, according to the Einthoven triangle (Figure 1). Let us
                                                                                                                              ∗    ∗
is any electrode cable interchange for the detected electrode       call I, II, III, and V2 the original recorded leads, and I , II ,
                                                                       ∗           ∗
pair(s). The concept of the EPI-MEDICS solution is indeed to        III , and V2 the modified ECG leads, after having applied the
International Journal of Telemedicine and Applications 3
RA LA
2I − II VC + VR + VF
I Thus: V2∗ = VW + ( )−( )
3 3
(16)
V2 2I − II
WT = −( ) + 4( ).
II III 3 9
2.2.5. RA and C2 Electrodes Reversal
2I − II
I∗ = VL − VC = ( ) − V2, (17)
3
LF or LL
Figure 1: The Einthoven triangle with the schematic representation 2II − I
of the Wilson central terminal. II∗ = VF − VC = ( ) − V2, (18)
3
specified electrode cables pair reversal. Let us also denote VL, VC + VL + VF
VR, VF, VC, and VW the unipolar potentials of the exploring VW∗ = , (19)
3
electrodes LA, RA, LL, C2, and of the Wilson central terminal
WT for writing simplification. These potentials are defined Thus : V2∗ = VR − VW∗
as follows: I + II VC + VL + VF (20)
= VW − ( )−( ).
3 3
2I − II
VL = VW + ( ), (1) By replacing VC by (VW + V2) and (VL + VF/3) by
3
(VW − (VR/3)), we obtain:
I + II −V2 I + II
VR = VW − ( ), (2) V2∗ = ( ) − 4( ). (21)
3 3 9
2II − I 2.2.6. LL and C2 Electrodes Reversal
VF = VW + ( ), (3)
3 I∗ = I, (22)
VC = VW + V2, (4) I + II
II∗ = VC − VR = V2 + ( ), (23)
3
VL + VR + VF
VW = . (5)
3 VC + VR + VL
VW∗ = , (24)
2.2.1. LA and RA Electrodes Reversal 3
I∗ = −I, (6) −V2 (2VF − VL − VR)
Thus : V2∗ = VF − VW∗ = ( )+4
3 9
II∗ = III = II − I. (7) V2 (−I + 2II)
= −( ) + 4 . (25)
2.2.2. LA and LL Electrodes Reversal 3 9
I∗ = II, (8) 2.3. ECG Analysis. Our reasoning is the following: each
time a 3D ECG is recorded in self-care, all potential reversal
II∗ = I. (9) simulations shall be performed in almost real time. If the 3D
2.2.3. RA and LL Electrodes Reversal ECG has been correctly recorded, the serial ECG changes
between the simulated 3D ECGs and the standard reference
I∗ = −III = I − II, (10) ECG, called Δs, should be greater than the ECG changes
between the recorded 3D ECG and the standard reference ECG,
II∗ = −II. (11) called Δ푟. We thus perform a serial ECG analysis between the
2.2.4. LA and C2 Electrodes Reversal standard 12-lead reference ECG of each patient and seven 3D
ECGs, the recorded one and the 3D ECGs which are derived by
I + II applying the mathematical transformations defined in Section
I∗ = VC − VR = VW + V2 − VR = V2 + ( ), (12)
3 2.2 and respectively simulating the six pairwise electrode
cables reversals, for each of the three datasets.
II∗ = II, (13) For the learning set, 7 × 170 ECG comparisons were per-
formed. The standard 12-lead ECGs were pre-processed with
VC + VR + VF median beat computation and ECG waves delineation by
VW∗ = , (14) means of the manufacturer specific software of the ECG acqui-
3
sition system, and the 3D ECGs were preprocessed and a typ-
V2∗ = VL − VW∗ , (15) ical beat was delineated by the Lyon program [17] which is4 International Journal of Telemedicine and Applications
Table 1: Percentage of correct classifications for each pairwise electrode cables reversal simulation and for each individual measurement in
the learning set and in the two test sets, to be compared with the 100% or almost 100% accuracy obtained in the 3 datasets when combining
the 4 measurements as described in the section results.
Test set 1—control recordings Test set 2—during inflation
Measurement/electrode Learning set (푁 = 170)
(푁 = 2036) (푁 = 2098)
reversal
OCQ OCI OCR TPPAD OCQ OCI OCR TPPAD OCQ OCI OCR TPPAD
LA–RA 94.1 95.3 85.3 79.4 100.0 98.6 94.9 91.3 98.5 97.1 77.2 80.0
LA–LL 74.7 76.5 75.9 80.6 96.4 94.6 95.7 93.4 75.5 81.6 66.2 84.9
RA–LL 91.2 96.5 87.1 72.9 99.0 98.0 97.2 88.6 95.4 96.2 83.9 71.5
LA–C2 92.9 92.9 91.8 92.4 98.7 98.3 98.9 95.5 95.0 95.6 84.9 88.3
RA–C2 91.2 97.6 91.8 90.6 97.8 98.6 98.0 95.6 85.3 94.0 86.1 87.8
LL–C2 96.5 93.5 91.2 78.2 97.6 95.4 95.4 94.6 90.9 91.9 77.5 84.4
embedded in the PEM devices. The two acquiring devices 2.5. Statistical Analysis. Sensitivity, representing the percentage
being compliant with the SCP-ECG standard communication of correct detection of electrode cables reversals, is computed
protocol, ECG signal data, metadata and analysis results viz in test set I by comparing the values Δ푟 with the values Δ푠 for
beat typification, wave delineation and global measurements each of the six interchange simulations. Indeed, the study of
data were retrieved as SCP-ECG files [18, 19]. Serial analyses sensitivity supposes that the considered ECGs are not correctly
have thus been performed between the reference median beats recorded, which we simulate by applying the six different
of the standard 12-lead ECGs and the typical beats of the 3D reversal transformations. Then, by reapplying the same lead
ECGs. transformations on these ECGs, we get the original, recorded
Concerning the test sets C and I, the continuous control ECGs which are supposed to be correctly acquired in our study
and during inflation recordings were split into successive, 10 material as they have been checked by a cardiologist at the time
s duration ECG sequences which were then preprocessed and of recording. The cable reversal functions we describe in this
analyzed by the Lyon program, and encoded in the SCP-ECG paper are mathematically defined as involutions. Specificity
format. A serial beat-to-beat analysis was next performed for is figured out in test set C by comparing the values Δ푠 with
each patient between a typical beat from the control recording the values Δ푟 and then by computing the percentage of serial
that was selected as the reference beat, and all the other typical comparisons for which the reversal detection criteria classifies
beats from the control recording and from the recording which the original, recorded ECGs as correct.
has been acquired during balloon inflation. Thus, a total of
2036 serial beat-to-beat comparisons were performed on test
set C (control recordings) and 2098 on test set I (recordings
3. Results
performed during inflation and showing ischemia changes Four CAVIAR measurements occurred to be the most relevant
induced by angioplasty) for the 90 patients. This serial pro- for any pairwise electrode reversals detection in the learning
cessing was again repeated for the six reversal simulations. set. These serial measurements between the standard reference
Serial ECG analysis was performed with our CAVIAR ECG and the 3D ECG are the orientation changes of the QRS
program [5, 6] which is now available on-line at the following (OCQ) and repolarization (OCR) waves, the orientation
address: http://fr-ecg.univ-lyon1.fr/ [20]. The CAVIAR soft- changes of the initial part of QRS (OCI) and the angular devi-
ware performs an optimal spatiotemporal comparison of two ation of the preferential plane of the terminal part of QRS
median or typical ECG beats. For this study, we only analyzed (TPPAD). The orientation changes (OC) are measured by the
the three leads I, II, and V2 for all the ECGs of our study spatial angular deviation of the center of gravity of the con-
populations in order to compare the same leads of the stand- sidered wave or part of the wave. The initial and terminal parts
ard ECGs and of the 3D ECGs. For serial ECG processing, we of QRS correspond to about the first and last 30 ms of the QRS
are using –V2/2 as third axis in order to get an almost ortho- wave. Their determination was previously reported in [21, 22].
normal representation system of the electrical activity of the The following criteria:
heart.
If, for a given electrode pair reversal simulation, Δs > Δr for
2.4. Electrode Cables Reversal Detection Criteria any of the OCQ, OCI, OCR or TPPAD measurements, then the
hypothesis of the reversal of the given electrode cables pair in the
Determination. The determination of the criteria for electrode
acquired 3D ECG is rejected
cables reversal detection was based on the analysis of a series
of CAVIAR serial measurements and of the differences results in 100% of sensitivity and in 100% of specificity for the
between the values Δs obtained when comparing the 3D ECGs 6 × 170 = 1020 serial comparisons that have been performed,
simulating a given reversal with the reference ECGs and the patient by patient, in the learning set.
values Δr found with the recorded 3D ECGs, in the learning In the test phase, almost the same 100% of total accuracy
set. A ranking score of classification of the observations results are obtained when applying the previously defined
“ECGs with reversal” versus “recorded ECGs” was computed. criteria. Specificity is 100% for the 12 216 (=2036 × 6) beat-
A dichotomization decision tree model was then applied to to-beat comparisons results of the simulated reversals for the
extract the most performant measurements. control recordings group (C). Sensitivity is 99.99% for theInternational Journal of Telemedicine and Applications 5
(a) (b)
Figure 2: Filtered ECG tracings of a patient undergoing an angioplasty, respectively recorded at 5 min 0 s (Panel (a)) and 5 min 20 s (Panel (b))
after balloon inflation. These tracings clearly show QRS pattern changes in leads I and II in panel (b) that may be interpreted as a reversal of
these leads with respect to Panel (a) and explain why the ECG displayed in Panel (b) was misclassified by our LA–LL electrode cables reversal
detection method.
12 588 (=2098 × 6) simulated reversals comparison results almost real time, allowing a significant reduction of false
obtained in the inflation group (I). Only one LA-LL electrodes alarms. In addition, the presented method allows, in case of a
reversal was not detected. Sensitivity was 100% for the other reversal detection, to indicate to a self-care ECG device user
five pairwise electrode cables interchanges. which electrode cables misplacements need to be checked.
Table 1 summarizes the relative contribution of each The only one 10 s ECG for which the simulated LA–LL
selected measurement for each of the six electrodes reversals electrode cables reversal was not detected by our method is a
simulations. These results show that OCQ and OCI are the dataset I ECG sequence recorded 5 min 20 s after balloon infla-
most relevant for all reversals, and that TPPAD mainly con- tion in the patient’s proximal right coronary artery. All other
tributes to the detection of the LA and LL electrode cables simulated LA–LL reversals of all the previous and following
interchange. 10 s ECG sequences from this dataset I patient were detected.
The incorrectly classified ECG sequence was extremely noisy
and the visual aspect of the QRS pattern highlights changes
4. Discussion that mimic a LA–LL electrode cables reversal, as shown in
Figure 2. However, such an error is not detrimental in the case
Our study anew demonstrates the relevance of personalized there are ischemic changes that will be detected anyway.
medicine empowered by patient-specific data analysis algo- We are convinced that the performance we obtain in this
rithms aiming at enhancing the diagnostic accuracy and the study in comparison with the previously reported results on
detection of technical errors. All six possible pairwise elec- the same topic is mainly the result of using serial ECG analysis,
trode cables reversals were detected with our approach with which is besides highly recommended by the international
an accuracy of almost 100%, thus providing the yet best societies of cardiology, even for expert cardiologists. Our
reported results. Only four measurements related to the QRS method still needs to be assessed on other large databases in
and T waves were involved. They can be computed in less than order to evaluate its robustness and reliability. But, unfortu-
0.04 s per serial comparison. As an example, the total process- nately, annotated and well documented serial ECG databases
ing time for the comparison of the 2098 typical beats from are not yet available, although only standard 12-lead ECGs or
dataset I with the respective control reference beats is 77 s with 3-lead ECGs (I, II, V2) are necessary.
a standard 3 GHz PC with 4 GB memory, and it is 25 s for the Concerning the LA–LL reversal, which is usually reported
170 × 4 = 680 comparisons of the 170 original 3D ECGs from as the most difficult to detect [13, 15], we can see in Table 1
the learning set and of the 170 × 3 3D ECGs simulating the the importance of the TPPAD angular deviation of the
studied C2 electrode cable misplacements. Such an electrode principal plane of the terminal part of QRS, for its detection.
cable interchange detection can therefore be performed in This parameter gives the highest percentage of correct6 International Journal of Telemedicine and Applications
QRS QRS
No reversal LA & RA reversal
QRS QRS
LA & LL reversal RA & LL reversal
(a)
T-wave T-wave
No reversal LA & C2 reversal
T-wave T-wave
RA & C2 reversal LL & C2 reversal
(b)
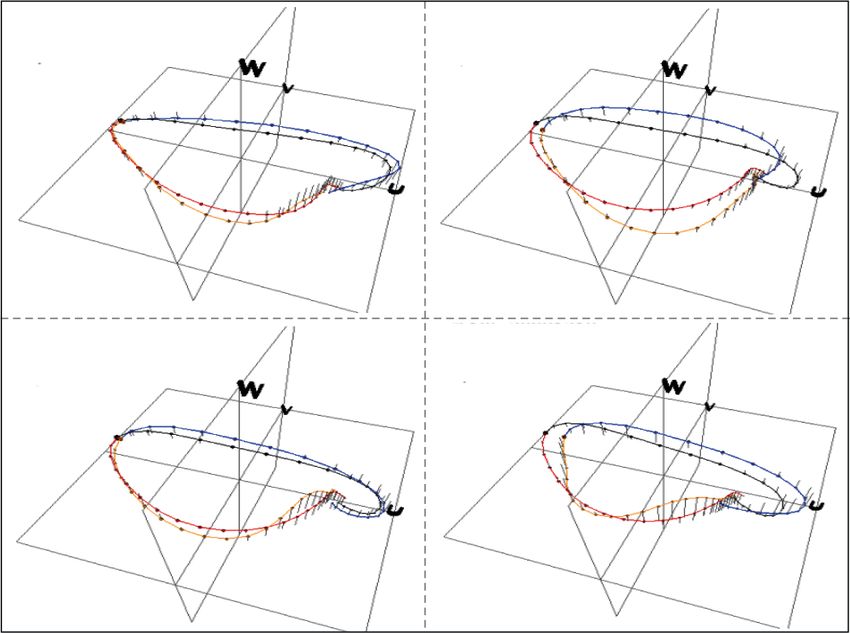
Figure 3: Sample CAVIAR displays of serial QRS (a) and T wave (b) changes for the tested electrode cable reversals with reference to the
standard ECGs of patients (a) and (b) presented in Figure 4. The first display at the top left of panels (a) and (b) shows the CAVIAR optimal
superimposition results between the standard ECGs and the corresponding, electrode cable reversals free, original 3D ECGs recorded with
the PEM device at respectively 5 min (patient (a)) and 1 h interval (patient (b)). The three other displays of panel (a) highlight the effect on
the QRS wave of a simulated, pairwise LA, RA, and LL electrode cables reversal on the PEM ECGs of patient (a), and in panel (b) the effect
on the T wave of a reversal between each of the limb electrodes and C2 for patient (b). The beginning and the end of the QRS wave (resp. of
the T wave) are respectively colored in black and red (resp. in red and grey) for the standard reference ECG and in blue and orange (resp. in
orange and dark red) for the PEM ECG.
classifications for this reversal when we compare a Mason- In addition, the orientation changes of the repolarization
Likar ECG with a standard ECG in the learning set and, during phase (OCR) mostly contribute to the identification of rever-
balloon inflation, when we compare an ECG which is altered sals between the precordial electrode and the peripheral elec-
by changes similar to ischemia effects with a reference ECG. trodes, which is an interesting result because we found noInternational Journal of Telemedicine and Applications 7
(a) (b)
Figure 4: Standard 12-lead ICU ECG recordings of two patients respectively called (a) and (b) selected to illustrate our results of electrode
cables reversals detection as displayed in Figure 3. Panel (a): 51-year-old man admitted for arrhythmia. Panel (b): 69–year-old man admitted
for coronary disease.
studies considering this kind of reversal for which we provide the whole necessary spatiotemporal information for ischemia
in this paper unpublished new simulation formulas. Spatial and arrhythmia computerized diagnosis, and which is easy and
orientation changes of the beginning of QRS (OCI) seem to convenient to use, especially when the limb electrodes are
be the most powerful measurement but nevertheless the global placed in the Mason-Likar positions. The new method pre-
orientation changes of the whole QRS loop (OCQ) are sented in this paper, which is based on a personalized, com-
complementary. parative spatiotemporal ECG analysis with respect to a patient’s
Figure 3 displays an example of CAVIAR representations reference ECG by means of the CAVIAR software, has reached
highlighting these types of ECG changes for two patients of 99.99% sensitivity and 100% specificity in the respective test
the learning set recorded at their admission in the ICU sets. All six possible pairwise electrode cable interchanges of
(Figure 4) for arrhythmia (Patient (a)) and for coronary dis- the four active electrodes could be identified by comparing the
eases (Patient (b)). We can see, Figure 3, that the spatial QRS serial analysis results obtained for the original, last recorded
and T loops of the standard 12-lead reference ECG and of the ECG, and with the results obtained for this same ECG after
3D ECG recorded with the PEM are very well superimposed having applied on each lead the mathematical transformations
in their preferential space (U, V, W) defined by the inertia axes simulating the six different electrode cable reversals. Even the
of the spatial waves. We thus can visualize in 3D the spatio- interchanges between the limb and the precordial electrodes
temporal changes when we superimpose the recorded stand- and between the LA and LL electrodes, which are usually not
ard ECG and the simulated PEM ECG when an electrode cable studied because they are known to be difficult to assess, were
reversal occurs. This figure demonstrates that the whole QRS considered in the present study. Only four spatial orientation
loop is modified in case of a LA-RA reversal (OCQ varies from changes measurements of the QRS and T waves and of the
7° to 98°) and of a RA-LL reversal (OCQ and OCI differences onset and of the end of the QRS wave need to be computed for
are 32° and 76°), and that mainly the end of QRS is changed the recorded and the six simulated ECGs, a task which can be
for a LA-LL reversal (TPPAD goes from 9° to 68°). In addition achieved in less than 0.25 s. The computation is based on the
to QRS changes, the repolarization wave is also significantly determination of the center of gravity and of the preferential
modified when there is a cable interchange between C2 and space of the spatial QRS and T loops and of the initial and
the limb leads. OCR changes between Δr and Δs are 46° (LA– terminal parts of QRS. In conclusion, using the proposed
C2), 129° (RA–C2), and 72° (LL–C2). patient specific approach, a personalized automatic detection
of electrode cables reversals can considerably reduce the num-
ber of ECG-based false alarms in self-care.
5. Conclusions
Data Availability
ECG electrode cables reversals, which are one of the main
causes of false alarms in self-care, can be automatically detected The ECG recordings of the learning dataset used in this study
in almost real time with a great reliability for 3-lead ECG are available from the authors upon request. These ECGs have
recordings based on I, II, V2, a recording system that provides been collected within the frame of the European EPI-MEDICS8 International Journal of Telemedicine and Applications
project [4]. The previously reported datasets C and I were [10] K. R. Nilsson, P. M. Sewell, P. Blunden-Kasdorf, K. Starkey, A. O.
used to test the findings of this study. These prior studies Grant, and G. S. Wagner, “The influence of cardiograph design
are cited within the text as references [5, 6]. These datasets and automated algorithms on the incidence and detection of
are part of the STAFF III database which is now available at electrode cable reversals in an academic electrocardiogram
doi:10.13026/C20P4H or https://physionet.org/physiobank/ laboratory,” Journal of Electrocardiology, vol. 41, no. 5,
database/staffiii/. pp. 382–387, 2008.
[11] V. N. Batchvarov, M. Malik, and A. J. Camm, “Incorrect electrode
cable connection during electrocardiographic recording,”
Conflicts of Interest Europace, vol. 9, no. 11, pp. 1081–1090, 2007.
[12] B. Hedén, M. Ohlsson, L. Edenbrandt, R. Rittner, O. Pahlm,
The authors declare that they have no conflicts of interest and C. Peterson, “Artificial neural networks for recognition of
regarding the publication of this paper. electrocardiographic lead reversal,” The American Journal of
Cardiology, vol. 75, no. 14, pp. 929–933, 1995.
Authors’ Contributions [13] J. A. Kors and G. van Herpen, “Accurate automatic detection of
electrode interchange in the electrocardiogram,” The American
Jocelyne Fayn initiated, designed and performed the whole Journal of Cardiology, vol. 88, no. 4, pp. 396–399, 2001.
study and the methods. Paul Rubel provided the simulation [14] C. Han, R. E. Gregg, and S. Babaeizadeh, “Automatic detection
equations of electrode cables reversals. The paper was written of ECG lead-wire interchange for conventional and mason-likar
by Jocelyne Fayn and reviewed by Paul Rubel. lead systems,” Computing in Cardiology, vol. 41, pp. 145–148,
2014.
[15] C. Han, R. E. Gregg, D. Q. Feild, and S. Babaeizadeh,
References “Automatic detection of ECG cable interchange by analyzing
both morphology and interlead relations,” Journal of
[1] World Health Organization, “The top 10 causes of death,” Electrocardiology, vol. 47, no. 6, pp. 781–787, 2014.
2018.https://www.who.int/news-room/fact-sheets/detail/the-
[16] I. Jekova, V. Krasteva, R. Leber et al., “Inter-lead correlation
top-10-causes-of-death
analysis for automated detection of cable reversals in 12/16-
[2] K. Thygesen, J. S. Alpert, A. S. Jaffe et al., “The executive group lead ECG,” Computer Methods and Programs in Biomedicine,
on behalf of the joint European Society of Cardiology (ESC)/ vol. 134, pp. 31–41, 2016.
American College of Cardiology (ACC)/American Heart
[17] P. Arnaud, P. Rubel, D. Morlet, J. Fayn, and M. C. Forlini,
Association (AHA)/World Heart Federation (WHF) task force
“Methodology of ECG interpretation in the Lyon program,”
for the universal definition of myocardial infarction, “Fourth
Methods of Information in Medicine, vol. 29, no. 4, pp. 393–402,
Universal Definition of Myocardial Infarction”,” Circulation,
1990.
vol. 138, no. 20, pp. e618–e651, 2018.
[18] “Health Informatics—Standard Communication Protocol—
[3] J. Fayn and P. Rubel, “Towards a personal health society in
Computer assisted Electrocardiography (SCP-ECG),” ISO
cardiology,” IEEE Transactions on Information Technology in
11073–91064, 2009 and EN 1064:2005+A1:2007 Standards,
Biomedicine, vol. 14, no. 2, pp. 401–409, 2010.
2009, http://www.centc251.org/.
[4] P. Rubel, J. Fayn, G. Nollo et al., “Toward personal eHealth
[19] P. Rubel, D. Pani, A. Schloegl et al., “SCP-ECG V3.0: an
in cardiology. Results from the EPI-MEDICS telemedicine
enhanced standard communication protocol for computer-
project,” Journal of Electrocardiology, vol. 38, no. 4, pp. 100–106,
assisted electrocardiography,” Computing in Cardiology,
2005.
vol. 43, pp. 309–312, 2016.
[5] J. Fayn, P. Rubel, O. Pahlm, and G. S. Wagner, “Improvement
[20] J. Fayn and P. Rubel, “An ECG web services portal for
of the detection of myocardial ischemia thanks to information
standard and serial ECG analysis with enhanced 3D graphical
technologies,” International Journal of Cardiology, vol. 120,
capabilities,” Computing in Cardiology, vol. 44, 2017.
no. 2, pp. 172–180, 2007.
[21] J. Fayn and P. Rubel, “CAVIAR, a serial ECG processing system
[6] J. Fayn, “A classification tree approach for cardiac ischemia
for the comparative analysis of VCGs and their interpretation
detection using spatiotemporal information from three standard
with auto-reference to the patient,” Journal of Electrocardiology,
ECG leads,” IEEE Transactions on Biomedical Engineering,
vol. 21, pp. S173–S176, 1988.
vol. 58, no. 1, pp. 95–102, 2011.
[22] J. Fayn, P. Rubel, and N. Mohsen, “An improved method for the
[7] P. Velagapudi, M. K. Turagam, S. Ritter, and M. L. Dohrmann,
precise measurement of serial ECG changes in QRS duration
“Left arm/left leg lead reversals at the cable junction box: a cause
and QT interval. Performance assessment on the CSE noise
for an epidemic of errors,” Journal of Electrocardiology, vol. 50,
testing database and on a healthy 720-case-set-population,”
no. 1, pp. 111–114, 2017.
Journal of Electrocardiology, vol. 24, pp. 123–127, 1991.
[8] R. A. Harrigan, T. C. Chan, and W. J. Brady, “Electrocardiographic
electrode misplacement, misconnection, and artifact,” The
Journal of Emergency Medicine, vol. 43, no. 6, pp. 1038–1044,
2012.
[9] R. R. Bond, D. D. Finlay, C. D. Nugent, C. Breen, D. Guldenring,
and M. J. Daly, “The effects of electrode misplacement
on clinicians’ interpretation of the standard 12-lead
electrocardiogram,” European Journal of Internal Medicine,
vol. 23, no. 7, pp. 610–615, 2012.You can also read