Three-dimensional assessment of maxillary changes associated with bone anchored maxillary protraction
←
→
Page content transcription
If your browser does not render page correctly, please read the page content below
ORIGINAL ARTICLE

Three-dimensional assessment
of maxillary changes associated with
bone anchored maxillary protraction

Tung Nguyen,a Lucia Cevidanes,a Marie A. Cornelis,b Gavin Heymann,c Leonardo K. de Paula,d and
Hugo De Clercke
Chapel Hill and Durham, NC, and Geneva, Switzerland

      Introduction: Bone-anchored maxillary protraction has been shown to be an effective treatment modality for the
      correction of Class III malocclusions. The purpose of this study was to evaluate 3-dimensional changes in the
      maxilla, the surrounding hard and soft tissues, and the circummaxillary sutures after bone-anchored maxillary
      protraction treatment. Methods: Twenty-five consecutive skeletal Class III patients between the ages of 9
      and 13 years (mean, 11.10 6 1.1 years) were treated with Class III intermaxillary elastics and bilateral miniplates
      (2 in the infrazygomatic crests of the maxilla and 2 in the anterior mandible). Cone-beam computed tomographs
      were taken before initial loading and 1 year out. Three-dimensional models were generated from the
      tomographs, registered on the anterior cranial base, superimposed, and analyzed by using color maps.
      Results: The maxilla showed a mean forward displacement of 3.7 mm, and the zygomas and the maxillary in-
      cisors came forward 3.7 and 4.3 mm, respectively. Conclusions: This treatment approach produced significant
      orthopedic changes in the maxilla and the zygomas in growing Class III patients. (Am J Orthod Dentofacial
      Orthop 2011;140:790-8)

M
          axillary hypoplasia is frequently found in pa-                             These protocols, however, still need a facemask. De
          tients with Class III malocclusion. Conventional                           Clerck et al7 suggested the use of Class III elastics between
          treatments involve the use of a protraction                                miniplate skeletal anchorage in both jaws (bone-
facemask to advance the maxilla. However, such appli-                                anchored maxillary protraction). Preliminary studies
ances often have unwanted side effects including                                     based on conventional 2-dimensional (2D) cephalometric
maxillary incisor proclination and clockwise rotation                                data after active therapy show significantly favorable
of the mandible.1-3 New treatment methods with                                       results from bone-anchored maxillary protraction com-
skeletal anchorage in the maxillary buttress have been                               pared with control and facemask groups.8,9
developed to minimize dentoalveolar compensations.4-6                                    The precise response to protraction of the maxilla
                                                                                     with bone-anchored maxillary protraction, including re-
a
  Assistant professor, Department of Orthodontics, School of Dentistry, University   modeling and adaptation of the adjacent bones, sutures,
of North Carolina, Chapel Hill.
b
  Assistant professor, Department of Orthodontics, School of Dentistry, University   and soft tissues, has yet to be clarified. Furthermore, the
of Geneva, Geneva, Switzerland.                                                      envelope of correction that is possible with bone-
c
  Private practice, Durham, NC.                                                      anchored maxillary protraction needs to be established.
d
  Research assistant, Department of Orthodontics, School of Dentistry, University
of North Carolina, Chapel Hill.                                                      These morphologic changes and their clinical relevance
e
  Adjunct professor, Department of Orthodontics, School of Dentistry, University     cannot be well addressed with 2D imaging methods
of North Carolina, Chapel Hill.                                                      alone. Advances in 3-dimensional (3D) imaging of facial
The authors report no commercial, proprietary, or financial interest in the prod-
ucts or companies described in this article.                                         structures provide an alternative tool to analyze skeletal
Supported by the National Institute of Dental and Craniofacial Research (NIDCR)      changes. The development and validation of a method
number DE005215 and the American Association of Orthodontists Foundation.            for 3D longitudinal assessments by using surface regis-
Reprint requests to: Tung Nguyen, Department of Orthodontics, UNC School of
Dentistry, CB#7450, Chapel Hill, NC 27599-7450; e-mail, nguyentu@dentistry.          tration on the anterior cranial base as a reference could
unc.edu.                                                                             identify the location and nature of the orthopedic effects
Submitted, December 2010; revised and accepted, April 2011.                          after bone-anchored maxillary protraction.10
0889-5406/$36.00
Copyright Ó 2011 by the American Association of Orthodontists.                           In a pilot study on 3D assessments of treatment
doi:10.1016/j.ajodo.2011.04.025                                                      outcomes of bone-anchored maxillary protraction,
790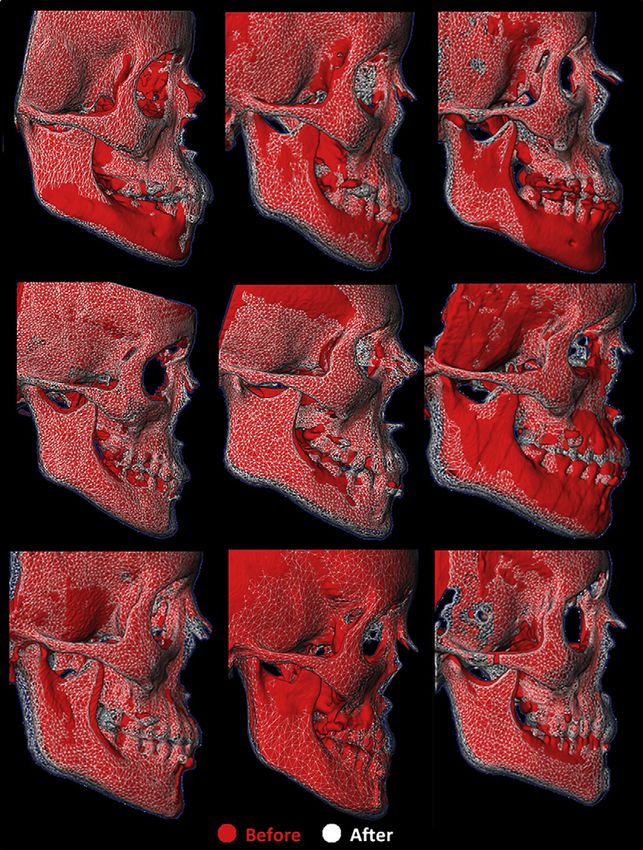
Nguyen et al                                                                                                          791

Fig 1. Skull illustrating the anatomic locations of the bone
anchors.

                                                               Fig 3. The isolines, displayed as a black circle or a dot,
                                                               show the regions with the greatest displacement (positive
                                                               in red; negative in blue) between the T1 and T2 superim-
                                                               positions. These isolines measure the closest distance
                                                               between the superimpositions. The top image shows
                                                               the isolines representing the regions of greatest outward
                                                               displacement in the maxilla and zygomas, and the bottom
                                                               image illustrates the regions with maximum inward
                                                               displacement.

Fig 2. Intermaxillary elastics to anchors with a bite plate
retainer to assist with bite opening.                          operators (H.D.C. and M.A.C.) with the bone-anchored
                                                               maxillary protraction technique.
Heymann et al11 reported marked variability in responses           At the initial observation (T1), all patients had Class
to the therapy. Our study expands these preliminary 3D         III malocclusion in the mixed or permanent dentition
findings to a larger sample, to evaluate overall facial         characterized by a Wits appraisal of 1 mm or less
changes relative to the cranial base at the end of active      (mean, 4.8 6 2.8 mm), anterior crossbite or incisor
treatment with bone-anchored maxillary protraction.            end-to-end relationship, and Class III molar relationship.
The purpose of this study was to evaluate in 3 dimen-          All patients were of white ancestry, with a prepubertal
sions the growth and treatment effects of the bone-            stage of skeletal maturity according to the cervical verte-
anchored maxillary protraction protocol on the maxillary       bral maturation method (CS1-CS3).12 Twenty-one of the
dentition, the midface, and the adjacent soft tissues of       25 patients were still prepubertal at the end of treatment
consecutively treated patients.                                (T2), and 4 patients were at CS4. The mean ages for the
                                                               bone-anchored maxillary protraction sample were 11.9
MATERIAL AND METHODS                                           6 1.8 years at T1 and 13.1 6 1.7 years at T2. The
    This prospective sample consisted of 25 consecu-           mean duration of the T1 to T2 interval was 1.2 6 1.0
tively treated patients (13 girls, 12 boys) with dentoske-     years. Institutional review board approval for the study
letal Class III malocclusion. All patients were treated by 2   was obtained from the University of North Carolina.

American Journal of Orthodontics and Dentofacial Orthopedics                      December 2011  Vol 140  Issue 6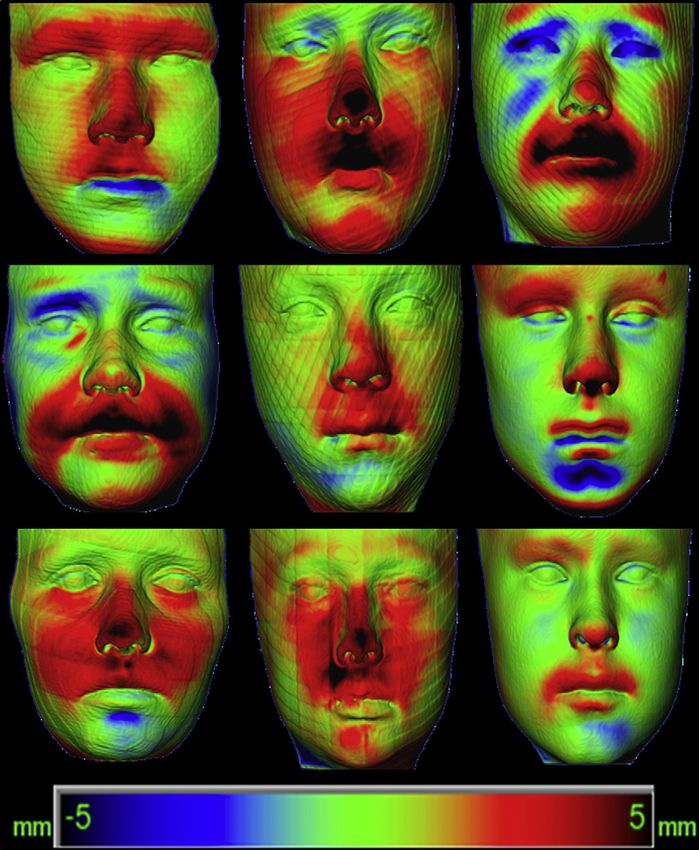
792                                                                                                                Nguyen et al

 Table I. Mean values, standard deviations, and ranges of maxillary protraction changes in millimeters at each ana-
 tomic region relative to the cranial base superimposition
                 Maxillary incisor     Maxilla       Right zygoma        Left zygoma     Soft-tissue upper lip    Soft-tissue nose
 Mean and SD      4.27 6 1.66        3.73 6 1.66      3.60 6 1.32        3.76 6 1.53         3.98 6 1.82            3.82 6 1.36
 Range             1.65-8.50           1.45-8.5        1.58-6.86          1.35-7.81            0.33-9.32             1.01-6.36

                  Fig 4. Box plots of the growth and response to treatment at each anatomic region.

    Each patient had miniplates placed on the left and              edu/dev/download/imagine/index.htm). This method, de-
right infrazygomatic crests of the maxillary buttress               veloped by Cevidanes et al,13 masks anatomic structures
and between the mandibular left and right lateral inci-             altered by treatment or growth to prevent observer-
sors and canine (Fig 1). Small mucoperiosteal flaps                  dependent reliance on subjectively defined anatomic
were elevated, and the modified miniplates (Bollard,                 landmarks. In this study, the initial and final 3D models
Tita-Link, Brussels, Belgium) were secured to the bone              were registered on anterior cranial fossa structures, specif-
by 2 (mandiblular) or 3 (maxillary) screws (diameter,               ically the endocranial surfaces of the cribiform plate region
2.3 mm; length, 5 mm).7 The extensions of the plates                of the ethmoid bone and the frontal bone. These regions
perforated the attached gingiva near the mucogingival               were chosen because of their early completion of growth.
junction (Fig 2). Three weeks after surgery, the mini-              The software compares 2 images by using the intensity
plates were loaded. Class III elastics applied an initial           gray scale for each voxel of the T1 and T2 images.
force of 100 g on each side, increased to 150 g after 1                 After the registration step, all reoriented virtual
month of traction and to 250 g after 3 months. The pa-              models were superimposed to quantitatively evaluate
tients were asked to replace the elastics at least once             the greatest surface displacement by using the CMF ap-
a day and to wear those 24 hours per day. In 14 patients,           plication software (developed at the M. E. M€     uller Insti-
after 2 to 3 months of intermaxillary traction, a remov-            tute for Surgical Technology and Biomechanics,
able bite plate was inserted in the maxillary arch to elim-         University of Bern, Bern, Switzerland, under the funding
inate occlusal interference.                                        of the Co-Me network; http://co-me.ch). This tool cal-
    Cone-beam computed tomography (CBCT) scans                      culates thousands of color-coded point-to-point com-
were taken at T1 and T2 by using an iCat machine (Im-               parisons (surface distances in millimeters) between the
aging Sciences International, Hatfield, Pa) with a 16 3              3D models, so that the difference between 2 surfaces
22-cm field of view. Virtual 3D surface models were con-             at any location can be quantified.
structed from the CBCT images with a voxel dimension                    For quantitative assessment of the changes between
of 0.5 3 0.5 3 0.5 mm. Construction of 3D surface                   the 3D surface models, the isoline tool allows the user
models of the anatomic structures of interest and the               to define a surface-distance value to be expressed as
3D graphic renderings were done by using the ITK-                   a contour line (isoline) that corresponds to regions having
SNAP (open-source software; www.itksnap.org).                       a surface distance equal to or greater than the defined
    The T1 and T2 images were registered by using the               value. The isoline tool was used to quantitatively measure
anterior cranial fossa as a reference. A fully automated            the greatest displacements between points in the 3D
voxel-wise rigid registration method was performed with             surface models for the maxillary incisors, the maxilla,
IMAGINE (open-source software; http://www.ia.unc.                   the right and left zygomas, the upper lip, and the

December 2011  Vol 140  Issue 6                      American Journal of Orthodontics and Dentofacial Orthopedics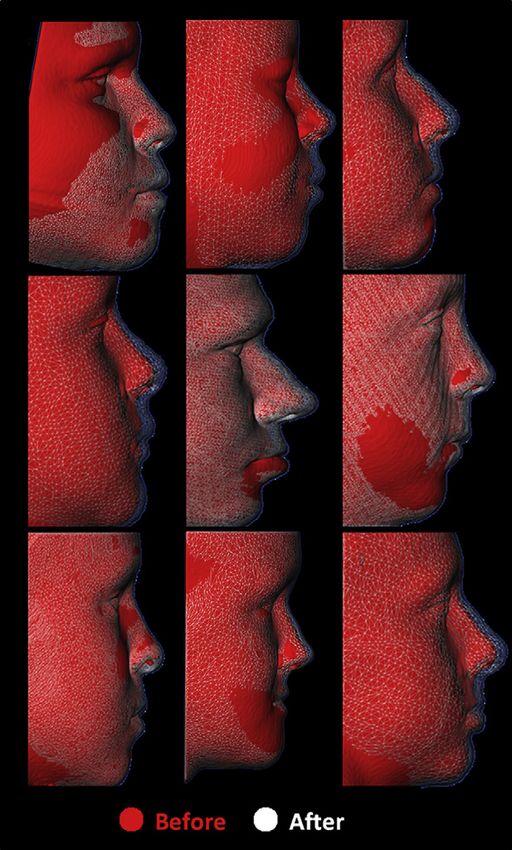
Nguyen et al 793
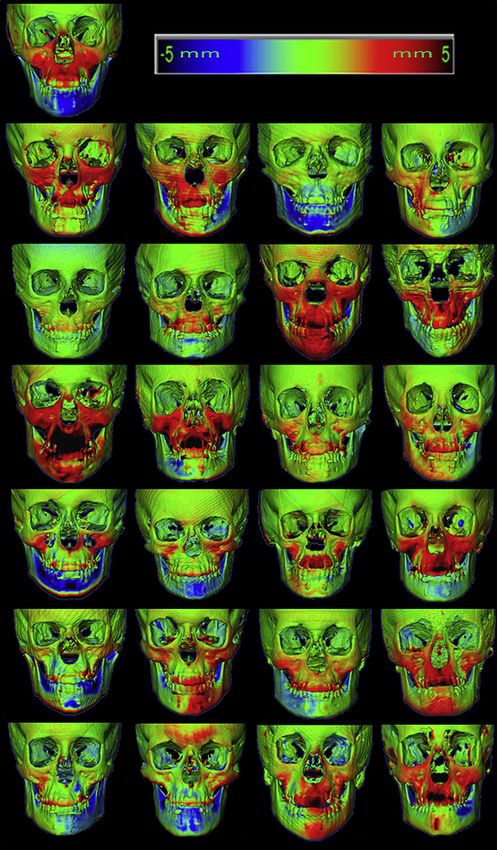
Fig 5. Three-dimensional skeletal color maps of superimpositions of T2 over T1 registered at the an-
terior cranial base with a scale of 5 to 15 mm. Red represents outward displace of T2 in relation to T1;
blue represents inward displacement of T2 in relation to T1.
American Journal of Orthodontics and Dentofacial Orthopedics December 2011 Vol 140 Issue 6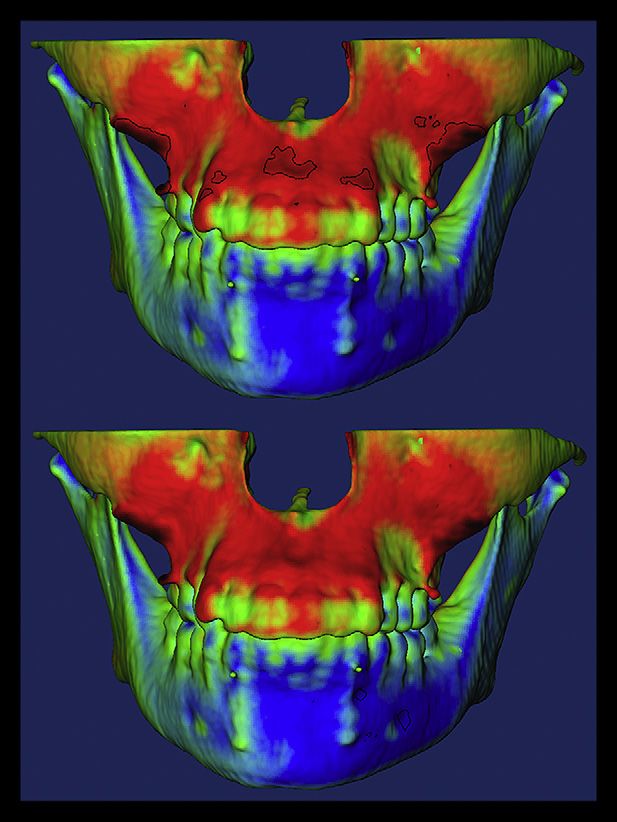
794                                                                                                           Nguyen et al

         Fig 6. Lateral views of the skeletal semitransparency superimpositions for 9 patients. T1 models are
         represented by solid red; superimposed T2 models are shown as semitransparent white mesh.

soft-tissue nose (Fig 3). Positive values indicated anterior    of the method as determined in previous studies showed
displacement, and negative values posterior displace-           excellent reliability.10 Descriptive statistics were used to
ment. For the maxillary incisor, the maximum surface dis-       describe the sample percentiles, means, standard devia-
tance was measured at the incisor’s most labial surface.        tions, and ranges. Pearson correlation coefficients were
The maxillary region was defined as the anterior surface         used to assess the associations between changes at
of the maxilla between the canines. The right and left zy-      each anatomic region. The levels of significance were
gomas were defined as the surfaces adjacent and superior         set at 0.05 for P values and 0.5 for r values.
to the bone anchors. The soft-tissue nose region was de-
fined as the tip of the nose. The upper lip was defined as        RESULTS
the area below the nose between the lip commissures.                Table I summarizes the descriptive statistics for the
                                                                skeletal and soft-tissue changes observed from T1 to
Statistical analysis                                            T2 for the 25 consecutively treated bone-anchored max-
  The largest displacements between T1 and T2 were              illary protraction patients. The maxilla showed a mean
computed at each anatomic region of interest. The error         displacement of 3.73 mm, whereas the maxillary incisors

December 2011  Vol 140  Issue 6                       American Journal of Orthodontics and Dentofacial Orthopedics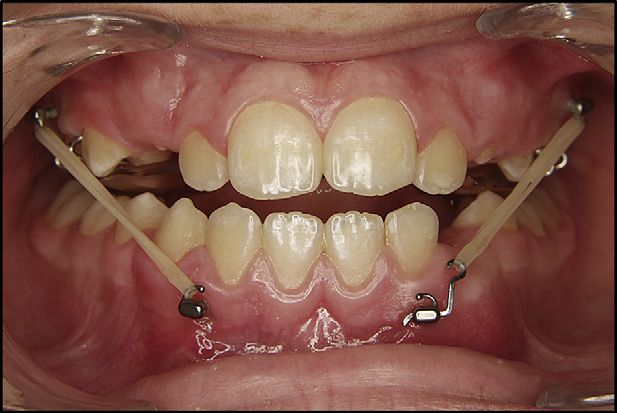
Nguyen et al                                                                                                       795

         Fig 7. Frontal views of 3D soft-tissue color maps of superimpositions for 9 patients showing a large
         range of responses.

and the right and left zygomas advanced 4.27, 3.60, and       the regions except for the soft-tissue nose with the left
3.76 mm, respectively. Although all subjects had anterior     and right zygomas.
displacements of the skeletal and dental structures of in-
terest, there were considerable variations in the magni-      DISCUSSION
tudes (Fig 4). Skeletal changes between T1 and T2 are             The purposes of this study were to evaluate an ade-
displayed as color maps or semitransparencies (Figs 5         quate sample of consecutively treated Class III patients
and 6).                                                       by using the bone-anchored maxillary protraction pro-
    The soft-tissue upper lip advanced 3.98 mm, and the       tocol and to report the 3D changes to the skeletal,
nose translated forward 3.82 mm. Soft-tissue displace-        dental, and soft tissues of the midface region. Two-
ments also showed a wide range of variations. A color         dimensional studies of maxillary protraction have limita-
map and mesh superimpositions showing these changes           tions, since the landmarks evaluated are often midline
between T1 and T2 for 9 subjects are given in Figures 7       structures or 2D projections of 3D structures. Further-
and 8, respectively.                                          more, bilateral structures cannot be evaluated individu-
    Pearson analysis showed significant correlations be-       ally and are susceptible to measurement errors if the
tween the displacement of the maxillary incisors, the         patient’s head is slightly rotated during film capture.
maxilla, the zygomas, and the soft-tissue upper lip           CBCT scans and evolving 3D imaging softwares have re-
(Table II). There was a significant correlation among          solved many of these issues and given a more global view

American Journal of Orthodontics and Dentofacial Orthopedics                    December 2011  Vol 140  Issue 6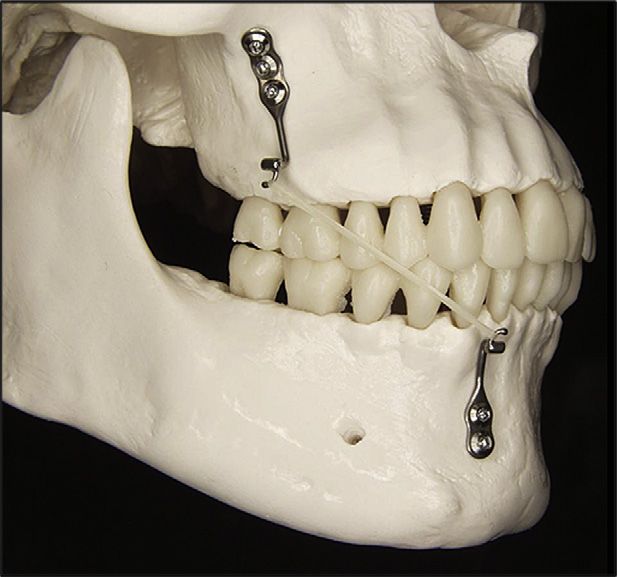
796                                                                                                         Nguyen et al

                                                               displacement in our 3D study correlated well with the
                                                               2D findings. Three-dimensional color maps and semi-
                                                               transparency superimpositions showed no significant
                                                               proclination of the maxillary incisors with bone-
                                                               anchored maxillary protraction (Figs 5 and 6). This is
                                                               in contrast to a meta-analysis of the effectiveness of
                                                               facemask therapy by Kim et al,14 which identified
                                                               increased labial inclination of the maxillary incisor and
                                                               decreased mandibular incisor inclination with conven-
                                                               tional protraction facemask therapy.
                                                                   Every subject in this prospective sample of consecu-
                                                               tively treated patients had forward displacement in the
                                                               zygomatic and infraorbital regions, with mean changes
                                                               of 3.6 to 3.8 mm. This finding was similar to the 2D
                                                               cephalometric data from this sample, which reported
                                                               a 3.5-mm anterior displacement of orbitale in the
                                                               bone-anchored maxillary protraction group. However,
                                                               3D color maps clearly locate the areas of bone remodel-
                                                               ing and displacement. In this sample, there was a statis-
                                                               tically significant correlation (P \0.0001) between the
                                                               magnitude of displacement of the left and right zy-
                                                               gomas, the maxilla, and the maxillary incisors, suggest-
                                                               ing that the midface was displaced anteriorly as a unit.
                                                                   Three-dimensional data on untreated controls and
                                                               patients treated by other techniques for maxillary pro-
                                                               traction are not currently available. For this reason, com-
                                                               parison of results with other techniques refers to 2D
                                                               cephalometric findings. The amount of maxillary pro-
                                                               traction with bone-anchored maxillary protraction is
                                                               more significant when compared with 0.6 mm of for-
                                                               ward growth of orbitale in untreated Class III controls
                                                               over a similar time period.8 Previously reported findings
Fig 8. Lateral views of the soft-tissue semitransparency       of infraorbital changes after facemask therapy are con-
superimpositions for 9 patients. Note the range of soft-       troversial. Nartallo-Turley and Turley15 reported signifi-
tissue responses from 1 patient to another.                    cant advancements of orbitale (2 mm) and the key ridge
                                                               (1 mm), whereas Pangrazio-Kulbersh et al16 found no
of the surface changes, not only in the region of interest,    effect on the displacement of orbitale in young patients
but also in the neighboring structures.                        treated with facemask protraction. The mean age in the
    Bone-anchored maxillary protraction treatment has          facemask group of Nartallo-Turley and Turley was 7.3
been shown to produce significant orthopedic changes            years compared with 8.9 years in the group of
compared with untreated Class III subjects and facemask        Pangrazio-Kulbersh et al and 11.9 years in our bone-
or rapid maxillary expansion therapy. Two-dimensional          anchored maxillary protraction group. Baccetti et al17
cephalometric data showed 4 mm of maxillary improve-           also indicated greater maxillary orthopedic effects of
ment with bone-anchored maxillary protraction treat-           facemasks in the early mixed dentition. Future 3D stud-
ment, measured at A-point, when compared with the              ies with facemask therapy are needed to evaluate and
untreated controls. In addition, bone-anchored maxil-          compare the effectiveness in producing orthopedic
lary protraction produced 2.3 to 3 mm more of maxillary        changes at the infraorbital and zygomatic regions.
protraction compared with facemask or rapid maxillary              The 3D color maps (Fig 5) show that bone-anchored
expansion treatment.9 Although 3D untreated norma-             maxillary protraction patients had uniform anterior dis-
tive data are not available for direct comparison with         placements of the maxilla and the zygoma. Our 2D ceph-
the bone-anchored maxillary protraction treatment              alometric study showed minimal counterclockwise
group, indirect comparisons can be made with the 2D            rotation of the maxilla with bone-anchored maxillary
data. Mean values for maxillary incisor and maxillary          protraction treatment.8 These findings contradict the

December 2011  Vol 140  Issue 6                      American Journal of Orthodontics and Dentofacial Orthopedics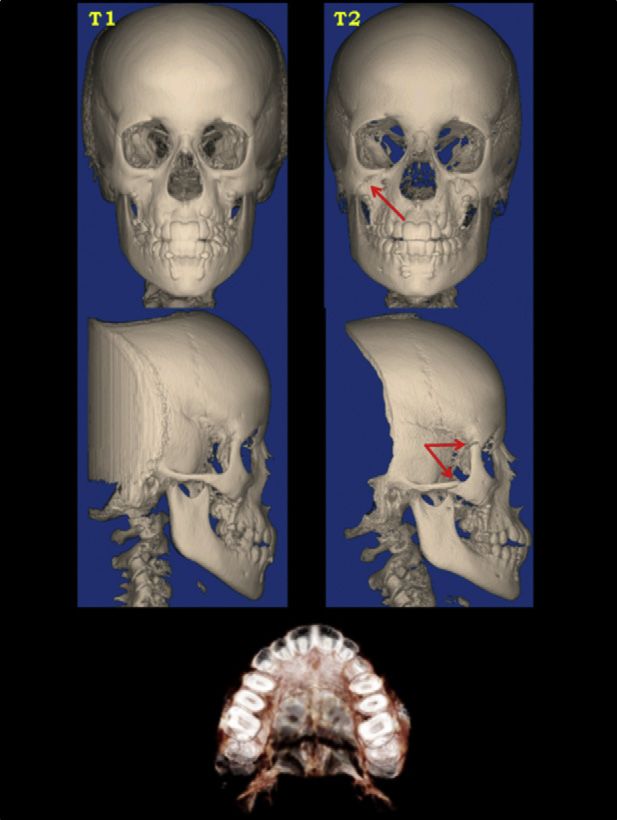
Nguyen et al                                                                                                                                         797

 Table II. Pearson correlation coefficients for growth and treatment response changes between all anatomic regions of
 interest
 Anatomic region            Maxillary incisor        Maxilla        Right zygoma        Left zygoma        Soft-tissue upper lip       Soft-tissue nose
 Maxillary incisor                                   0.92*              0.87*              0.87*                    0.83*                   0.50*
 Maxilla                        \0.0001*                                0.85*              0.83*                    0.82*                   0.53*
 Right zygoma                   \0.0001*            \0.0001*                               0.91*                    0.73*                   0.30
 Left zygoma                    \0.0001*            \0.0001*          \0.0001*                                      0.75*                   0.38
 Soft-tissue upper lip          \0.0001*            \0.0001*          \0.0001*            \0.0001*                                          0.66*
 Soft-tissue nose                0.01*               0.01*             0.15                0.06                   \0.001*
 The upper right section of the table shows r values, and the lower left section of the table shows the P values. Statistical significance values were set
 at 0.05 for P and 0.5 for r.
 *Significant values.

hypothetical definition of Teuscher18 of the position of
the maxillary center of resistance in the biomechanics
of bone displacement. If the center of resistance were lo-
cated at the maxillary buttress, the line of force of the
bone-anchored maxillary protraction Class III elastics
to this center of resistance would result in a moment
of force and a marked counterclockwise rotation of the
maxilla. Our study showed minimal rotation of the max-
illa, suggesting that the center of resistance of the mid-
face is probably located posterior and inferior to that
defined by Teuscher.
     Another interesting finding was the opening of the
circummaxillary sutures that was evident in a number
of subjects. Forward displacement of the maxilla in
this study was observed without disarticulation of the
facial sutures as advocated by Liou19 and Wang et al.20
Contrary to facemask protocols, the bone-anchored
maxillary protraction protocol was not preceded by
a rapid palatal expansion. Future investigations are
needed to assess whether the circummaxillary suture
opens because of the direct application of forces to the
maxillary bone in the bone-anchored maxillary protrac-
tion protocol.
    Displacement of the maxilla is greatly influenced by
the resistance against movement at the circummaxillary
sutures. Also, the complexity of the suture interdigita-
tions, which increase with age, affects the orthopedic                          Fig 9. Distraction of circummaxillary sutures at T2 (red
outcome.21 From animal studies, it is known that the su-                        arrows). Note the opening of the zygomaticofrontal, zygo-
ture surface and the complexity of interdigitations are                         maticotemporal, zygomaticomaxillary, and transverse
                                                                                palatine sutures.
higher in the zygomaticomaxillary suture than in the zy-
gomaticotemporal and zygomaticofrontal sutures. The
transverse palatine suture has shown the highest open-                          CBCT scans at T2 can only capture this phenomenon
ing of all circummaxillary sutures after protraction of                         during periods of rapid orthopedic distraction, and be-
the maxilla in primates.22,23 These findings were                                fore bone deposition and maturation have occurred.
confirmed by opening of the sutures as observed on                               Melsen21 suggested that the palatine bone should be
the CBCT scans at T2 of the bone-anchored maxillary                             considered as a buffer between the facial skeleton and
protraction sample (Fig 9). Although many of our pa-                            the cranial base. This might explain the difference in
tients exhibited this pattern of sutural opening at T2,                         the amounts and the directions of displacement of the
it was not seen in all of them. This is to be expected, since                   anterior and posterior nasal spines as shown by the

American Journal of Orthodontics and Dentofacial Orthopedics                                             December 2011  Vol 140  Issue 6
798 Nguyen et al
thin plate spline analysis of this sample.24 The opening 7. De Clerck HJ, Cornelis MA, Cevidanes LH, Heymann GC,
or stimulus of growth at the maxillary sutures is a gradual Tulloch CJ. Orthopedic traction of the maxilla with miniplates:
a new perspective for treatment of midface deficiency. J Oral Max-
process when light forces are applied, but, in some sub-
illofac Surg 2009;67:2123-9.
jects, the sutural opening was clearly visible at T2. The 8. De Clerck H, Cevidanes L, Baccetti T. Dentofacial effects of
high potential of adaptation in the transverse palatine, bone-anchored maxillary protraction: a controlled study on
zygomaticotemporal, and zygomaticofrontal sutures consecutively treated Class III patients. Am J Orthod Dentofacial
might explain why the maxilla, the zygomas, and the Orthop 2010;138:577-81.
9. Cevidanes L, Baccetti T, Franchi L, McNamara JA Jr, De Clerck H.
maxillary incisors moved forward as 1 unit.
Comparison of two protocols for maxillary protraction: bone
The 3D changes in the midface in this study were at anchors versus face mask with rapid maxillary expansion. Angle
the end of active therapy, and assessments of mandibu- Orthod 2010;80:799-806.
lar compensation and adaptations to the bone-anchored 10. Cevidanes LH, Heymann G, Cornelis MA, De Clerck HJ, Tulloch JF.
maxillary protraction protocol are needed. Overall treat- Superimposition of 3-dimensional cone-beam computed tomog-
raphy models of growing patients. Am J Orthod Dentofacial Or-
ment changes after fixed appliances and the pubertal
thop 2009;136:94-9.
growth spurt will be needed to assess the long-term sta- 11. Heymann GC, Cevidanes L, Cornelis M, De Clerck HJ, Tulloch JF.
bility of correction with the bone-anchored maxillary Three-dimensional analysis of maxillary protraction with inter-
protraction protocol and the percentage of these pa- maxillary elastics to miniplates. Am J Orthod Dentofacial Orthop
tients who might still require surgical correction after 2010;137:274-84.
12. Baccetti T, Franchi L, McNamara JA Jr. The cervical vertebral
completion of facial growth.
maturation (CVM) method for the assessment of optimal treat-
ment timing in dentofacial orthopedics. Semin Orthod 2005;
CONCLUSIONS 11:119-29.
13. Cevidanes LH, Styner MA, Proffit WR. Image analysis and superim-
This 3D evaluation of the therapeutic effects of the
position of 3-dimensional cone-beam computed tomography
bone-anchored maxillary protraction protocol in Class models. Am J Orthod Dentofacial Orthop 2006;129:611-8.
III growing patients showed significant maxillary and zy- 14. Kim JH, Viana MA, Graber TM, Omerza FF, BeGole EA. The effec-
gomatic protraction with hardly any skeletal rotational tiveness of protraction face mask therapy: a meta-analysis. Am J
changes or dental compensation of the maxillary inci- Orthod Dentofacial Orthop 1999;115:675-85.
15. Nartallo-Turley PE, Turley PK. Cephalometric effects of combined
sors. The soft-tissue changes were also significant and
palatal expansion and facemask therapy on Class III malocclusion.
comparable, although evident only at the level of the Angle Orthod 1998;68:217-24.
upper lip. 16. Pangrazio-Kulbersh V, Berger J, Kersten G. Effects of protraction
mechanics on the midface. Am J Orthod Dentofacial Orthop
We thank Camilla J. Tulloch and Hong Tu Zhu for 1998;114:484-91.
their assistance on the project and the National Institute 17. Baccetti T, McGill JS, Franchi L, McNamara JA Jr, Tollaro I. Skeletal
of Dental and Craniofacial Research and American Asso- effects of early treatment of Class III malocclusion with maxillary
ciation of Orthodontists Foundation for their support. expansion and face-mask therapy. Am J Orthod Dentofacial Or-
thop 1998;113:333-43.
18. Teuscher U. An appraisal of growth and reaction to extraoral an-
chorage: simulation of orthodontic-orthopedic results. Am J Or-
REFERENCES
thod 1986;89:113-21.
1. Baik HS. Clinical results of the maxillary protraction in Korean chil- 19. Liou EJ. Effective maxillary orthopedic protraction for growing
dren. Am J Orthod Dentofacial Orthop 1995;108:583-92. Class III patients: a clinical application simulates distraction osteo-
2. Kapust AJ, Sinclair PM, Turley PK. Cephalometric effects of face genesis. Prog Orthod 2005;6:154-71.
mask/expansion therapy in Class III children: a comparison of three 20. Wang YC, Chang PM, Liou EJ. Opening of circumaxillary sutures by
age groups. Am J Orthod Dentofacial Orthop 1998;113:204-12. alternate rapid maxillary expansions and constrictions. Angle Or-
3. Takada K, Petdachai S, Sakuda M. Changes in dentofacial mor- thod 2009;79:230-4.
phology in skeletal Class III children treated by a modified maxil- 21. Melsen B. Palatal growth studied on human autopsy material.
lary protraction headgear and a chin cup: a longitudinal A histologic microradiographic study. Am J Orthod 1975;68:
cephalometric appraisal. Eur J Orthod 1993;15:211-21. 42-54.
4. Singer SL, Henry PJ, Rosenberg I. Osseointegrated implants as an 22. Jackson GW, Kokich VG, Shapiro PA. Experimental and postexper-
adjunct to facemask therapy: a case report. Angle Orthod 2000; imental response to anteriorly directed extraoral force in young
70:253-62. Macaca nemestrina. Am J Orthod 1979;75:318-33.
5. Enacar A, Giray B, Pehlivanoglu M, Iplikcioglu H. Facemask ther- 23. Zhao N, Xu Y, Chen Y, Xu Y, Han X, Wang L. Effects of Class III
apy with rigid anchorage in a patient with maxillary hypoplasia magnetic orthopedic forces on the craniofacial sutures of rhesus
and severe oligodontia. Am J Orthod Dentofacial Orthop 2003; monkeys. Am J Orthod Dentofacial Orthop 2008;133:401-9.
123:571-7. 24. Baccetti T, De Clerck HJ, Cevidanes LHS, Franchi L. Morpho-
6. Kircelli BH, Pektas ZO. Midfacial protraction with skeletally an- metric analysis of treatment effects of bone-anchored maxillary
chored face mask therapy: a novel approach and preliminary re- protraction in growing Class III patients. Eur J Orthod 2011;
sults. Am J Orthod Dentofacial Orthop 2008;133:440-9. 33:121-5.
December 2011 Vol 140 Issue 6 American Journal of Orthodontics and Dentofacial OrthopedicsYou can also read