TACKLING SMOKER MISPERCEPTIONS ABOUT E-CIGARETTES USING EXPERT VIDEOS MADELEINE SVENSON1,2, JAMES GREEN1 AND OLIVIA M. MAYNARD1 - PSYARXIV
←
→
Page content transcription
If your browser does not render page correctly, please read the page content below

1              Tackling Smoker Misperceptions about E-cigarettes using Expert Videos

2                     Madeleine Svenson1,2, James Green1 and Olivia M. Maynard1

3       1
            Department of Psychology at the University of Bath, UK

4       2
            School of Psychological Science and MRC Integrative Epidemiology Unit (IEU) at the

5           University of Bristol, UK

6

7           Corresponding author: olivia.maynard@bristol.ac.uk

8           Word count: 3,286

    1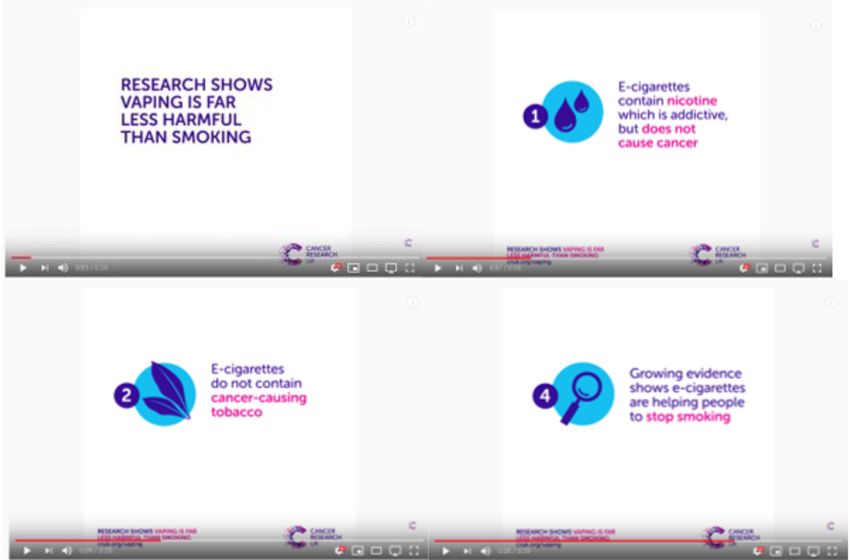
9                                               Abstract

10   Background: The pervasive misperception that e-cigarettes are equally or more harmful

11   than combustible cigarettes is a barrier to current smokers switching to e-cigarettes. To

12   tackle misperceptions, public health bodies are using informational videos, although their

13   efficacy is unknown. Methods: In our online study, current UK smokers who do not vape

14   (n=382) were randomised to view either: 1) a Cancer Research UK (CRUK) text-only

15   video; 2) a video featuring leading e-cigarette experts (expert); or 3) a no video control

16   condition, and then completed questions regarding e-cigarette harm perceptions. Results:

17   Compared to the control condition, participants in the CRUK condition and especially those

18   in the expert condition had more accurate harm perceptions of e-cigarettes and had more

19   accurate knowledge of e-cigarette constituents. In the expert condition, 67% of individuals

20   reported they would try an e-cigarette in a future quit attempt, compared with 51% in the

21   CRUK condition and 35% in the control condition. Conclusions: Our findings are

22   encouraging in the face of mounting evidence that e-cigarette misperceptions are

23   increasing. Whilst misperceptions are often characterised as resistant to correction, we find

24   that carefully designed public health information videos have the potential to promote a

25   more accurate, informed view of e-cigarettes and encourage intended e-cigarette usage.

26   Importantly, we find this among current smokers who do not vape, a group often reported

27   as having the highest levels of misperceptions and as having the most to gain from accurate

28   e-cigarette perceptions.

29       Keywords: e-cigarettes; vaping; harm perceptions; risk perceptions; attitudes and beliefs;

30       misperceptions

31

     2
32 Implications
33 There is mounting evidence that e-cigarette misperceptions are increasing, particularly
34 among smokers who do not vape, a group who have most to gain from accurate information
35 about e-cigarettes. Misperceptions are often characterised as difficult to change and there is
36 relatively little research on how to correct e-cigarette misperceptions. Our research shows
37 that e-cigarette misperceptions can be corrected by using carefully constructed expert
38 videos. This work has important implications for the development and dissemination of
39 these important messages.
40
341 1. Introduction
42 E-cigarettes represent an opportunity to stop tobacco use for many smokers. They carry
43 a fraction of the harm of combustible cigarettes 1 and meta-analyses have shown they have
44 higher quit rates than typical smoking cessation methods 2. E-cigarettes therefore represent
45 both an effective smoking cessation technique and a reduced harm alternative to smoking.
46 Despite this, e-cigarettes are still met with widespread uncertainty by smokers. A
47 Public Health England report estimates that 40% of smokers have never tried an e-cigarette,
48 often due to misperceptions surrounding their safety 1. Over time, these misperceptions
49 appear to be becoming more prominent. Between 2014 and 2019, the proportion of English
50 smokers who correctly believed e-cigarettes were less harmful than cigarettes reduced from
51 45% to 34% 3. This pattern is mirrored in the US 4 and inaccurate harm perceptions are
52 most common among smokers who do not vape 3. Therefore there is an important public
53 health need to challenge these widespread misperceptions.
54 Care must be taken when designing and disseminating corrective information. A
55 meta-analysis of the misinformation literature finds that corrective information is rarely
56 fully effective and misinformation often persists debunking 5. Indeed, misinformation still
57 influences decisions after corrections are acknowledged, and more concerningly, corrective
58 information often backfires, accidently reinforcing the misperceptions it is designed to
59 challenge 6–10. Given these complexities, corrective information must be carefully
60 constructed, and its efficacy established, ideally before public dissemination. This is
61 especially important to avoid any backfire effects that would render any informational
62 campaign counterproductive.
63 There have been numerous public health campaigns designed to better educate the
64 public and challenge misperceptions surrounding e-cigarettes and there is some indication
65 that these are effective. Among US adult smokers, self-reported exposure to accurate e-
466 cigarette information was associated with lower e-cigarette harm perceptions 11. Perceived
67 source credibility has also been shown to be related to more positive e-cigarette attitudes 12.
68 Indeed, expert consensus and source credibility are known to be useful tools for correcting
69 misperceptions 13,14.
70 There is a need to test the efficacy of corrective public health information to ensure
71 that they are having a measurable effect in the desired direction. Here we examine the
72 impact of informational videos from trusted, expert sources on e-cigarette harm perceptions
73 among current smokers who do not vape. From a public health perspective, it is most
74 important to study the impact of these videos among this group, as their health would
75 benefit the most from switching to e-cigarettes and they report the highest endorsement of
76 e-cigarette misperceptions 3.
77 We hypothesised that participants who viewed information campaigns from trusted
78 sources (either Cancer Research UK or a panel of scientific experts) would have fewer
79 misperceptions about e-cigarettes than those who do not view any campaigns. Moreover, a
80 video campaign with leading experts will be more effective at reducing misperceptions than
81 the text-only animated video campaign by CRUK. This study differs from the majority of
82 previous work in this field, which typically uses a single item measure of perceived harm 15.
83 Here we use multiple items, as has been recommended, to increase the validity of this
84 measure 16. This also allows us to 1) identify the specific misbeliefs that underpin negative
85 perceptions towards e-cigarettes in smokers, so that these can be individually targeted in
86 future public information campaigns, and 2) explore the impact of the informational
87 campaigns on specific harm perception beliefs, giving us a more detailed picture of the
88 efficacy of pre-existing informational campaigns.
89 2. Method
590 2.1. Design and Overview
91 We conducted an online between-subjects experimental study in February 2020 with
92 UK smokers who do not use e-cigarettes (i.e., do not vape). Participants were randomised
93 into one of three conditions: CRUK video; expert video; or a no message control. Harm
94 perceptions were the primary outcome measure. We published the study protocol on the
95 Open Science Framework prior to starting testing and this includes more information about
96 the study methods and the analysis plan (https://osf.io/ja34v/).
97 2.2. Participants
98 Our sample size calculation indicated that we needed 390 participants to observe a
99 small effect size (f=0.20) with 95% power and an alpha level of 5%. We recruited an equal
100 number of males and female participants opportunistically through Prolific, an online
101 crowdsourcing platform. Participants were at least 18 years of age, lived in the UK and self-
102 reported that they smoked daily and did not vape (classified as using an e-cigarette less than
103 monthly). Participants were reimbursed 13p for completing a short pre-screening survey.
104 Eligible participants were invited to participate in the main, 10 minute experiment on
105 Qualtrics for which they were reimbursed £1.30. The study was approved by the Faculty of
106 Science Research Ethics Committee at the University of Bristol (reference: 23051753685).
107 2.3. Materials and Measures
108 The pre-registered protocol provides a detailed description of all measures
109 (https://osf.io/ja34v/).
110 2.3.1. Experimental Stimuli – E-cigarette Videos
111 We used existing video information campaigns as stimuli in the CRUK and expert
112 conditions. Participants randomly assigned to the CRUK condition saw a video published
113 by CRUK (video stills in the Supplementary Materials and viewable at
6114 https://www.youtube.com/watch?v=9BEdv7UTDBA&feature=emb_logo). CRUK is the
115 world’s largest independent cancer charity, fundraising over half a billion in the financial
116 year ending March 2019 18,19. In 2013, CRUK was voted the most trusted charity in the UK
117 20
. The CRUK video is a text based animated video lasting 30 seconds. It included CRUK’s
118 logo and simple pictograms, alongside the following statements: 1) Research shows vaping
119 is far less harmful than smoking; 2) E-cigarettes contain nicotine, which is addictive, but
120 does not cause cancer; 3) E-cigarettes do not contain cancer-causing tobacco; 4) Passively
121 breathing vapour from e-cigarettes is unlikely to be harmful; 5) Growing evidence shows e-
122 cigarettes are helping people to stop smoking.
123 Participants who were randomly assigned to the expert condition viewed a video (2
124 minutes 20 seconds) published by the National Centre for Smoking Cessation and Training
125 (NCSCT) in association with the New Nicotine Alliance and part funded by Public Health
126 England (viewable at https://www.youtube.com/watch?v=SSn5ZZQkzKs or alternatively
127 see the Supplementary Materials for a transcript and video stills). The video features four
128 leading experts who address common e-cigarette misperceptions. These include: the
129 contents of e-cigarette vapour and combustible cigarette smoke; e-cigarette use as a
130 smoking cessation technique; the ‘gateway’ theory and the relative safety of vaping
131 compared to smoking combustible cigarettes.
132 2.3.2. Perceptions of E-cigarettes
133 Participants reported e-cigarette harm perceptions using a 7-point scale, with 1
134 representing ‘strongly agree’ and 7 representing ‘strongly disagree’, with an additional
135 ‘don’t know’ option. We asked what we call ‘general harm reduction statements’: 1) I know
136 enough about e-cigarettes to have formed accurate opinions; 2) e-cigarettes are harmful, 3)
137 e-cigarettes are less harmful than combustible cigarettes; 4) e-cigarettes are a helpful tool
138 for people who want to quit smoking; 5) there is convincing scientific evidence that e-
7139 cigarettes are safe, 6) there is convincing scientific evidence that e-cigarettes are safer than
140 smoking. We also asked what we called ‘specific harm reduction statements’: 7) the health
141 risks of smoking come from tar in combustible cigarettes; 8) the health risks of smoking
142 come from nicotine in combustible cigarettes; 9) e-cigarettes often contain tar; 10) e-
143 cigarettes often contain chemicals that are harmful to the user’s health; 11) there is a high
144 risk of harmful accidents when using e-cigarettes; 12) second-hand e-cigarette vapour can
145 expose others to harm; 13) e-cigarettes normalise smoking, making more young people take
146 up smoking.
147 We also asked participants for their biggest concern about e-cigarettes, with the options
148 ‘their harmful contents’, ‘their addictiveness’, ‘the potential for freak accidents’, ‘their
149 harm to others’, ‘they are normalising smoking for young people’ and ‘other’ with an
150 option for them to provide details.
151 2.3.3. Smoking and Vaping Behaviour
152 Participants were asked about their frequency of cigarette and e-cigarette use, the
153 number of cigarettes smoked per day and the number of serious smoking quit attempts they
154 had made. Participants also completed the Quitting Smoking Contemplation Ladder 21 and
155 the Fagerström Test of Nicotine Dependence 22.
156 To assess intentions to use an e-cigarette, participants were asked: ‘Do you think that
157 you will try an e-cigarette / vaping device soon?’ and ‘My future quit attempts will involve
158 an e-cigarette / vaping device’, with the options ‘definitely not’, ‘probably not’, ‘probably
159 yes’ and ‘definitely yes’.
160 2.3.4. Demographics
161 Participants reported their age, location in the UK, gender, level of education,
162 university student status, ethnicity and type of occupation.
163 2.3.5. Attention Checks
8164 Immediately after watching the video (or after consent for the control condition),
165 participants were asked ‘From who did you just watch a video’ with the options 1) Cancer
166 Research UK, 2) British Heart Foundation, 3) A panel of experts and 4) I did not watch a
167 video, with the correct answer dependent on their condition.
168 An additional attention check item was presented at random within the attitudes to
169 vaping questions, where participants were asked to ‘respond with Strongly Agree’.
170 2.4. Procedure
171 After providing informed consent, participants provided their Prolific ID, and then
172 were randomised (via Qualtrics) to one of the three conditions. Immediately prior to
173 watching the videos, participants were instructed to ensure they were in a location they
174 could listen to and watch the videos and were informed that they must pay close attention
175 as they would be asked questions about them afterwards. Participants in the control
176 condition were asked to tick a box saying that they would answer the following questions
177 carefully.
178 Participants then completed the video attention check and then completed the questions
179 on perceptions of e-cigarettes, smoking and vaping behaviour and demographics.
180 Participants then had an opportunity to provide any comments or questions in a free-text
181 box and were then debriefed (with all participants provided with links to the two videos)
182 and redirected to Prolific for reimbursement.
183 2.5. Statistical Analysis Plan
184 We removed from the analyses any participants who failed either of the attention check
185 questions. Planned one-way ANOVAs were run on the mean responses to each e-cigarette
186 harm perception measure, with ‘don’t know’ responses removed from these analyses.
187 For the question regarding participants’ biggest concern about e-cigarettes, responses were
9188 counted to reveal the greatest concerns and we supplemented this with an assessment of the
189 free text responses. For behavioural intentions related to using an e-cigarette in the future,
190 we used chi-squared analyses to examine the difference in proportion of participants in each
191 condition who reported that they either ‘probably’ or ‘definitely’ would use an e-cigarette
192 in the future and would use one in a future quit attempt.
193 3. Results
194 The data and analysis code that form the basis of the results presented here are
195 available from the University of Bristol Research Data Repository
196 (http://data.bris.ac.uk/data/), DOI : INSERT UPON ACCEPTANCE.
197 3.1 Characteristics of Participants
198 Detailed participant characteristics are shown in Table 1 and in Supplementary Table 1.
199 There were 433 participants who completed the experiment, 26 were excluded for not being
200 daily smokers and less than monthly vapers, and 25 were excluded for failing either of the
201 attention checks. This left a total of 382 participants (control n=132, CRUK, n=121, expert,
202 n=129).
203 INSERT TABLE 1 HERE
204 3.2 E-cigarette Harm Perceptions
205 There was a main effect of experimental condition on each of the 13 harm perception
206 measures (see Figures 1 and 2 for results including test statistics). Differences between
207 conditions were in the expected direction – that is, we observed the lowest e-cigarette harm
208 perceptions among those in the expert condition, followed by the CRUK condition, with
209 those in the control condition with the highest e-cigarette harm perceptions. Post-hoc
210 comparisons (Supplementary Table 2) indicated that there were large differences between
10211 the expert and control conditions for all harm perception measures. There were also large 212 differences in the expected direction between the CRUK and control and between expert 213 and CRUK conditions for most harm perception measures. 214 INSERT FIGURES 1 AND 2 HERE 215 3.3 Biggest Concerns about E-cigarettes 216 Table 2 presents participants’ biggest concerns about e-cigarettes. A smaller percentage 217 of those in the expert condition (21%) reported that their biggest concern was the harmful 218 contents of e-cigarettes, compared to 36% in the CRUK and 44% in the control condition. 219 Of the 72 individuals reporting ‘other’ as their main concern, 64 provided further 220 qualitative information. Coding of these responses suggested the primary concern was 221 epistemic limitations. Of the 28 participants expressing these concerns about the state of 222 knowledge, 12 specifically expressed concern about the long-term safety of e-cigarettes 223 being unknown. The second most reported ‘other’ concern (n=8) was the notion that e- 224 cigarettes do not promote nicotine abstinence and may encourage dual use. Another 225 commonly reported concern was that e-cigarettes were an inadequate replacement, which 226 did not provide the same satiety or enjoyment as cigarettes. 227 3.4 Behavioural Intentions 228 The videos also impacted participants’ behavioural intentions regarding e-cigarettes. 229 The chi-squared analysis indicated an association between condition and people reporting 230 that they would try e-cigarettes in the future (X2 (2, N=382)=32.5, p
235        There was also a small association between condition and participants reporting they

236   would use e-cigarettes in a future quit attempt (X2(2, N= 382)=41.61, p
260           However, not all of the information in the videos translated to changes in harm

261   perceptions. The misbelief that the health risks of smoking are due to nicotine did not differ

262   between the CRUK and control condition, although the CRUK video states ‘E-cigarettes

263   contain nicotine, nicotine is addictive but does not cause cancer’. In contrast, the expert

264   video states ‘People die from the tar, the other constituents of smoke, but not the nicotine.

265   So the nicotine isn’t the harmful component’ and in this condition we did see a large

266   decrease in endorsement of the statement that nicotine in cigarettes causes health risks. The

267   divergent results may be due to differences in the video format, such as expertise, or

268   speaking versus text. Alternatively, the effect may be driven by the semantic differences

269   between “not addictive” and “not harmful”, or perhaps by explicitly ascribing the harm to

270   the tar. As our methodology does not identify which specific aspect of the video drives the

271   positive changes to harm perceptions of e-cigarettes, this would be an interesting avenue for

272   future research.

273           We also investigated smokers’ biggest concerns about e-cigarettes. Of the list we

274   provided, concerns about the constituents of e-cigarettes was common. However, many

275   participants reported other concerns that were not on our list, notably the limits of our

276   knowledge about e-cigarettes, including concerns about the long-term health consequences

277   of e-cigarettes. Along with our detailed information about 13 different potential

278   misperceptions, our research adds to the literature which characterises the nature and extent

279   of e-cigarette misperceptions among adult smokers 26. This should be used to inform future

280   public health informational videos.

281        There is considerable concern about these misperceptions, as misinformation is often

282   conceptualised as being resistant to correction. Misperceptions are often maintained and

283   entrenched through motivated reasoning, with counter-attitudinal information typically

284   dismissed 5. The effectiveness of correction is therefore determined in part by the

      13
285 receptivity of the target audience to change 27. Although there is now considerable evidence
286 on the presence of e-cigarette misperceptions among smokers 3,16,25, relatively little research
287 has examined how to correct these misperceptions. Our research not only finds that
288 misperceptions can be corrected, but that this can be achieved among non-vapers (79%
289 reported never vaping), a group for whom e-cigarette misinformation is greatest 3 and who
290 have the most to gain from accurate e-cigarette knowledge. That we found meaningful
291 reductions in misbeliefs among this population is particularly encouraging and is a key
292 strength of our work.
293 There are, however, some important limitations to our work. First, our sample is not
294 representative of the UK, with white participants being over-represented, Second, we
295 measured behavioural intentions, rather than actual vaping behaviours. Whilst intentions
296 are informative, they do not always directly translate into behaviour and future work could
297 assess e-cigarette uptake one month later. Third, as we wanted to assess the impact of
298 currently available e-cigarette videos, the content of these was not standardised. This means
299 we are unable to make firm conclusions about which components of these videos (e.g.,
300 video length, the presence of experts, the content or the semantics of what was said/written
301 etc) had the greatest influence on perceptions. Finally and importantly, our study uses a
302 forced exposure paradigm which lacks ecological validity and therefore limits the
303 conclusions we can draw about the effectiveness of these videos outside of our experiment.
304 Health communication campaigns must reach their target audience to be effective 28 and it
305 is likely that under naturalistic conditions, the vast majority of our target sample of non-
306 vaping smokers may not even become aware of the videos, let alone watch them in their
307 entirety whilst paying close attention. Indeed, Festinger’s theory of cognitive dissonance
308 suggests that counter-attitudinal information is aversive, so individuals may avoid videos
309 such as these that challenge their beliefs and behaviours 29,30. This self-selection of media
14310 content is becoming increasingly common due to the proliferation of health information on
311 the internet 31. However, as of January 2021, the CRUK video has received 9,855 views and
312 the expert video 21,736 views. Given we find that both videos can reduce misperceptions
313 when close attention is paid to them, consideration of how to increase engagement,
314 particularly among target groups is important. This may include paying for these videos to
315 appear as advertisements either online on video streaming platforms or on television.
316 To conclude, we find that short informational videos can reduce e-cigarette harm
317 perceptions and increase intentions to use e-cigarettes among current smokers who do not
318 vape. A video which uses experts to debunk common myths was particularly effective. Our
319 results are encouraging in the face of mounting evidence that e-cigarette misperceptions are
320 increasing. Whilst research finds that misinformation is often resistant to correction, we
321 find that attitude change in this domain is possible, at least when we use carefully designed
322 public health campaigns. Future research should consider which features of these videos are
323 most influential in changing misperceptions, the extent to which the videos result in long-
324 term changes in behaviour and how we can encourage our key target groups to watch and
325 engage with this important misperception-bunking content.
326
15327 References
328 1. Mcneill A, Brose LS, Calder R, Bauld L, Robson D. Vaping in England; an Evidence
329 Update.; 2019.
330 2. Hartmann-Boyce J, McRobbie H, Lindson N, et al. Electronic cigarettes for smoking
331 cessation. Cochrane Database Syst Rev. 2020;(10).
332 3. McNeill A, Brose L, Calder R, Bauld L, Robson D. Vaping in England: an evidence
333 update including mental health and pregnancy, March 2020. Public Health Engl Lond
334 UK. Published online 2020.
335 4. Huang J, Feng B, Weaver SR, Pechacek TF, Slovic P, Eriksen MP. Changing
336 perceptions of harm of e-cigarette vs cigarette use among adults in 2 US national
337 surveys from 2012 to 2017. JAMA Netw Open. 2019;2(3):e191047-e191047.
338 5. Chan M-PS, Jones CR, Hall Jamieson K, Albarracín D. Debunking: A meta-analysis of
339 the psychological efficacy of Messages Countering Misinformation. Psychol Sci.
340 2017;28(11):1531-1546. doi:10.1177/0956797617714579
341 6. Cook J, Lewandowsky S. The Debunking Handbook. University of Queensland; 2011.
342 7. Lewandowsky S, Ecker UKH, Seifert CM, Schwarz N, Cook J. Misinformation and tts
343 correction: Continued influence and successful debiasing. Psychol Sci Public Interest
344 Suppl. 2012;13(3):106-131. doi:10.1177/1529100612451018
345 8. Nyhan B, Reifler J. When corrections fail: The persistence of political misperceptions.
346 Polit Behav. 2010;32(2):303-330. doi:10.1007/s11109-010-9112-2
347 9. Schwarz N, Newman E, Leach W. Making the truth stick & the myths fade: Lessons
348 from cognitive psychology. Behav Sci Policy. 2016;2(1):85-95.
349 doi:10.1353/bsp.2016.0009
350 10. Lewandowsky S, Ecker UKH, Cook J. Beyond misinformation: Understanding and
351 coping with the “post-truth” era. J Appl Res Mem Cogn. 2017;6(4):353-369.
352 doi:10.1016/j.jarmac.2017.07.008
353 11. Blake KD, Rutten LFJ, Grana RA, et al. Information Exposure about E-cigarettes
354 Predicts Reduced Harm Perceptions and E-cigarette Use among Adult Smokers in the
355 US. Tob Regul Sci. 2015;1(3):265-275. doi:10.18001/trs.1.3.8
356 12. Case KR, Lazard AJ, Mackert MS, Perry CL. Source Credibility and E-Cigarette
357 Attitudes: Implications for Tobacco Communication. Health Commun.
358 2018;33(9):1059-1067. doi:10.1080/10410236.2017.1331190
359 13. Wilson EJ, Sherrell DL. Source effects in communication and persuasion research: A
360 meta-analysis of effect size. J Acad Mark Sci. 1993;21(2):101-112.
361 doi:10.1007/BF02894421
362 14. Van Der Linden SL, Clarke CE, Maibach EW. Highlighting consensus among medical
363 scientists increases public support for vaccines: Evidence from a randomized
16364 experiment Health behavior, health promotion and society. BMC Public Health.
365 2015;15(1):1207. doi:10.1186/s12889-015-2541-4
366 15. Kaufman AR, Persoskie A, Twesten J, Bromberg J. A review of risk perception
367 measurement in tobacco control research. Tob Control. 2020;29(Suppl 1):s50-s58.
368 16. Wackowski OA, Jeong M. Comparison of a General and Conditional Measure of E-
369 Cigarette Harm Perceptions. Int J Environ Res Public Health. 2020;17(14):5151.
370 17. Gibson LA, Creamer MR, Breland AB, et al. Measuring perceptions related to e-
371 cigarettes: Important principles and next steps to enhance study validity. Addict Behav.
372 2018;79:219-225.
373 18. May M. CRUK fundraising income tops half a billion pounds | UK Fundraising.
374 Published July 22, 2019. Accessed May 29, 2020.
375 https://fundraising.co.uk/2019/07/22/cruk-fundraising-income-tops-half-a-billion-
376 pounds/
377 19. Guardian. World’s biggest cancer charity formed | Society | The Guardian. Published
378 January 4, 2002. Accessed May 29, 2020.
379 https://www.theguardian.com/society/2002/feb/04/charities.charitymanagement
380 20. Pudelek J. Cancer Research UK is the charity most people trust, survey finds | Third
381 Sector. Published August 8, 2013. Accessed May 29, 2020.
382 https://www.thirdsector.co.uk/cancer-research-uk-charity-people-trust-survey-
383 finds/communications/article/1194404
384 21. Biener L, Abrams DB. The Contemplation Ladder: validation of a measure of readiness
385 to consider smoking cessation. Health Psychol. 1991;10(5):360.
386 22. Heatherton TF, Kozlowski LT, Frecker RC, FAGERSTROM K-O. The Fagerström test
387 for nicotine dependence: a revision of the Fagerstrom Tolerance Questionnaire. Br J
388 Addict. 1991;86(9):1119-1127.
389 23. Hajek P. Electronic cigarettes have a potential for huge public health benefit. BMC Med.
390 2014;12(1):225. doi:10.1186/s12916-014-0225-z
391 24. Fiore MC, Schroeder SA, Baker TB. Smoke, the Chief Killer — Strategies for Targeting
392 Combustible Tobacco Use. N Engl J Med. 2014;370(4):297-299.
393 doi:10.1056/NEJMp1314942
394 25. Brose LS, Brown J, Hitchman SC, McNeill A. Perceived relative harm of electronic
395 cigarettes over time and impact on subsequent use. A survey with 1-year and 2-year
396 follow-ups. Drug Alcohol Depend. 2015;157:106-111.
397 doi:10.1016/j.drugalcdep.2015.10.014
398 26. Morphett K, Herron L, Gartner C. Protectors or puritans? Responses to media articles
399 about the health effects of e-cigarettes. Addict Res Theory. 2020;28(2):95-102.
400 27. Atkin CK. Theory and principles of media health campaigns. Public Commun
401 Campaigns. 2001;3:49-67.
17402 28. Hornik RC. Public Health Communication: Evidence for Behavior Change. . Lawrence
403 Erlbaum Associates Publishers; 2002.
404 29. Schüz N, Ferguson SG. Australian smokers’ and nonsmokers’ exposure to antismoking
405 warnings in day-to-day life: A pilot study. Nicotine Tob Res. 2015;17(7):876-881.
406 doi:10.1093/NTR/NTU253
407 30. Festinger L. A Theory of Cognitive Dissonance. - PsycNET. Stanford University Press;
408 1957.
409 31. Cline RJ, Haynes KM. Consumer health information seeking on the Internet: The state
410 of the art. Health Educ Researcg. 2008;16(6):671-691. doi:10.1093/HER
411
412
18413 Author Contributions. Conceptualization, JG and OMM; methodology, JG and OMM;
414 formal analysis, MS; investigation, MS; data curation, MS; writing—original draft
415 preparation MS and JG; writing—review and editing, OMM; visualization, MS;
416 supervision, OMM; project administration, JG, MS, OMM; funding acquisition, OMM. All
417 authors have read and agreed to the published version of the manuscript.
418 Funding. This research was funded through an ESRC New Investigator’s Award, awarded
419 to OMM (ES/R003424/1).
420 Declaration of Interest. None
421
19422 Table 1. Participant characteristics
Participant Characteristic Participants Control (n=132) CRUK (n= 121) Expert (n=129)
(n=382)
Gender
Female 200 (52%) 61 (46%) 64 (53%) 75 (58%)
Male 182 (48%) 71 (54%) 57 (47%) 54 (42%)
Age 38.5 (SD±11.8) 40.3 (SD±12.0) 37.9 (SD±11.3) 37.3 (SD±11.8)
Minimum cigarettes smoked per day last 2 9.0 (SD±16.2) 10.8 (SD±26.1) 8.2 (SD±6.7) 8.0 (SD±5.8)
months
Maximum cigarettes smoked per day last 2 29.6 (SD±153.7) 25.0 (SD±31.5) 43.5 (SD±271.1) 21.2 (SD±10.0)
months
Number of previous quit attempts 2.6 (SD±3.7) 2.6 (SD±3.2) 2.3 (SD±1.7) 2.9 (SD±5.2)
Nicotine Dependence (FTND) 4.5 (SD±1) 4.4 (SD±1.0) 4.5 (SD±1.0) 4.5 (SD±1.0)
Vaping Status
Vape less than monthly 80 (21%) 21 (16%) 28 (23%) 31 (24%)
Never vaped / vape less than monthly 302 (79%) 111 (84%) 93 (77%) 98 (76%)
423424 Table 2. Biggest concern about e-cigarettes
Biggest Concern about e-cigarettes Overall Control CRUK Expert
(n=382) (n=132) (n= 121) (n=129)
n (%) n (%) n (%) n (%)
Their harmful contents 129 (34) 58 (44) 44 (36) 27 (21)
The potential for freak accidents 67 (18) 15 (12) 18 (15) 34 (26)
Their addictiveness 66 (17) 15 (12) 26 (22) 25 (19)
They are normalising smoking for young people 47 (12) 20 (15) 13 (11) 14 (11)
Their harm to others 1 (0.3) 1 (0.8) 0 (0) 0 (0)
Other 72 (19) 23 (17) 20 (17) 29 (23)
425426
7
Experts CRUK Control
(1=Strongly agree, 7=Strongly disagree)
6
Mean Harm Perception Scores
5
4
3
2
1
427
428 E-cigarettes are a There is convincing There is convincing I know enough E-cigarettes are less E-cigarettes are
helpful tool for scientific evidence scientific evidence about e-cigarettes harmful than harmful
429 people who want to that e-cigarettes are that e-cigarettes are to have formed combustible cigarettes
quit smoking safe safer than smoking accurate opinions
430
F(2,379) = 19, F(2,372) = 78.2, F(2,375) = 38.1, F(2,379) = 6, F(2,373) = 39.3, F(2,373) = 29.2,
431 p < 0.001, η2 = 0.91 p < 0.001, η2 = 0.30 p < 0.001, η2 = 0.17 p = 0.003, η2 = p < 0.001, η2 = 0.17 p < 0.001, η2 = 0.14
0.03
432 Figure 1. Mean response to general harm perception measures on a 7-point scale, split by video condition. 1 represents strongly agree and 7
represents strongly disagree. Therefore, higher means indicate higher disagreement with the harm perception statement. Error bars represent +/- 1
SE. “Do not know” responses were coded as missing. For each harm perception measure the results of a one-way ANOVA with eta squared are
displayed.7
Expert CRUK Control
(1=Strongly agree, 7=Strongly disagree)
6
Mean Harm Perception Scores
5
4
3
2
1
433
434
E-cigarettes often The health risks E-cigarettes There is a high Second-hand e- E-cigarettes The health risks
contain chemicals from smoking often contain tar risk of harmful cigarette vapour normalise of smoking come
that are harmful come from nicotine accidents when can expose smoking making from tar in
to user’s health in combustible using e-cigarettes others to harm more young combustible
cigarettes people take up cigarettes
smoking
F(2,348) = 40.8, F(2,370) = 28.6, F(2,347) = 21.5, F(2,360) = 36.3, F(2,333) = 33, F(2,373) = 14.1, F(2,371) = 12.8,
p < 0.001, η2 = p < 0.001, η2 =0.13 p< 0.001, η2 p< 0.001,η2 = p < 0.001, η2 p < 0.001, η2 p< 0.001, η2 =
0.19 =
0.11 0.17 =0.17 =0.07 0.07
Figure 2. Mean response to specific harm perception measures on a 7-point scale, split by video condition. 1 represents strongly agree and 7
represents strongly disagree. Therefore, higher means indicate higher disagreement with the harm perception statement. Error bars represent +/- 1
SE. “Do not know” responses were coded as missing. For each harm perception measure the results of a one-way ANOVA with eta squared are
displayed.435 Supplementary Materials
436
437
438
439
440
441
442
443
444
445
446
447 Supplementary Figure 1: Example stills from CRUK and expert videos (consent to publish
448 images of those pictured has been obtained).449 Expert Video transcript: 450 Text: E-cigarette safety: The facts explained 451 Speech: 452 John Britton Professor of Epidemiology University of Nottingham: Using e-cigarettes does 453 differ from tobacco in a very clear way which is that it doesn’t involve inhaling tobacco smoke, and 454 as the constituents of smoke are the things the kill smokers that has to be a good thing. 455 Ann McNeill Professor of Tobacco Addiction King College London: People die from the tar, the 456 other constituents of smoke, but not the nicotine. So the nicotine isn’t the harmful component and 457 electronic cigarettes allow smokers to get the nicotine without all the other harmful stuff that comes 458 along in cigarette smoke. 459 Robert West Professor of Health Psychology University College London: The first thing to note 460 when considering the safety of e-cigarettes is that the vast majority of e-cigarette users are people 461 who are either still smoking, and using them to cut down on the amount they smoke or have used 462 them to stop smoking. 463 John Britton: If we try to put a figure on the relative risk of electronic cigarettes compared with 464 smoking, my view us that it is going to be well under 5% of the risk possible slightly more for 465 cardiovascular disease but substantially less from chronic obstructive pulmonary disease and lung 466 cancer. 467 Robert West: When you look at the concentrations of and the nature of the toxins in cigarette 468 smoke, and then you compare that with e-cigarettes you see that really there’s no comparison. Most 469 of the toxins in cigarette smoke aren’t present at all in e-cigarettes vapour those that are present are 470 in concentration that are a hundred times less or more. 471 Linda Bauld Professor of Health Policy the University of Stirling: Some people say the advent of 472 electronic cigarettes is renormalizing tobacco smoking – so we see people using these devices, and 473 its making smoking more normal again. Interestingly we are just not seeing that in the data we have.
474   John Britton: All that it does is normalise electronic cigarette use. And if we could normalise

475   electronic cigarette use for the nearly 9 million people in the United Kingdom who are still addicted

476   to tobacco that could only be a good thing.

477   Robert West: I think it’s really important that people be reassured that e-cigarettes, whatever you

478   might see in the press (electronic cigarettes) are considerably safer than smoking and the evidence is

479   pretty good that they can be effective in helping people to stop (smoking).
480   Supplementary Table 1. Participant characteristics – continued
481
       Participant Characteristic                                                    All participants Control   CRUK       Expert
                                                                                     (n = 382)        (n=132)   (n= 121)   (n=129)
       Education
       Higher Education or professional/vocational equivalents                       134 (35%)       47 (36%)   42 (35%)   45 (35%)
       A-levels* or vocational level 3 or equivalents                                105 (28%)       38 (29%)   32 (26%)   35 (27%)
       GCSE/O-Level* grade A*-C, or vocational level 2 or equivalents                98 (26%)        34 (26%)   26 (22%)   38 30%)
       GCSE/O Level* grace C or below, or qualification at level 1 or below          28 (7%)         7 (5%)     13 (11%)   8 (6%)
       Other qualifications level unknown                                            9 (2%)          3 (2%)     6 (5%)     0 (0%)
       No qualifications                                                             8 (2%)          3 (2%)     2 (2%)     3 (2%)

       Student Status
       Students                                                                      20 (5%)         7 (5%)     6 (5%)     7 (5%)
            Undergraduate                                                            16 (4%)         4 (3%)     6 (5%)     6 (5%)
            Postgraduate                                                             4 (1%)          3 (2%)     0 (0%)     1 (1%)

       Profession of chief earner
       Higher managerial/ professional/ administrative (e.g.                         16 (4%)         7 (5%)     4 (3%)     5 (4%)
       Established doctor, Solicitor, Board Director in a large organisation (200+
       employees, top level civil servant/public service employee)
       Intermediate managerial/ professional/ administrative (e.g.                   71 (19%)        26 (20%)   23 (19%)   22 (17%)
       Newly qualified (under 3 years) doctor, Solicitor, Board director
       small organisation, middle manager in large organisation, principal officer
       in civil service/local government)
       Supervisory or clerical/ junior managerial/ professional/                     106 (28%)       34 (26%)   41 (34%)   31 (24%)
       administrative (e.g. Office worker, Student Doctor, Foreman with
       25+ employees, salesperson, etc.)18
       Student                                                                       7 (2%)          5 (26%)    2 (2%)     0 (0%)
       Skilled manual worker (e.g. Skilled Bricklayer, Carpenter,                    65 (17%)        18 (14%)   20 (17%)   27 (21%)
       Plumber, Painter, Bus/ Ambulance Driver, HGV driver, AA
       patrolman, pub/bar worker, etc.)
2 of 30
Semi or unskilled manual work (e.g. Manual workers, all apprentices to be 59 (15%) 20 (15%) 16 (13%) 23 (18%)
skilled trades, caretaker, parker keeper, non-HGV driver, shop assistant)
Casual worker – not in permanent employment 2 (1%) 2 (2%) 0 (0%) 0 (0%)
Housewife/ Homemaker 7 (2%) 3 (2%) 1 (1%) 3 (2%)
Retired and living on state pension 9 (2%) 5 (4%) 2 (2%) 2 (2%)
Unemployed or not working due to long-term sickness 36 (9%) 10 (8%) 11 (9%) 15 (12%)
Full-time carer of another household member 4 (1%) 2 (2%) 1 (1%) 1 (1%)
Ethnicity
English/Welsh/Scottish/Northern Irish/British 330 (86%) 114 (86%) 103 (85%) 113 (88%)
White other 26 (7%) 9 (7%) 8 (7%) 9 (7%)
White and Black Caribbean 5 (1%) 1 (0.3%) 3 (0.8%) 1 (0.3%)
White Asian 4 (1%) 1 (0.3%) 1 (0.3%) 2 (0.5%)
Caribbean 4 (1%) 1 (0.3%) 1 (0.3%) 2 (0.5%)
Indian 3 (0.8%) 2 (0.5%) 1 (0.3%) 0 (0%)
Pakistani 3 (0.8%) 1 (0.3%) 1 (0.3%) 1 (0.3%)
Other Asian background 2 (0.5%) 1 (0.3%) 1 (0.3%) 0 (0%)
African 2 (0.5%) 1 (0.3%) 0 (0%) 1 (0.3%)
Irish 1 (0.3%) 0 (0%) 1 (0.3%) 0 (0%)
Chinese 1 (0.3%) 0 (0%) 1 (0.3%) 0 (0%)
Any other ethnic group 1 (0.3%) 1 (0.3%) 0 (0%) 0 (0%)
482 * A-Levels are UK school exams usually taken age 16-18. GCSEs/O-levels are UK school exams usually taken age 14-16.483 Supplementary Table 2. Games Howell post-hoc contrasts comparing mean harm perception scores between conditions
Control compared to expert Control compared to CRUK CRUK compared to expert
(control – expert) (control – CRUK) (CRUK – expert)
MD SE p d MD SE p d MD SE p d
General Harm Perception Measures
E-cigarettes are a helpful tool for people who want to 0.9 0.12 of 30 The health risks of smoking come from the tar in 0.7 0.1
You can also read