Determining the level of social distancing necessary to avoid future COVID 19 epidemic waves: a modelling study for North East London - Nature
←
→
Page content transcription
If your browser does not render page correctly, please read the page content below
www.nature.com/scientificreports
OPEN Determining the level of social
distancing necessary to avoid
future COVID‑19 epidemic waves:
a modelling study for North East
London
Nathan Cheetham1,7, William Waites 2, Irene Ebyarimpa1, Werner Leber 3
,
Katie Brennan1 & Jasmina Panovska‑Griffiths 4,5,6,7*
Determining the level of social distancing, quantified here as the reduction in daily number of
social contacts per person, i.e. the daily contact rate, needed to maintain control of the COVID-19
epidemic and not exceed acute bed capacity in case of future epidemic waves, is important for future
planning of relaxing of strict social distancing measures. This work uses mathematical modelling to
simulate the levels of COVID-19 in North East London (NEL) and inform the level of social distancing
necessary to protect the public and the healthcare demand from future COVID-19 waves. We used a
Susceptible-Exposed-Infected-Removed (SEIR) model describing the transmission of SARS-CoV-2
in NEL, calibrated to data on hospitalised patients with confirmed COVID-19, hospital discharges
and in-hospital deaths in NEL during the first epidemic wave. To account for the uncertainty in both
the infectiousness period and the proportion of symptomatic infection, we simulated nine scenarios
for different combinations of infectiousness period (1, 3 and 5 days) and proportion of symptomatic
infection (70%, 50% and 25% of all infections). Across all scenarios, the calibrated model was used to
assess the risk of occurrence and predict the strength and timing of a second COVID-19 wave under
varying levels of daily contact rate from July 04, 2020. Specifically, the daily contact rate required
to suppress the epidemic and prevent a resurgence of COVID-19 cases, and the daily contact rate
required to stay within the acute bed capacity of the NEL system without any additional intervention
measures after July 2020, were determined across the nine different scenarios. Our results caution
against a full relaxing of the lockdown later in 2020, predicting that a return to pre-COVID-19 levels
of social contact from July 04, 2020, would induce a second wave up to eight times the original
wave. With different levels of ongoing social distancing, future resurgence can be avoided, or the
strength of the resurgence can be mitigated. Keeping the daily contact rate lower than 5 or 6,
depending on scenarios, can prevent an increase in the number of COVID-19 cases, could keep the
effective reproduction number Re below 1 and a secondary COVID-19 wave may be avoided in NEL.
A daily contact rate between 6 and 7, across scenarios, is likely to increase Re above 1 and result in
a secondary COVID-19 wave with significantly increased COVID-19 cases and associated deaths,
but with demand for hospital-based care remaining within the bed capacity of the NEL health and
care system. In contrast, an increase in daily contact rate above 8 to 9, depending on scenarios, will
likely exceed the acute bed capacity in NEL and may potentially require additional lockdowns. This
scenario is associated with significantly increased COVID-19 cases and deaths, and acute COVID-19
care demand is likely to require significant scaling down of the usual operation of the health and care
1
Financial Strategy Team, NHS North East London Commissioning Alliance, London, UK. 2School of Informatics,
University of Edinburgh, Edinburgh, UK. 3Centre for Clinical Effectiveness and Health Data Science, Institute of
Population Health Sciences, Barts School of Medicine and Dentistry, Queen Mary University of London, London,
UK. 4Department of Applied Health Care, Institute of Epidemiology & Health Care, University College London,
London, UK. 5Institute for Global Health, University College London, London, UK. 6The Wolfson Centre for
Mathematical Biology and The Queen’s College, University of Oxford, Oxford, UK. 7These authors contributed
equally: Nathan Cheetham and Jasmina Panovska-Griffiths. *email: j.panovska-griffiths@ucl.ac.uk
Scientific Reports | (2021) 11:5806 | https://doi.org/10.1038/s41598-021-84907-1 1
Vol.:(0123456789)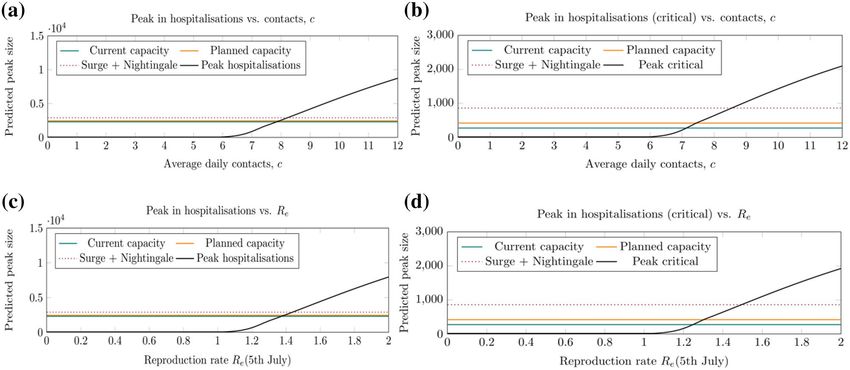
www.nature.com/scientificreports/
Figure 1. (a) NHS Clinical Commissioning Group (CCG) London boundaries, with North East London CCGs
highlighted. (b) Number of confirmed cases of COVID-19 for North East London Clinical Commissioning
Groups, up to 3rd August 2 0203. (c) Number of deaths due to COVID-19 for North East London Clinical
ugust4.
Commissioning Groups, for deaths that occurred up to 24th July, registered up to 1st A
system and should be avoided. Our findings suggest that to avoid future COVID-19 waves and to
stay within the acute bed capacity of the NEL health and care system, maintaining social distancing
in NEL is advised with a view to limiting the average number of social interactions in the population.
Increasing the level of social interaction beyond the limits described in this work could result in future
COVID-19 waves that will likely exceed the acute bed capacity in the system, and depending on the
strength of the resurgence may require additional lockdown measures.
The world remains in the grip of the COVID-19 pandemic caused by the Severe Acute Respiratory Syndrome-
Coronavirus 2 (SARS-CoV-2). Transmission of SARS-CoV-2 is thought to occur primarily via the transfer of viral
droplets during close contact between individuals, although fomites and aerosol infections have been r eported1.
As of August 07, 2020, and at the time of writing this paper, over 18.8 million cases and over 708,000 deaths have
been reported w orldwide2. In the UK, since the first two cases were reported on January 31, 2020, and the first
reported COVID-19 related death occurred on March 06, 2020, over 300,000 cases and almost 50,000 COVID-19
related deaths have been reported as of August 07, 20203.
The impact of COVID-19 on boroughs in North East London (NEL) (population size 2.1 million)4 has been
significantly higher than other parts of England and Wales. During the first wave of the epidemic, the boroughs
of Newham (144) and Hackney (127) had the highest and third-highest age-standardised mortality rate per
100,000 people in England and W ales5, while Tower Hamlets (123), Waltham Forest (93) and Barking and
Dagenham (89) also had death rates higher than both the averages for local authority areas across London (86)
and England and Wales (36).
The first case of COVID-19 in the region was reported on February 19, 2020, and the first COVID-19 asso-
ciated death was documented on March 06, 20203,6. Since then the local epidemic has spread rapidly with
7205 confirmed cases (up to August 03, 2020) and 1732 deaths (registered by August 01, 2020) associated with
COVID-19 across N EL3,6.
The NEL healthcare system comprises 3 ‘integrated care partnerships’ (ICPs), covering 7 constituent London
boroughs: (1) City of London and Hackney (combined in line with commissioning of health and care services by
City and Hackney Clinical Commissioning Group (CCG) and referred to throughout as City and Hackney), (2)
WEL: Waltham Forest; Newham; Tower Hamlets, (3) BHR: Barking and Dagenham; Havering; and Redbridge.
The population of each ICP is served principally by a different acute NHS trust, albeit with some overlap with
other areas: City & Hackney is served by Homerton University Hospital NHS Foundation Trust (HUT); WEL
is served by Barts Health NHS Trust (Barts); BHR is served by Barking, Havering and Redbridge University
Hospitals NHS Trust (BHRUT). Since the onset of the epidemic, data has been collated from these subsystems
within NEL7 on the number of COVID-19 cases, deaths and hospitalised patients as shown in Fig. 1.
NEL is highly diverse in terms of ethnicity and age as well as socio-economic mix, with large Black, Asian
and minority ethnic (BAME) populations with the majority of the population in Newham, Tower Hamlets and
Redbridge from BAME groups4,8. Furthermore, Barking and Dagenham has the lowest life expectancies for males
in London, while Havering has the largest proportion of people aged over 65 years of any London b orough9. It
has been widely reported that these groups, South Asian, Black, over 70s and males, have a significantly higher
risk of being hospitalised due to COVID-1910,11. Hence, understanding the pressure of COVID-19 on the local
Scientific Reports | (2021) 11:5806 | https://doi.org/10.1038/s41598-021-84907-1 2
Vol:.(1234567890)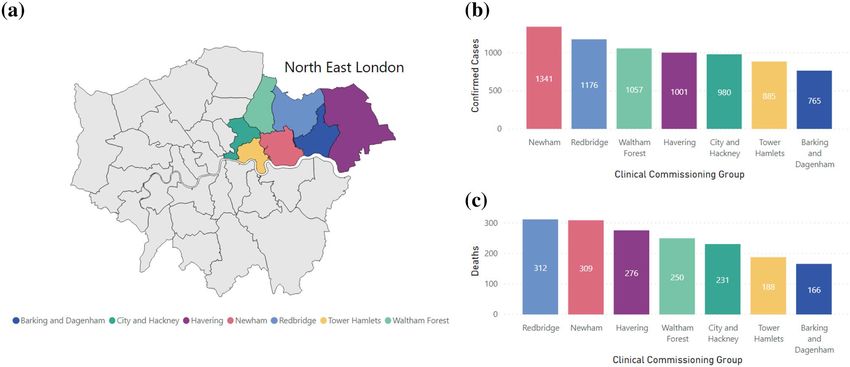
www.nature.com/scientificreports/
health and care system, and the constraints needed to keep infection rates within the hospital capacity levels,
is of increased importance in NEL due to its particularly vulnerable population. It is also important to support
system planning over the coming 12 months. There is a need to support both COVID-19 care and those with
non-COVID-19 health concerns (e.g. type 2 diabetes, cardiovascular disease and cancer, etc.), and consider
how much health and care system capacity is available for those with COVID-19 and non-COVID-19 needs.
On March 23, 2020, the UK Government imposed strict social distancing measures (‘lockdown’), to protect
the public, slow down the virus spread, and reduce the associated morbidity and mortality and prevent excess
demand on the National Health Service (NHS). As the number of daily cases and confirmed deaths started to
decline in late April 2020, the first steps were taken towards lockdown easing with the partial reopening of pri-
mary schools on June 01, 2020, of secondary schools from June 15, 2020, and non-essential businesses from July
04, 2020. Given the relatively high levels of ongoing i nfection3, it is important to assess whether the number of
infections will increase again when lockdown measures are lifted, potentially leading to future epidemic waves
and increasing the effective reproduction number Re. To suppress the virus and control the epidemic, Re needs to
remain below 1. The biggest step in lockdown easing came into effect in England from July 04, when restaurants,
pubs and hairdressers reopened, followed by the allowance of two households to meet indoors (where the risk
of transmission/survival of the virus is significantly higher) and relaxation of the two-metre social distancing
to rule of “one-metre plus”12. Lockdown easing increases the daily contact rate and it is critically important to
understand the extent to which such increase in the contact rate among people will affect control of COVID-19
transmission or lead to a secondary wave.
Since the onset of the epidemic in the UK, mathematical modelling has been widely used to understand the
spread of COVID-19 across different settings13, and to design optimal strategies to reduce the future burden and
prevent a second wave. Different mathematical models have been utilised: deterministic models on whole popu-
lations and rooted in using equations tracking Susceptible-Exposed-Infectious-Removed (SEIR) populations14,
sometimes age-stratified15,16; and stochastic i.e. individual-based m
odels17,18 for transmission between individuals
in a population. Contact rate, as the daily number of contacts per person per day, is one of the key parameters
within each group of models and physical/social distancing measures can be modelled by varying the contact rate.
A survey on adults’ behaviour in the UK during a period of lockdown and comparing the results to previously
collected data from Polymod19, suggest a large reduction in daily contacts particularly outside the home, result-
ing in a marked reduction in the estimated effective reproduction number from 2.6 to 0.6215. In these studies, a
contact is defined as encounters with either skin-to-skin contact or a two-way conversation of at least a few words.
As the UK uses a phased lockdown release plan, with reopening of schools as the first step of reopening society
from September 2 02017, it is imperative to assess how an increase in contact rate will affect Re and hence ability
to suppress the virus in the future. We note that these results depend on the level of compliance with additional
countermeasures, including face coverings usage, hand-washing, and correct social distancing.
In this paper, we present an SEIR model for COVID-19 spread across the NEL boroughs of Hackney, Tower
Hamlets, Newham, Waltham Forest, Barking & Dagenham, Havering, Redbridge, and the City of London. Within
the removed (R) compartment we include multiple sub-compartments to project the following outcomes: daily
overall hospitalised patients, daily hospitalised patients within Intensive Care Units (ICUs), daily discharges
from hospitals and daily deaths within hospitals from COVID-19. The novelty of our work is in combining the
model with granular local data to calibrate these four projections against, and hence generate estimates for the
epidemic in NEL.
We aim to determine the level of social distancing compliance, quantified here in terms of the daily number of
social contacts per person, needed to maintain future control of the COVID-19 epidemic in North East London
and not exceed healthcare capacity in case of secondary waves, via a series of modelling simulations.
Methods
Mathematical model. We developed a Susceptible-Exposed-Infectious-Removed (SEIR) mathematical
model to simulate the spread of COVID-19 in NEL as shown in Fig. 2. Details of the model equations, para-
metrisation and calibration of the model are contained in the supplementary material.
We assume that SARS-CoV-2 is introduced into a susceptible population of around 2.1 million people,
resembling the population of NEL, on 16th February 2020. Those exposed to the virus become infectious after
a median incubation period of 5.1 days20.
Within the model, we account for the proportions of people infected that have symptoms (symptomatic) vs
those that do not show symptoms (asymptomatic) and we introduce a parameter that quantifies the proportion
of symptomatic cases out of all cases (ρsym with details in the supplementary material). In the literature, there is
mixed evidence on what this proportion i s21. Hence we explored three values for this parameter, assuming 70% for
the main study and varying it to 50% and 25% in the sensitivity analysis (details in the supplementary material).
Additionally, we also vary the infectiousness period within the model. Firstly, in absence of data to suggest
otherwise, the infectious period is treated as equal for both symptomatic and asymptomatic cases and as a popu-
lation average of all cases. A recent literature review suggested that COVID-19 infectiousness peaks in the first
5 days following symptom onset, while no live virus has been cultured after 9 days following symptom o nset22.
Based on this, and taking in consideration that the single population average parameter for infectiousness period
is likely to be shortened by self-isolation of a significant proportion of symptomatic patients, we simulated three
scenarios for the infectiousness periods of 1, 3 and 5 days.
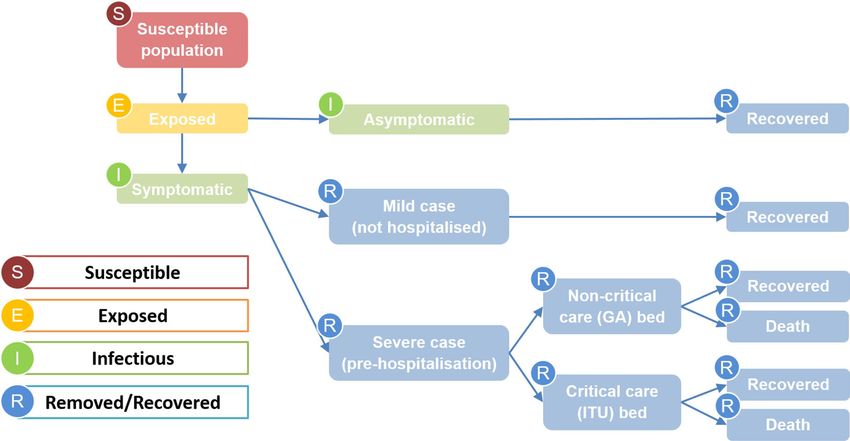
In our modelling approach, we divide the removed compartment into multiple sub-compartments to reflect
differential pathways for patients depending on the severity and outcome of infection. Cases are divided into
asymptomatic, mild (not hospitalised) and severe (hospitalised), based on the proportion of symptomatic cases,
Scientific Reports | (2021) 11:5806 | https://doi.org/10.1038/s41598-021-84907-1 3
Vol.:(0123456789)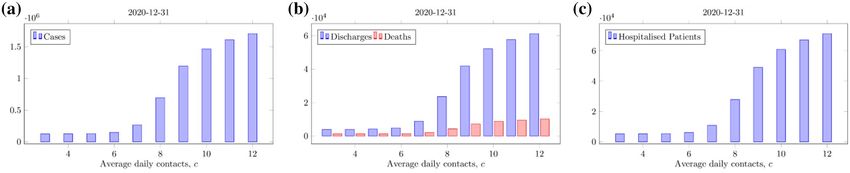
www.nature.com/scientificreports/
Figure 2. Schematic of the possible pathways within the SEIR epidemiological model. Arrows show the
progression through the stages from susceptible to removed/recovered.
ρsym, and the proportion of symptomatic cases requiring hospitalisation, ρsevere. This is detailed in the supple-
mentary material.
Hospitalised cases are divided into critical and non-critical, with the former requiring an ICU bed, based
on the proportion of patients requiring critical care, ρcritical. For each of these two hospital pathways, there are
distinct parameters associated with patient mortality rate and length of stay in the hospital, based on observed
differences23. The model focuses on hospitalised cases only for healthcare planning, not taking account of any
out-of-hospital deaths occurred. Further details can be found in the supplementary material.
Data. The number of daily patients hospitalised with COVID-19, in both non-critical and critical care beds,
and the number of daily discharges of COVID-19 patients was obtained from the COVID-19 Dashboard pro-
duced by NHS England and NHS Improvement24. The number of daily COVID-19 hospital deaths were pro-
vided by NHS England25.
All data was provided at a trust level. Data was aggregated to include the relevant NHS Trusts providing acute
care in North East London: Barking, Havering and Redbridge University Hospitals NHS Trust; Barts Health NHS
Trust; and Homerton University Hospital NHS Foundation Trust.
Estimates of hospital capacity were derived from local COVID-19 response plans and reported bed capacity
data during the COVID-19 pandemic24,26. This reflects considerable work done to increase overall hospital bed
capacity within NEL, and London. Information on capacity includes general acute beds as well as critical care
capacity, it notes current capacity as well as additional planned capacity. Capacity is broken down into 3 levels:
(i) currently available; (ii) planned capacity; and (iii) planned capacity plus Nightingale hospital bed capacity.
Estimates account for infection control planning to maintain certain hospital sites as COVID-free zones (equating
to approximately 20–25% of overall and critical care bed capacity) to maintain a degree of non-COVID-19 care.
Capacity estimates are used to assess where a secondary epidemic wave is likely to exceed acute bed capacity of
the NEL health and care system.
Parametrisation and calibration. The model is parametrised with a combination of fixed and fitted
parameters listed in Tables S2 and S3. The model was calibrated against observed data for NEL on COVID-19
hospitalised patients (both non-critical and critical care), discharges and in-hospital deaths, including all data
up to July 01, 2 02024,25. One of the key fitted parameters in the calibration was the daily contact rate which was
allowed to vary as a step function following key policy decisions such as lockdown, as well as periodically during
lockdown measures, to allow the force of infection to modulate over time. Details with fitted parameters used to
calibrate the model are listed in Table S3. Further details can be found in the supplementary material.
Analysis. For the main analysis of this paper, we varied the daily contact rate, c, between 3 (approximat-
ing the measured value during lockdown of 3.1) and 12 (slightly higher than the pre-COVID-19 UK average
of 10.7), from July 04, 2020, within the calibrated model. The daily contact rate is held constant from this date
forwards, after being modulated as a fitted parameter during calibration with a series of step-functions over time.
We projected the number of daily COVID-19 cases, associated deaths and overall and ICU hospitalised patients.
Scientific Reports | (2021) 11:5806 | https://doi.org/10.1038/s41598-021-84907-1 4
Vol:.(1234567890)www.nature.com/scientificreports/
Figure 3. Projections of the mathematical model forecasting the number of COVID-19 cases (left panels),
deaths (centre panels) and hospitalised patients (right panels) for varying numbers of daily contacts, c. (a)–(c)
show high levels of social distancing, c = 3 to 6, and (d)–(f) show low social distancing, c = 7 to 12. Infectiousness
period = 5 days, proportion of symptomatic infections = 70%. Estimates for hospital capacity levels are given in
(f) for reference.
We used the model projections to derive the maximum c, across different scenarios, to avoid a second COVID-
19 wave, keep Re below 1 and not exceed the acute bed capacity in NEL.
Since there is uncertainty about the length of time for which people are infectious, and the proportion of
people with symptomatic infection, we varied the parameter that describes the infectiousness period, and the
proportion of symptomatic cases, ρsym. The infectiousness period was set to 5 days and the proportion of symp-
tomatic cases set to be 70% for the main analysis, based on published w ork15,17. We note that a single value is
used to represent the infectiousness period and the contact rate for all individuals, for both symptomatic and
asymptomatic infection. In reality, we may expect these values to differ for symptomatic and asymptomatic cases
due to possible differences in infectivity profiles as well as social behaviour. But in absence of reliable estima-
tions for these differences, since asymptomatic infection is difficult to measure, we use a single value for these
parameter to avoid adding further uncertainty into the model.
Ethics approval and consent to participate. This study used secondary anonymised data set for which
no ethics approval or consent to participate was required.
Results
Across all nine scenarios, for varying proportion of symptomatic cases and infectiousness period, the model
was calibrated to closely match the NEL observed data (Figure S1 in the supplementary material). All fitted
parameters are summarised in Table S3 of the supplementary material.
Figure 3 shows the model-projected daily cases, cumulative deaths and daily number of hospitalised patients
for varying levels of daily contacts per person (or daily contact rate), c, for a population-average infectiousness
period of 5 days and a proportion of symptomatic infection of 70%. Our results suggest that significant relaxa-
tion of social distancing measures in NEL, with an average of more than 6 daily contacts per person from 4th
July 2020 leads to a resurgence of COVID-19 cases and a secondary epidemic wave (Fig. 3d–f). The size of a
secondary COVID-19 wave depends on the level of social distancing compliance, i.e. on the average number of
daily contacts per person.
With full relaxation of social distancing and return to pre-COVID-19 levels of social contact (c ≈ 11), a sec-
ondary COVID-19 wave may occur up to 8 times larger than the original wave in terms of number of infections
(Fig. 3d), peak number of patients hospitalised with COVID-19 and associated deaths (Figs. 3f, 4b). In addition
to a surge in the number of daily cases, hospitalised patients and deaths, the health and care demand will exceed
the acute bed capacity in NEL in this scenario.
At the time of submission, analysis suggested that a secondary COVID-19 wave, including excess demand on
acute care, may be prevented when a sufficient level of social distancing remains in place. Specifically, to prevent
a significant secondary wave in NEL, the average daily contact rate after July 04 must not exceed 6 (Fig. 3a–c).
With this level of compliance with social distancing, the burden from COVID-19 would be less in terms of total
cases, hospitalised patients and deaths (Fig. 4a–c), and the acute bed capacity demand not exceeded (Fig. 5a,b)
and Re will remain below 1 (Fig. 5c,d). Hence avoiding a secondary wave of COVID-19 in NEL would require
reduction in pre-COVID-19 average daily contact rate to around 50% of its pre COVID-19 level in the region
Scientific Reports | (2021) 11:5806 | https://doi.org/10.1038/s41598-021-84907-1 5
Vol.:(0123456789)www.nature.com/scientificreports/
Figure 4. Cumulative number of COVID-19 cases (a), hospital discharges and deaths associated with COVID-
19 (b) and hospitalised patients with COVID-19 (c) for different levels of compliance with social distancing
quantified by the number of daily contacts, c, from 4 July 2020. The cumulative totals for 2020 are considered,
including forecasts up to 31 December 2020. For c > 6 the number of cases, deaths, hospitalised patients and
discharges increase significantly. The results shown here assume an infectiousness period of 5 days and that
symptomatic infections comprise 70% of all infections.
Figure 5. Predicted size of the secondary COVID-19 wave (black lines), measured by the peak in all COVID-
19 hospitalised patients (left panels) and critical care COVID-19 hospitalised patients (right panels) for different
levels of compliance with social distancing from 4 July 2020 as a function of the daily number of contacts, c, (top
row) and the effective reproduction number, Re (on 5 July 2020, bottom row). Estimates for hospital capacity
levels (coloured lines) are given for reference. For c > 6, Re is above 1 and a secondary wave is predicted. The
results shown here assume an infectiousness period of 5 days and that symptomatic infections comprise 70% of
all infections.
indefinitely in the near term. While our analysis examined the period up to early 2021 only, the principle of our
analysis remain the same for looking further forwards in time—future epidemic waves require Re < 1 for sup-
pression, which in our results corresponds to an average daily contact rate of up to 6.
A secondary wave remains within the bed capacity of the health and care system for an average number of
daily contacts per person of up to 7 to 8 (Fig. 5a,b). However, this scenario is associated with a significantly
increased numbers of total cases, hospitalised patients, discharges and deaths (Fig. 5). A daily contact rate of 8
gives an end-of-year death total of over 4000, a more than threefold increase compared to if daily contacts were
kept to 6 or lower. Going from a population average rate of daily contacts of 8 to 9 increases the peak in COVID-
19 hospitalised patients from 2500 to 4200, crossing all 3 overall bed capacity scenarios, including the maximum
capacity (current plus planned plus Nightingale) of approximately 2900 beds (Fig. 3).
When we vary the infectiousness period to be 3 or 1 days, and the proportion of symptomatic infection to
be 50% or 25%, the overall results remain consistent, with a secondary epidemic wave present unless restricted
social distancing is present. Across all 9 scenarios, for varying levels of infectiousness period and proportion
of symptomatic infection, the limit on the average number of daily contacts to suppress a secondary wave is
between 5 and 6, while the maximum average number of contacts for a secondary peak to remain within NEL
capacity levels is between 8 (in 7 scenarios) and 9 (in 2 scenarios). Across scenarios, a longer infectiousness
period pushes a secondary wave further into the future, and a lower proportion of symptomatic infections leads
to a smaller peak in hospitalised patients for equivalent c values. Therefore, we find it is the balance between
Scientific Reports | (2021) 11:5806 | https://doi.org/10.1038/s41598-021-84907-1 6
Vol:.(1234567890)www.nature.com/scientificreports/
infectiousness period and the proportion of infections that are symptomatic that controls the timing and the
strength of a potential secondary wave in NEL. Results for all 9 scenarios are summarised in Figures S1–S12 of
the supplementary material.
Discussion
Our findings suggest that a limited relaxation of the level of social distancing in NEL is necessary to avoid future
COVID-19 waves and not exceed the acute bed capacity in the region. Good compliance with social distancing
measures and a maximum of 5–6 daily contacts per person on average, equivalent to a 45–55% reduction in
pre-COVID-19 average daily contacts, is necessary to keep the virus suppressed and keep the effective reproduc-
tion number Re below 1, across all nine scenarios modelled, varying the infectiousness period and proportion
of symptomatic infections.
Our results suggest that lockdown is a highly effective strategy in reducing infections and mortality, and that
lifting of lockdown fully in the near term, prior to mass vaccination of the population, would likely lead to a
resurgence of cases and a secondary COVID-19 peak, as shown by other modelling s tudies14–18.
We find that if the average daily contact rates per person increase to 7–8, while a secondary COVID-19 wave
will occur, the increased number of hospitalised patients will remain within the acute bed capacity of the local
health and care system. However, such scenarios are highly undesirable, leading to multi-fold increases in the
numbers of cases, hospitalised patients, discharges and deaths. As seen during the primary epidemic wave, a surge
in COVID-19 hospitalised patients can lead to severe disruption of the health and care system leaving patients
unable to receive the care they require, with elective procedures postponed or cancelled, and likely avoidance of
attendance due to fears around infection leading to an increase in excess d eaths27. Furthermore, the infection
risk to staff of having a significant proportion of hospital capacity used by COVID-19 patients places immense
burden on the local health and care system. Hence, although we find that such scenarios of increased social
contact are within certain operational limits, they have many negative consequences and should be avoided.
Our analysis shows the sensitivity of the epidemic to the degree of social contact, with a relatively small
increase in average social contact leading to very much worse outcomes in terms of public protection and
stress to the health and care system. We note here, as discussed in more detail below, that our model does not
account for the varying level of risk of COVID-19 on different segments of the population, whose ability to safely
engage in social contact will vary, e.g. comparison of lower-risk population such as children vs. older genera-
tions. Additionally, the relatively broad definition of a contact does not capture the significant differences in the
probability of a contact spreading infection, depending on factors such as household composition, location and
contact duration. While there is insufficient data on the contact duration necessary for infection to spread, the
Centre for Disease Control use an operational definition of more than 15 min in their guidance on exposure
to COVID-1928. It is unknown what proportion of contacts recorded in literature surveys meet this narrower
criteria; however, the number of these ‘higher-risk’ contacts is likely to be lower than the overall number of daily
contacts. Our population average social contact parameter, c, does not attempt to capture these levels of nuance.
Nevertheless, this work further highlights the need for careful and strategic relaxing of social distancing in order
to control future COVID-19 outbreaks.
The pertinent question in the UK is when, how, and how much, can social distancing measures be modi-
fied while keeping infection under control ( Re < 1). Our findings suggest that, if some level of social distancing
remains in place, with daily contacts at most 45–55% of that pre-COVID-19 depending on the assumed level of
infection that is asymptomatic, a potential second wave would be much less severe. Although previous studies
have modelled the potential impact of social distancing on viral s pread15–17, our study is the first to quantify the
average number of daily contacts per person required for viral prevention and control in a setting in the UK. We
illustrate that small degrees of relaxation to social distancing measures would allow hospitals and ICUs to operate
within capacity. However, any increase in daily contacts above an average of 6 is likely to induce a second wave
and over 8 daily contacts on average would exceed the capacity of acute care.
Ongoing surveys on a representative sample of UK adults about their contact patterns on the previous day,
by colleagues at London School of Hygiene and Tropical Medicine (LSHTM) suggest that the number of daily
contacts reduced 73% with the imposed lockdown measures from March 2 02015. More recent data reveal that
although there was a small increase in the average number of contacts per person per day in the first 2 weeks of
July, with the reopening of non-essential business from July 04, 2020, to around 4 contacts per person per d ay15,
this still remains below the limit of 6 that we suggest as necessary to avoid a secondary wave. Hence people remain
cautious as society reopens and our findings suggests this needs to remain in place in future.
The measures suggested by our findings to control the spread of COVID-19 later in 2020 and prevent the
NEL health care system from exceeding acute bed capacity are in line with the ‘rule of six’ UK policy adopted
in September 2020 in the face of increasing cases29. These measures are avoiding large gatherings, and avoiding
close contact with more than six people per day. The introduction of phased relaxation of lockdown measures,
such as reopening of schools and businesses, are important to protect education and the economy. However, while
infections are still present, it is important to keep tracking the epidemic trends and react in a timely way to any
future surge, as has been the case in other c ountries30. In particular, close attention should be paid to monitoring
population groups with unique risks such as those living in intergenerational and overcrowded households, where
people with a lower risk of COVID-19 complications mix with those who have greater COVID-19 risk levels.
While lockdown strategies can suppress the virus, reopening of society is important to protect the economy.
Maintaining the balance between saving lives and saving livelihoods is c rucial31. It is also important to allow
people to maintain important social links more easily, particularly where individuals are reliant on public trans-
port and other more shared spaces to do so. Phased reopening of society, with preparedness to react quickly if
Scientific Reports | (2021) 11:5806 | https://doi.org/10.1038/s41598-021-84907-1 7
Vol.:(0123456789)www.nature.com/scientificreports/
the epidemic metrics start to surge are crucial as we plan for future waves. Our results give quantification on the
level of compliance with social distancing that is necessary to prevent future secondary waves.
The work we present here has some limitations. Our model does not include granular population structure,
due to limitations of the observed data. Data available at the smaller geographic areas of interest used as inputs in
our model, is available as aggregated totals only for hospitalised patients, hospital discharges and hospital deaths,
without any demographic detail such as age, gender or ethnic background. As a result, our model is unable to
reliably use an age-stratified model without making assumptions about the observed data. Because of this, we are
not able to consider age stratification and the associated risks of different age groups. Due to these limitations of
the observed data, we have used a single parameter to describe the average daily contact rate, rather than an age
stratified rate or a contact matrix representing mixing within and between population groups. We do not consider
contact patterns characteristic of population groups with different employment types, household compositions
or social behaviours. Hence the amount of social contacts per person per day derived here as necessary for future
outbreak control is an average value for the entire population. This means our result of 5–9 contacts as the limit
for our system is not a hard line for all individuals and will vary depending on individual COVID-19 risk. For
example, with reopening of schools, school-age children returning to school may have more than 8 contacts per
day while having lower risk of COVID-19, while older generations are at much higher risk and so may remain
shielded with contacts well below 8. We also note that neglecting population structure can overestimate the size
of outbreaks32. This is due to the susceptible subpopulations of different groups actively shielding or becoming
depleted. Furthermore, the broad definition of a contact means that all contacts are not equal in terms of prob-
ability of spreading infection. As a result, we expect our study to underestimate the average contact rate that is
safe for avoiding a second wave.
While we have made every effort to characterise the pandemic in a way that resembles that of the UK, some
of the parameters we have used are from a variety of sources across different settings within the published litera-
ture. Since the purpose of the study was a large scale sensitivity analysis on the impact of the daily contact rate
on mitigating a secondary pandemic wave, such parametrisation is sufficient. We did not consider other control
measures that might decrease the effective reproduction number, e.g. shielding of vulnerable population groups.
While relaxing these assumptions may affect outcomes such as the size of a secondary peak quantitatively, we
don’t expect these to change the overall message of our work.
We note that our study only looks at contact rate as the main driver of transmission of the virus and does
not account for behavioural changes that alter transmission in some other way. For example, if people follow
guidance on social distancing and mask wearing even when socially mixing, this may reduce the transmission
probability even as a given level of contact is maintained33. We have not considered the policy of compulsory
face coverings imposed in England from 24th July 2020. But we note that if we assume 45% mask efficacy with
70% compliance, resulting in a 30% overall reduction in risk, then the number of effective contacts could be 30%
higher than the values reported here. Incorporating this and other non-pharmaceutical interventions within the
model is something we plan to explore in future. Additional, complementary work on this is ongoing by some of
the authors, focusing on assessing the impact of this policy combined with reopening schools and society from
September 2020 and with ongoing test-trace-isolate strategy on the COVID-19 epidemic.
The methodology we have used here can easily translate to other settings. NHS Right C are27 have a tool that
uses demographic factors (deprivation, age, population and ethnicity) to compare different Clinical Commis-
sioning Groups (CCGs) and provides a ‘nearest-10’ comparator group for each CCG. By identifying the CCGs
that are similar to those in NEL, future work can compare COVID-19 deaths and hospitalised patients across
such CCGs and use these to re-calibrate the model. This will allow us to explore whether the compliance with
social distancing that we are suggesting here is applicable to similar CCGs.
In summary, we show that limited relaxing of the lockdown in NEL is necessary to avoid secondary COVID-
19 waves and not exceed the acute bed capacity in the health and care system. Good compliance with social
distancing measures, with a maximum of 5–6 daily contacts per person on average (i.e. a 45–55% reduction in
pre-COVID-19 average daily contacts), is necessary to keep COVID-19 suppressed and keep Re below 1.
Data availability
The datasets used and analysed during this study and the numerical codes used to generate the outcomes of this
paper are available from the corresponding author on reasonable request.
Received: 28 August 2020; Accepted: 9 February 2021
References
1. Morawska, L. & Milston, D. K. It is time to address airborne transmission of COVID-19. Clin. Infect. Dis. https://doi.org/10.1093/
cid/ciaa939 (2020).
2. World Health Organisation. COVID-19 situation report 170. https://www.who.int/docs/default-source/coronaviruse/situation-
reports/20200708-covid-19-sitrep-170.pdf?sfvrsn=bca86036_2 (2020).
3. Public Health England. COVID-19 UK data. https://coronavirus.data.gov.uk (2020).
4. Office for National Statistics. Subnational population projections for England: 2018-based. https: //www.ons.gov.uk/people popul atio
nandcommunity/populationandmigration/populationprojections/bulletins/subnationalpopulationprojectionsforengland/2018b
ased (2020).
5. Office for National Statistics. Deaths involving COVID-19 by local area and socioeconomic deprivation: deaths occurring between
1 March and 17 April 2020. https: //www.ons.gov.uk/people popul ation andco
mmuni ty/births death
sandm
arria ges/deaths /bullet ins/
deathsinvolvingcovid19bylocalareasanddeprivation/deathsoccurringbetween1marchand17april (2020).
Scientific Reports | (2021) 11:5806 | https://doi.org/10.1038/s41598-021-84907-1 8
Vol:.(1234567890)www.nature.com/scientificreports/
6. Office for National Statistics. Death registration and occurrences by local authority and health board. https://www.ons.gov.uk/
peoplepopulationandcommunity/healthandsocialcare/causesofdeath/datasets/deathregistrationsandoccurrencesbylocalauthor
ityandhealthboard (2020).
7. Greater London Authority. London Borough Profiles. GLA (datastore) https://londondatastore-upload.s3.amazonaws.com/insta
nt-atlas/borough-profiles/atlas.html (2020).
8. Office for National Statistics. 2011 Census data. https://www.ons.gov.uk/census/2011census/2011censusdata (2020).
9. Office for National Statistics. Life expectancy at a local level in the UK. https://www.ons.gov.uk/peoplepopulationandcommun
ity/healthandsocialcare/healthandlifeexpectancies/bulletins/healthstatelifeexpectanciesuk/2016to2018#life-expectancy-at-a-local
-level-in-the-uk (2020).
10. Hull, S. A., Williams, C., Ashworth, M., Carvalho, C. & Boomla, K. Prevalence of suspected COVID-19 infections in patients from
ethnic minority populations: A cross sectional study in primary care. Br. J. Gen. 70, 699. https://doi.org/10.3399/bjgp20X712601
(2020).
11. Pan, A. et al. Association of public health interventions with the epidemiology of the COVID-19 outbreak in Wuhan, China. JAMA
323, 19. https://doi.org/10.1001/jama.2020.6130 (2020).
12. Selbie, D. et al. Staying alert and staying safe from 4 July. Public Health Matters. https: //public healt hmatt ers.blog.gov.uk/2020/07/03/
staying-alert-and-staying-safe-from-4-july/ (2020).
13. Panovska-Griffiths, J. Can mathematical modelling solve the current COVID-19 crisis?. BMC Public Health 20, 551. https://doi.
org/10.1186/s12889-020-08671-z (2020).
14. Sturniolo, S., Waites, W., Colbourn, T., Manheim, D. & Panovska-Griffiths, J. Testing tracing and isolation in compartmental
models. PLoS Comp Biol . http://journals.plos.org/ploscompbiol/article?id=10.1371/journal.pcbi.1008633 (2020).
15. Jarvis, C. I. et al. Quantifying the impact of physical distance measures on the transmission of COVID-19 in the UK. BMC Med.
18, 124. https://doi.org/10.1186/s12916-020-01597-8 (2020).
16. Keeling, M. J. et al. Predictions of COVID-19 dynamics in the UK: short-term forecasting and analysis of potential exit strategies.
Preprint at https://doi.org/10.1101/2020.05.10.20083683v2 (2020).
17. Panovska-Griffiths, J. et al. Determining the optimal strategy for reopening schools, the impact of test and trace interventions, and
the risk of occurrence of a second COVID-19 epidemic wave in the UK: a modelling study. Lancet Child Adolesc Health. 4(11),
817–827. https://doi.org/10.1016/S2352-4642(20)30250-9 (2020).
18. Kerr, C. C. et al. Controlling COVID-19 with test-trace-quarantine. medRxiv. https://doi.org/10.1101/2020.07.15.20154765v4.full
(2020).
19. Mossong, J. et al. Social contacts and mixing patterns relevant to the spread of infectious diseases. PLoS Med. 5, 3. https://doi.
org/10.1371/journal.pmed.0050074 (2008).
20. Stephen, A. et al. The incubation period of coronavirus disease 2019 (COVID-19) from publicly reported confirmed cases: estima-
tion and application. Ann. Intern. Med. 172, 9. https://doi.org/10.7326/M20-0504 (2020).
21. Gao, Z. et al. A systematics review of asymptomatic infections with COVID-19. J. Microbiol. Immunol. Infect. https://doi.
org/10.1016/j.jmii.2020.05.001 (2020) (Epub ahead of print).
22. Cevik, M. et al. SARS-CoV-2, SARS-CoV, and MERS-CoV viral load dynamics, duration of viral shedding, and infectiousness: A
systematic review and meta-analysis. Lancet Microbe. https://doi.org/10.1016/S2666-5247(20)30172-5 (2020).
23. Docherty, A. B. et al. Features of 20133 UK patients in hospital with COVID-19 using the ISARIC WHO Clinical Characterisation
Protocol: Prospective observational cohort study. BMJ 369, 1985. https://doi.org/10.1136/bmj.m1985 (2020).
24. NHS England and NHS Improvement. COVID-19 Dashboard. https://analytics.improvement.nhs.uk/#/views/Covid-19Dashboar
d/Coverpage?:iid=1 (2020).
25. NHS England: COVID-19 Daily Deaths. https://www.england.nhs.uk/statistics/statistical-work-areas/covid-19-daily-deaths/
(2020).
26. East London Health and Care Partnership. Managing the COVID-19 emergency and next steps. https://www.eastlondonhcp.nhs.
uk/Managing%20the%20Covid%20emergency%20and%20next%20steps.pdf (2020).
27. The Health Foundation. Understanding excess mortality: comparing COVID-19’s impact in the UK to other European countries.
https://www.health.org.uk/news-and-comment/charts-and-infographics/comparing-covid-19-impact-in-the-uk-to-european-
countries (2020).
28. Centre for Disease Control. Public health guidance for community-related exposure. https: //www.cdc.gov/corona virus /2019-ncov/
php/public-health-recommendations.html (2020).
29. GOV.UK. Rule of six comes into effect to tackle coronavirus/ https://www.gov.uk/government/news/rule-of-six-comes-into-effec
t-to-tackle-coronavirus (2020).
30. Le Page, M. et al. Covid-19 news: coronavirus restrictions reimposed around the world. New Scientist www.newscientist.com/artic
le/2237475-covid-19-news-coronavirus-restrictions-reimposed-around-the-world/ (2020).
31. Panovska-Griffiths, J., Gomes, M., Pizzo, E., Colbourn, T. & Lorgelly, P. Balancing lives and livelihoods: relaxation of lockdown
needs to be finely balanced. BMJ Opinion Piece https://blogs.bmj.com/bmj/2020/06/01/balancing-lives-and-livelihoods-in-post-
covid-19-lockdown/ (2020).
32. Kiss, I. Z., Joel, M. & Simon, P. L. Mathematics of epidemics on networks: neglecting population size. (Springer ISBN 978-3-319-
50806-1) https://www.springer.com/gp/book/9783319508047
33. Chu, D. K. et al. Physical distancing, face masks, and eye protection to prevent person-to-person transmission of SARS-CoV-2
and COVID-19: A systematic review and meta-analysis. Lancet 395, 1973–1987. https://doi.org/10.1016/S0140-6736(20)31142-9
(2020).
Acknowledgements
We would like to thank colleagues at NHS North East London Commissioning Alliance (NELCA) for supporting
this work, and the team of in-house analysts who have contributed to it. This includes Jane Milligan, Accountable
Officer NELCA; Henry Black, Chief Finance Officer NELCA; Steve Collins, Executive Director of Finance WEL
Clinical Commissioning Group; Niall Canavan, Chief Information Officer NELCA; Osman Bhatti, Chief Clinical
Information Officer NELCA; and Dr Victoria Tzortziou Brown, OBE, Tower Hamlets Clinical Commissioning
Group Board Lead on Integrated Care and Research lead. Thanks to Steve Collins and Marie Price, Director
of Corporate Affairs for NELCA, for providing input on drafting. We would like to also acknowledge Dr Amy
Gimma (LSHTM) for sharing the latest reports on the increase in number of contacts from their ongoing survey
data, Dr Cliff C Kerr (Institute for Disease Modelling) for commenting on an earlier draft of the paper and Prof
Graham Medley (LSHTM) and Dr Edwin van Leeuwen (Public Health England) for helpful discussions around
different modelling aspects considered in this study.
Scientific Reports | (2021) 11:5806 | https://doi.org/10.1038/s41598-021-84907-1 9
Vol.:(0123456789)www.nature.com/scientificreports/
Author contributions
J.P.G., N.C., I.E. and K.B. had the idea for this study. J.P.G. designed the study and N.C., I.E. and K.B. collated
and prepared the data for modelling. N.C. undertook the modelling with support from J.P.G. and W.W. J.P.G.,
N.C. and K.B. drafted the paper with input from W.W., I.E. and W.L. All authors approved the final version of
the manuscript.
Funding
JPG acknowledges funding from NHS North East London Commissioning Alliance for this study.
Competing interests
The authors declare no competing interests.
Additional information
Supplementary Information The online version contains supplementary material available at https://doi.
org/10.1038/s41598-021-84907-1.
Correspondence and requests for materials should be addressed to J.P.-G.
Reprints and permissions information is available at www.nature.com/reprints.
Publisher’s note Springer Nature remains neutral with regard to jurisdictional claims in published maps and
institutional affiliations.
Open Access This article is licensed under a Creative Commons Attribution 4.0 International
License, which permits use, sharing, adaptation, distribution and reproduction in any medium or
format, as long as you give appropriate credit to the original author(s) and the source, provide a link to the
Creative Commons licence, and indicate if changes were made. The images or other third party material in this
article are included in the article’s Creative Commons licence, unless indicated otherwise in a credit line to the
material. If material is not included in the article’s Creative Commons licence and your intended use is not
permitted by statutory regulation or exceeds the permitted use, you will need to obtain permission directly from
the copyright holder. To view a copy of this licence, visit http://creativecommons.org/licenses/by/4.0/.
© The Author(s) 2021
Scientific Reports | (2021) 11:5806 | https://doi.org/10.1038/s41598-021-84907-1 10
Vol:.(1234567890)You can also read