APPENDIX 1X - EB-2018-0056 COST OF SERVICE RATE APPLICATION
←
→
Page content transcription
If your browser does not render page correctly, please read the page content below
APPENDIX

                   1X

COST OF SERVICE
RATE APPLICATION
EB-2018-0056

APPENDIX

                   1Y

COST OF SERVICE
RATE APPLICATION
EB-2018-0056
Niagara-on-the-Lake Hydro Inc.
EB-2018-0056 | Business Plan
Filed: August 2018
Exhibit 1
Business PlanNiagara-on-the-Lake Hydro Inc.
EB-2018-0056| Business Plan
Page 1 of 36
Filed: August 2018
Table of Contents
1 1. Mission and Values ....................................................................................... 4
2 Mission................................................................................................................................ 4
3 Values ................................................................................................................................. 4
4 Principles ............................................................................................................................ 4
5 Tactical Initiatives ................................................................................................................ 6
6 2. About the Utility........................................................................................... 11
7 Utility Description .............................................................................................................. 11
8 Corporate Structure of the Utility ....................................................................................... 11
9 3. Economic Overview and Customer Description ...................................... 13
10 Economic Overview of the Service Area ........................................................................... 13
11 Customer Description........................................................................................................ 13
12 4. Outcomes of the Renewed Regulatory Framework ................................. 15
13 Customer Focus ................................................................................................................ 15
14 Seeking Customer Input .................................................................................................... 15
15 Alignment of Goals to Needs and Preference of Customers.............................................. 16
16 Public Policy Responsiveness ........................................................................................... 17
17 Financial Performance ...................................................................................................... 17
18 5. Performance Metrics and Future Plans .................................................... 19
19 PEG Performance ............................................................................................................. 19
20 Rates ................................................................................................................................ 20
21 Revenues .......................................................................................................................... 26
22 Capital Spending ............................................................................................................... 27
23 Operational Costs ............................................................................................................. 33
24 Personnel.......................................................................................................................... 34
25 Financial Performance ...................................................................................................... 36
26
27Niagara-on-the-Lake Hydro Inc.
EB-2018-0056| Business Plan
Page 2 of 36
Filed: August 2018
1 Executive Summary
2 This business plan for Niagara-on-the-Lake Hydro Inc. (“NOTL Hydro”) has been structured to
3 provide a comprehensive review of the key aspects of NOTL Hydro’s business and to review the
4 key initiatives for the next five years that are currently contemplated.
5
6 The key aspects of NOTL Hydro reviewed include:
7 1. Mission, values and Principles
8 2. A general description of the company
9 3. A general description of its market and the Town in which it operates
10 4. The regulatory environment
11 5. Key performance indicators and Future Plans
12
13 The key initiatives over the next five years include:
14 Keeping Rates Low – Despite being the smallest LDC in the Niagara region, NOTL
15 Hydro has had the lowest rates in the region for the past few years. In 2014-2017,
16 NOTL Hydro had the lowest rates across all three major rate classes. In 2018, NOTL
17 Hydro had the lowest residential and GS>50 kW rates and the second lowest GSNiagara-on-the-Lake Hydro Inc.
EB-2018-0056| Business Plan
Page 3 of 36
Filed: August 2018
1 Reliability – Reliability was rated by our customers as their top priority. NOTL Hydro
2 has achieved low outage rates over the past few years. However, this can be due to
3 luck as much as to good planning. NOTL Hydro will continue to make investments
4 with the goal of continually improving reliability. These investments include the
5 ongoing voltage conversion program which replaces the oldest assets and makes the
6 system a more consistent voltage as well as the investments in switches and
7 reclosures.
8
9 Planning for the Future – NOTL Hydro believes that it will be its responsibility to
10 allow its customers to have the choice as to whether they wish to install renewable
11 generation or battery storage. NOTL Hydro will continue to make investments, where
12 economically prudent, that facilitate this choice. The investments in switches and the
13 battery storage project are examples of this.
14
15 Sound Management – None of the above initiatives can be achieved unless NOTL
16 Hydro has the basics in place. These include good governance, a motivated and
17 experienced staff, sound financial management, good and steady profitability and
18 continued investments. NOTL Hydro will continue to operate in a sound business
19 manner.
20Niagara-on-the-Lake Hydro Inc.
EB-2018-0056| Business Plan
Page 4 of 36
Filed: August 2018
1 1. Mission and Values
2 Niagara-on-the-Lake Hydro Inc. (“NOTL Hydro”) is a fully licensed distributor of electricity
3 pursuant to a distribution license ED-2002-0547 issued by the Ontario Energy Board (the “OEB,
4 Board”) under the Ontario Energy Board Act, 1998 (the “Act”).
5
6 The utility develops and manages a monopoly electrical distribution network in the Town of
7 Niagara-on-the-Lake and delivers electricity to residential and commercial customers via its
8 distribution system. NOTL Hydro earns income based on fixed and volumetric charges for the
9 distribution of this electricity as well as service charges for related services. The charges or rates
10 are set through a periodic rate making process via applications to the OEB.
11 Mission
12 Niagara-on-the-Lake Hydro is a trusted partner for our customers. Niagara-on-the-Lake Hydro
13 will continuously seek to provide low cost energy delivery, high reliability and high power quality.
14 Values
15 We will perform our Mission while maintaining the following values:
16 1. No compromise on safety and health
17 2. Operate with integrity in all our dealings
18 3. Anticipate and meet the needs of our customers
19 4. Build value for our shareholder
20 5. Develop and maintain a strong team of employees
21 6. Be financially prudent
22 7. Enhance the environment
23 Principles
24 The following principles have been driving our investment decisions for the past couple of years
25 and will continue to do so. It is recognized that there is an inherent contradiction between many
26 of these principles and managing is about finding a balance between them. These are not
27 necessarily in an order:
28
29 1. The distribution grid will be needed. The local grid will be an integral part of the future
30 electricity system so we should continue to keep it in the best shape possible.Niagara-on-the-Lake Hydro Inc.
EB-2018-0056| Business Plan
Page 5 of 36
Filed: August 2018
1 2. Our role is to allow customer choice. Customers should be free to choose to make their
2 own energy related decisions or leave them to us. We should not be engaged in activities
3 designed to enrich ourselves at the expense of giving customers choice. Instead, we
4 should be looking at investments that promote customer choice. Implicit in all this is the
5 continued trade-off between cost and customer service (choice) that will always make
6 decisions difficult. The trade-off between providing more distributed generation capacity
7 and the cost of energy storage is an example of this. The trade-off between controlled and
8 uncontrolled electric vehicle charging is another.
9 3. We should always strive to be a cost-conscious operator. Having lower costs means
10 always having the flexibility to make investments when needed without these becoming a
11 rate or burden issue.
12 4. We should make our system as flexible as possible. We do not know what the future
13 demands will be on our system but the more flexible it is the more likely it can respond to
14 these demands. The current investments in automated switches and reclosures are an
15 example of this. Increasing our transformation capacity is another example.
16 5. We do not have to do it all ourselves. Many of the new technologies will be beyond the
17 scope of NOTL Hydro (integrated customer contact systems) but can still be provided
18 through joint purchasing (CHEC) or through third party providers. Other services will be
19 best provided in-house.
20 6. Electricity is a utility. The vast majority of customers want to have power when they
21 need it (all the time), to have a reasonable bill and to otherwise be left alone. Our job is
22 not to reach out to customers but to be there when customers want to reach out to us and
23 to anticipate their needs.
24 7. Being municipally owned provides a distinct advantage. Because our customers are
25 also our shareholders we can make decisions based on the aggregate benefit to them.
26 This may mean decisions that are better for them as customers rather than shareholders.
27 Private ownership may not have this option.
28 8. NOTL Hydro should continue to be run independently and as a profit-making
29 business. This provides the discipline to manage costs and the freedom to make long-
30 term decisions.
31 9. We should hire the best employees possible and have the best working
32 environment. Motivated and intelligent employees will always provide the best service
33 and, in the long run, at the lowest cost.Niagara-on-the-Lake Hydro Inc.
EB-2018-0056| Business Plan
Page 6 of 36
Filed: August 2018
1 10. NOTL Hydro will continue to advocate on behalf of its customers when NOTL Hydro
2 believes this is in the customer’s best interest. Advocacy will always be about what is
3 best for our customers; not what is best for NOTL Hydro.
4
5 Tactical Initiatives
6 NOTL Hydro plans on achieving its strategic goals by engaging in the following tactical initiatives:
7
8 Customer Communications
9 We recognize that most of our customers expect electricity to be provided 100% of
10 the time, expect a monthly bill delivered on a timely and accurate basis and do not
11 expect to communicate with us otherwise. However, if our customers do wish to
12 communicate with us they expect this to be as simple and effective as possible. To
13 achieve this, we maintain as many lines of communication as possible such as an
14 open office, phone lines, e-mail, twitter, Town Councillors, etc. We will also provide
15 readily available material which we believe to be relevant should our customers wish
16 to access it.
17
18 NOTL Hydro manages its own CDM programs so that relationships have been
19 developed between NOTL Hydro staff and the larger commercial customers. NOTL
20 Hydro was awarded the Energy Star Utility of the Year – Regional for 2014 by Natural
21 Resources Canada in recognition of these efforts. NOTL Hydro is the smallest utility
22 to have received this award.
23
24 Advocacy
25 We are not just a distributor of electricity to our customers. We are their
26 representative to the electricity sector as a whole. If we believe decisions are being
27 made that are not in the best interests of our customers we will advocate on their
28 behalf.
29
30 Rate Management
31 An LDC has many opportunities to make decisions that have a rate impact.
32 Examples include the timing of capital investments, the choice between operatingNiagara-on-the-Lake Hydro Inc.
EB-2018-0056| Business Plan
Page 7 of 36
Filed: August 2018
1 or capital expenditures in addressing issues and capitalization policies. NOTL Hydro
2 has deliberately made decisions that are neutral or have a lower rate impact. Over
3 a decade and a half the impact has been considerable.
4 A more significant example of this has been our investment in transformer stations.
5 These investments increase our distribution rates as these significant investments
6 are added to rate base. However, this rate increase is more than offset by the
7 reduction in transmission rates for our customers.
8
9 Strategic Alliances
10 There is a vast pool of people with experience, knowledge and expertise in the electric
11 industry within the province, including the fraternity between utilities, partnerships with
12 private consultants in many disciplines and contacts with venders supplying the latest
13 technologically advanced products for all distribution companies and customers. All
14 the above is tapped through associations, partnerships (both informal and formal, for
15 profit and not for profit corporations), forums and working groups. Working collectively
16 and collaboratively, they can share ideas and resources, solve problems, adapt to
17 new regulations and policy changes from governing bodies. NOTL Hydro and its
18 employees are members of the following associations, partnerships, and groups:
19 • Cornerstone Hydro Electric Concepts (CHEC)
20 • Utility Collaborative Services (USC)
21 • Utilities Standards Forum (USF)
22 • Financial Executives International (FEI)
23 • Professional Engineers of Ontario (PEO)
24 • Chartered Professional Accountants (CPA) Ontario
25
26 NOTL Hydro also participates in groups on an ad hoc basis such as regional utilities
27 meetings, Southwest conservation group, and Grid Smart City.
28
29 Invest in our People
30 We invest and retain our quality people by making their experience at NOTL
31 Hydro positive, safe and progressive. We offer continuous opportunities for
32 training and personal development; we keep our staff informed and promote a
33 culture of customer satisfaction. We make the changes necessary to promote aNiagara-on-the-Lake Hydro Inc.
EB-2018-0056| Business Plan
Page 8 of 36
Filed: August 2018
1 positive work environment. The result of this strategy is an engaged workforce
2 and a low turnover.
3
4 Capitalize on Technology
5 NOTL Hydro keeps abreast of changing technologies through ongoing
6 discussions with vendors and other LDCs. When these technologies make sense
7 from a cost and performance perspective NOTL Hydro will invest. In 2010, NOTL
8 Hydro was one of the first Ontario LDCs to invest in automatic switches. These
9 switches, which have direct communication links between themselves and with
10 the TS stations, will automatically switch feeds if there is a power outage in the
11 Olde Town. Prior to the implementation of these switches, the Olde Town, which
12 is at the end of the feeder lines, had a poor outage performance and this was a
13 source of concern and frustration with our customers. Customers now comment
14 on how much better the outage performance is.
15
16 NOTL Hydro is currently investing in more switches and re-closures to continue
17 to reduce outages and to expand the flexibility of our system in anticipation of
18 future demands in this regard. These investments also expand the capability of
19 our SCADA system.
20
21 In 2015, NOTL Hydro went live with its new outage management system. This
22 system utilizes the last gasp of the smart meters to provide alerts to line crews
23 and senior management of outages. Like many LDCs, NOTL Hydro now has
24 stories of restoring lost power during the night before customers were even aware
25 they had an outage.
26
27 The battery storage project with the Smart Grid Fund and Panasonic is another
28 example of investing in new technologies. NOTL Hydro sees energy storage as a
29 tool which will allow its customers greater choice as to whether they invest in
30 distributed generation. This project will help demonstrate that use of the battery
31 technology.
32
33
34Niagara-on-the-Lake Hydro Inc.
EB-2018-0056| Business Plan
Page 9 of 36
Filed: August 2018
1 Plan for the Future
2 While NOTL Hydro does not know what the future will bring, it tries to invest and
3 align its practices according to its best estimates. A current example is the growth
4 in distributed generation. NOTL has one of, if not the highest, density of solar
5 installations in Ontario. Eventually, these will begin to have an impact on the
6 performance of the distribution lines. NOTL Hydro is monitoring this closely. One
7 investment we are making is in additional switches and reclosures which will
8 eventually facilitate changing the flow of electricity within the NOTL Hydro grid.
9 We are also looking for opportunities to invest in energy storage which will
10 facilitate allowing more solar installations. NOTL Hydro was recently awarded a
11 Smart Grid Fund contract which will contribute to an investment in a 250 kW/ 250
12 kWh lithium-ion battery which will be installed on one of NOTL Hydro’s feeders.
13 The objective of this project will be to assess the ability to use the battery to
14 increase the capacity for renewable energy on the feeder.
15
16
17 Continuous Emphasis on Safety
18 Safety must always be the primary priority at an LDC. NOTL Hydro continues to
19 stress the importance of safety in all its activities. In 2012, NOTL Hydro was
20 awarded the ZeroQuest Sustainability level award for safety; the first LDC in
21 Ontario to reach this level.
22
23 For the past three years, NOTL Hydro has hired a part time specialist dedicated
24 to safety who helps ensure NOTL Hydro is kept abreast of best practices and
25 helps ensure the continuous emphasis on safety. In 2018, NOTL Hydro hired an
26 independent consultant to perform a safety audit on the company.
27
28
29 Financial Prudence
30 NOTL Hydro believes it is prudent to maintain a low debt:equity level. The gives
31 the company the financial flexibility to make investments or pay dividends when
32 needed. The current low debt:equity level reflects the effect of this strategy. The
33 two increases in 2005 and 2015 were the result of significant investments in the
34 high voltage transformer stations.Niagara-on-the-Lake Hydro Inc.
EB-2018-0056| Business Plan
Page 10 of 36
Filed: August 2018
1
2 Table 1: Historic Debt:Equity Ratios
NOTL Hydro Debt:Equity Ratio
1.60
1.40
1.20
1.00
0.80
0.60
0.40
0.20
0.00
2004 2005 2006 2007 2008 2009 2010 2011 2012 2013 2014 2015 2016
NOTL Hydro Ontario LDCs
3
4 Note: Debt is comprised of current and long-term debt and notes to related
5 parties. For 2006-2008 Ontario LDC debt does not include current portion
6
7Niagara-on-the-Lake Hydro Inc.
EB-2018-0056| Business Plan
Page 11 of 36
Filed: August 2018
1 2. About the Utility
2 Utility Description
3 NOTL Hydro has been in existence for over 100 years. Hydro-electric commissions were originally
4 formed in 1912 in the original Olde Town of Niagara (previously Newark) as well as in Queenston.
5 These were merged in 1970 when the Town of Niagara and the Township of Niagara merged to
6 create the present boundaries. In 1983 the assets of Ontario Hydro in the Town were purchased
7 so that the Commission served the entire population. In the early 2000’s the NOTL Transmission
8 Station was purchased from Hydro One and the York Transmission Station was built. Both of
9 these Transmission Stations are supplied by Hydro One 115 kV transmission lines so NOTL
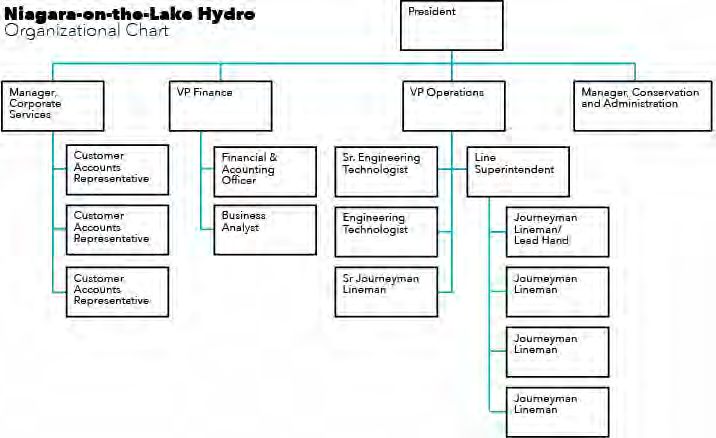
10 Hydro does not rely on Hydro One for any high voltage transformation. NOTL Hydro employs 18
11 full time highly trained staff and is an active partner in the community.
12
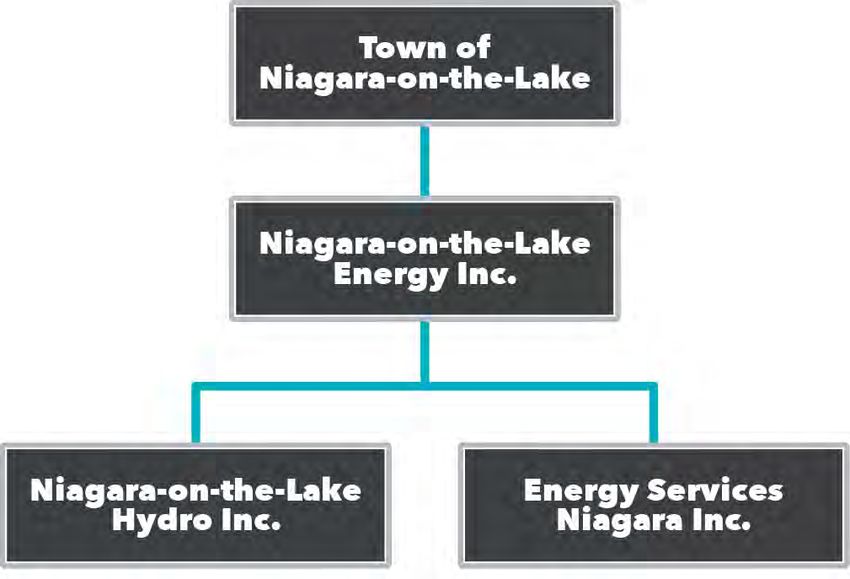
13 Corporate Structure of the Utility
14 NOTL Hydro is 100% owned by the Town of Niagara-on-the-Lake through the holding company
15 Niagara-on-the-Lake Energy Inc.
16 Table 2: Corporate Structure
17
18Niagara-on-the-Lake Hydro Inc.
EB-2018-0056| Business Plan
Page 12 of 36
Filed: August 2018
1 Table 3: Organizational Chart
2
3
4Niagara-on-the-Lake Hydro Inc.
EB-2018-0056| Business Plan
Page 13 of 36
Filed: August 2018
1 3. Economic Overview and Customer Description
2 Economic Overview of the Service Area
3 The Town of Niagara-on-the-Lake is known across Canada and around the world as a tourism
4 and agricultural centre. The Town receives over 1.5 million tourists a year visiting the Shaw
5 Festival, Fort George, the wineries and the Olde Town. Business is thus dominated by services
6 (retail, accommodation, entertainment) and agriculture (wineries, greenhouses, farms). The Town
7 also hosts one of the campuses of Niagara College. There is next to no manufacturing industry.
8
9 The Town of Niagara-on-the-Lake has a population of 17,500 and this is expected to grow to
10 22,400 by 2031 according to Town forecasts. The Town is known as a retirement community and
11 the average age in the Town is above the provincial average.
12
13 Customer Description
14 NOTL Hydro’s customer makeup by customer category as of December 31, 2017 is as follows:
15
16 Table 4: Customer Count December 31, 2017
Customer Category Count
Residential 7,913
General Service (50kW) 127
Unmetered & streetlights 29
Total 9,406
17
18 Like most LDC’s, NOTL Hydro has seen an ongoing decline in average customer usage due to
19 conservation, more efficient equipment and, for residential, declining household sizes. The trend
20 is not as pronounced in the general service classes due to movements between classes and
21 growth at individual customers. Streetlight consumption is declining due to the switch to LED
22 lights.
23Niagara-on-the-Lake Hydro Inc.
EB-2018-0056| Business Plan
Page 14 of 36
Filed: August 2018
1 Table 5: Average Monthly Consumption per Customer
Customer Category 2014 2015 2016 2017 2018 2019
Residential 810 793 793 753 775 761
General Service (50kW) 53,180 54,976 55,696 53,974 54,821 52,739
Streetlights & Unmetered
57 48 40 44 43 41
Load
2
3Niagara-on-the-Lake Hydro Inc.
EB-2018-0056| Business Plan
Page 15 of 36
Filed: August 2018
1 4. Outcomes of the Renewed Regulatory Framework
2 On October 18, 2012, the Ontario Energy Board (“The Board”) issued its “Report of the Board: A
3 Renewed Regulatory Framework for Electricity Distributors: A Performance Based Approach”.
4 The report set out a comprehensive performance-based approach for the Renewed Regulatory
5 Framework which promotes the achievement of outcomes that would;
6 • benefit existing and future customers;
7 • align customer and distributor interests;
8 • continue to support the achievement of important public policy objectives; and
9 • place a greater focus on delivering value for money.
10
11 On March 5, 2014, the Board issued its report on “Performance Measurement for Electricity
12 Distributors: A Scorecard Approach”. The report set out the Board’s policies on the measures that
13 are to be used to assess a distributor’s effectiveness and improvement in achieving customer
14 focus, operational effectiveness, public policy responsiveness, and financial performance to the
15 benefit of existing and future customers.
16
17 With the above in mind, the next section provides an account of how NOTL Hydro continues to
18 improve in its understanding of the needs and expectations of its customers and its delivery of
19 services.
20
21 Customer Focus
22 NOTL Hydro values customer input and feedback. Customers are engaged through education
23 opportunities, surveys and directly by the utility for input on key initiatives. Customer satisfaction
24 is measured on the Distributor Scorecard as well as a bi-annual survey and is incorporated into
25 goal setting and the planning processes, with a focus on ensuring and improving customer
26 satisfaction.
27
28 Seeking Customer Input
29 NOTL Hydro is 100% owned by the Town of Niagara-on-the-Lake so it is ultimately owned by its
30 customers. Customers therefore not only have a say in the operation of the business but a stake
31 in it as well.
32Niagara-on-the-Lake Hydro Inc.
EB-2018-0056| Business Plan
Page 16 of 36
Filed: August 2018
1 Customers will contact NOTL Hydro directly with concerns or questions. It is recognized that these
2 usually relate to issues that affect them directly (bills, services or capital work on or near their
3 property) but customers do reach out on general industry topics as well.
4
5 The next commonly used channel of customer input is through the Board of Directors. All current
6 Directors are residents of NOTL and have regular communication with customers. Customers will
7 also contact their municipal Councillor. All Councillors have lines of communication with NOTL
8 Hydro management.
9
10 In advance of its 2019 Cost of Service, NOTL Hydro opened several lines of communication with
11 its customers to get specific feedback on the utility’s proposed capital and operational budget.
12 These included open house meetings, open questions on our website, bill inserts and dedicated
13 meetings with some of our largest customers.
14
15 Alignment of Goals to Needs and Preference of Customers
16 NOTL Hydro strives to address our customers’ preferences and priorities and believe our goals
17 are in synch with theirs. As part of its 2018 Open Houses, NOTL Hydro asked customers to rank
18 selected priorities with a range of 1-7. The following is the result of that survey:
19
20 Priority 1) Reliability – Score 1.64
21 NOTL Hydro has had reliability scores better than the provincial average (excluding
22 Hydro One) for the past three years. NOTL Hydro will continue to invest in smart grid
23 technology to improve its reliability.
24
25 Priority 2) Lowest Rates – Score 1.94
26 NOTL Hydro has the lowest residential rates in the Niagara Region.
27
28 Priority 3) Service – Score 3.36
29 As a locally owned utility, NOTL Hydro is focussed on providing local service.
30
31Niagara-on-the-Lake Hydro Inc.
EB-2018-0056| Business Plan
Page 17 of 36
Filed: August 2018
1 Priority 4) Investment – Score 3.79
2 NOTL Hydro maintains an annual investment program designed to continually
3 improve the overall system.
4
5 Priority 5) Conservation – Score 3.97
6 NOTL Hydro expects to meet its entire 2015-2020 conservation obligation in 2018.
7
8 Priority 6) Generation – Score 4.36
9 NOTL Hydro’s goal is to allow all customers that want renewable generation to be
10 able to install renewable generation.
11
12 Priority 7) Underground – Score 5.15
13 NOTL Hydro has a multi-decade plan to convert the Olde Town to underground to
14 improve safety and reliability.
15
16 Public Policy Responsiveness
17 NOTL Hydro believes that the current state of the electricity sector is grounded through public
18 policy that ensures the sustainability of generation, transmission and distribution, while
19 considering economic and environmental consequences. NOTL Hydro is doing its part by
20 responsibly upgrading and maintaining its distribution system in stride with the useful life of the
21 infrastructure and growth of the community in an efficient manner at reasonable cost. NOTL
22 Hydro’s DSP is used as a tool to ensure the schedule for these activities are planned effectively
23 and a balanced approach to spending is continued in to the foreseeable future. NOTL Hydro is
24 particularly proud of our continued low outage and duration of outage statistics that corroborate
25 our effectiveness at managing the distribution system. In recent years, public policy has driven
26 environmental improvements in the sector by means of the LDC’s Conservation and Demand
27 Management obligations. NOTL Hydro’s CDM program is extremely effective in reducing electric
28 usage in our service territory and we are ranked 12th in the Province as of July 15, 2018.
29
30 Financial Performance
31 NOTL Hydro continues to record solid financial performance metrics. Key factors to this financial
32 success are effective business planning, a continuous focus on operational efficiency, andNiagara-on-the-Lake Hydro Inc.
EB-2018-0056| Business Plan
Page 18 of 36
Filed: August 2018
1 managing capital and expense expenditures to budget. The Business Plan and DSP will serve an
2 important role in providing the future direction of financial expenditure and performance.
3Niagara-on-the-Lake Hydro Inc.
EB-2018-0056| Business Plan
Page 19 of 36
Filed: August 2018
1 5. Performance Metrics and Future Plans
2 There is no single metric to measure performance. Low rates or costs are a good measure but
3 not if they are at the expense of good service and system investments. Likewise, financial
4 performance is a good measure but not if at the expense of high rates. NOTL Hydro’s approach
5 is to consistently measure itself across as many measures and benchmarks as possible
6 recognizing that an LDC cannot be the best at everything but can be good across all measures.
7
8 The following section reviews various measures of performance and, where appropriate, provides
9 the goals for future performance. These include:
10 1. PEG Performance
11 2. Distribution Rates
12 3. Revenues
13 4. Capital Spending
14 5. Operational Costs
15 6. Personnel
16 7. Financial Performance
17
18 PEG Performance
19 Perhaps the most widely-known benchmark of efficiency rating comes from the PEG report which
20 surveys utilities in Ontario. The PEG analysis is one of the few instruments that compares utilities’
21 cost efficiencies on a consistent basis and is publicly available. PEG produces an annual report
22 that provides a ranking of the utilities included in the study, summarizes the results, and provides
23 insight into the trends in utility efficiency scoring.
24
25 The PEG past performance table below shows NOTL Hydro’s rating for the last 6 historical years
26 of business. The PEG report uses econometrics to determine the cost efficiency of distributors.
27 Since the new categories were created in 2013, NOTL Hydro has consistently been in group three
28 with an associated stretch factor value of three. Group 1 (of 5) is ranked as the most efficient
29 group. As seen below, NOTL Hydro has achieved a consistent rating.
30
31Niagara-on-the-Lake Hydro Inc.
EB-2018-0056| Business Plan
Page 20 of 36
Filed: August 2018
1 Table 6: PEG Past Performance (Stretch Factor)
2013 2014 2015 2016
Stretch Factor Cohort - Annual Result 3 3 3 3
Associated Stretch Factor Value 0.30 0.30 0.30 0.30
2
3 The percentage difference between actual and predicted cost is the measure of cost performance.
4 A negative performance means that actual costs are lower than predicted costs. NOTL Hydro’s
5 performance has improved in this regard over the past six years.
6
7 Table 7: Summary of Cost Performance Results
2011 2012 2013 2014 2015 2016
Actual Total Cost $6,036,142 $6,125,368 $6,362,425 $6,619,352
Percentage Change on
2.0% 3.8% 4.0%
Previous Year
Percentage Difference
(Cost Performance) per 6.5% 2.7% -0.7% -2.8% -6.6% -6.4%
PEG Analysis
8
9 NOTL Hydro’s performance is the result of operating in accordance with its values rather than
10 with the specific objective of improving its PEG rating. The performance does indicate that its core
11 values are aligned with those envisioned in the PEG methodology. It is hoped that this
12 performance improvement will continue over the next five years with the continued application of
13 NOTL Hydro’s values and that NOTL Hydro may even move into the Group 2 stretch cohort.
14 However, NOTL Hydro understands that some actions, such as increasing the number of
15 employees to maintain service levels, may have a negative impact on the PEG performance in
16 the short term.
17
18 Rates
19 NOTL Hydro’s strives to have the lowest delivery rates in the Niagara Region across all the major
20 rate classes. NOTL Hydro focusses on delivery rates rather than just distribution rates as a
21 distributor is able to affect the other components of delivery rates including transmission rates,
22 loss factors and rate riders. In this regard it has been successful from 2014-2017 though in 2018
23 its small business customer rate was second lowest.
24Niagara-on-the-Lake Hydro Inc.
EB-2018-0056| Business Plan
Page 21 of 36
Filed: August 2018
1 Table 8: Niagara Region Residential Delivery Charges
Niagara Region Residential Delivery Charge (with # customers)
$70.00 - May 1, 2018
1,307,544
Line losses Transmission Distribution
$60.00
28,808
$50.00
1,307,544
244,114 11,169 22,853 53,617
$40.00 9,234
$30.00
$20.00
$10.00
$-
NOTL Alectra - St. Grimsby Welland NPEI Hydro One - Canadian Hydro One -
Catharines Thorold Urban Niagara Power Thorold Rural
2
3Niagara-on-the-Lake Hydro Inc.
EB-2018-0056| Business Plan
Page 22 of 36
Filed: August 2018
1 Table 9: Niagara Region Small Business Delivery Charges
Niagara Region Small Business Delivery Charge (with #
$200.00
customers)
- May 1, 2018
$180.00 1,307,544
$160.00
$140.00
$120.00 1,307,544 28,808
11,169
$100.00 244,114
9,234 53,617
22,853
$80.00
$60.00
$40.00
$20.00
$-
Welland NOTL NPEI Alectra - St. Grimsby Hydro One - Canadian Hydro One -
Catharines Thorold Niagara Thorold
Line losses Transmission Distribution
Urban Power General
2
3
4
5Niagara-on-the-Lake Hydro Inc.
EB-2018-0056| Business Plan
Page 23 of 36
Filed: August 2018
1 Table 10: Niagara Region Large Business Delivery Charges
Niagara Region Large Business Delivery Charge (with #
customers)
$14,000.00
- May 1, 2018
1,307,544
$12,000.00
$10,000.00
1,307,544 28,808
$8,000.00
11,169
244,114 22,853
$6,000.00 53,617
9,234
$4,000.00
$2,000.00
$-
NOTL NPEI Alectra - St. Welland Grimsby Hydro One - Canadian Hydro One -
Catharines Thorold Niagara Thorold
Line losses Transmission Distribution Urban Power General
2Niagara-on-the-Lake Hydro Inc.
EB-2018-0056| Business Plan
Page 24 of 36
Filed: August 2018
1 Table 11: Residential Bill Impacts (Distribution Only)
2019
Year 2014 2015 2016 2017 2018
(proposed)
Including Rate Riders
Monthly Charge 19.21 18.96 21.70 24.66 27.27 30.88
Volumetric 0.0104 0.0127 0.0059 0.0045 -0.0001 -0.0001
Total (750 kwh) $27.01 $28.49 $26.13 $28.04 $27.20 30.81
Bill Impact 5.46% -8.30% 7.29% -3.01% 13.27%
Excluding Rate Riders (incl. IRM & SME charge)
Monthly Charge 18.73 18.96 21.85 24.81 27.43 30.81
Volumetric 0.0126 0.0135 0.0105 0.0073 0.0040 -
Total $28.18 $29.09 $29.73 $30.29 $30.43 30.81
Bill Impact 3.21% 2.18% 1.87% 0.46% 1.25%
2
3 Generally, bill impacts are subject to a modest increase during the IRM years – in NOTL Hydro’s
4 case from 2014 to 2018. It is important to note that bill impacts also include the effects of the
5 disposition of deferral and variance accounts from pass-through charge (regulatory assets).
6 These substantially increase the volatility of rates from year to year.
7
8 The rates NOTL Hydro has applied for in 2019 continue the trend of maintaining low rates. NOTL
9 Hydro is looking for a modest increase in rates after incorporating the ICM rate rider into base
10 distribution rates. NOTL Hydro is seeking an increase in revenue of $50k compared to what NOTL
11 Hydro would have earned given current rates. Due to changes in the way streetlighting rates are
12 calculated, other classes will see a bigger rate increase as per the following table:
13 Table 12: Change in Revenue Requirement by Customer Class
Change in
Customer Class Revenue
Residential $ 34,748
GS50 $ 9,009
Unmetered $ 77
Streetlights $ (57,832)
Large User $ 53,622
14 $ 50,399Niagara-on-the-Lake Hydro Inc.
EB-2018-0056| Business Plan
Page 25 of 36
Filed: August 2018
1 Delivery rates are affected by more than just the revenue requirement of the distributor. Other
2 factors include rate riders as discussed above, transmission rates and the loss factor.
3
4 NOTL Hydro tries to keep its rate riders as close to zero as possible. It has been making changes
5 to its billing process to enhance this goal. The rate riders proposed for 2019 are close to this
6 objective. However, in 2018, NOTL Hydro had rate riders that were credits and reduced the cost
7 to our customers. The switch from credit rate riders to one that has a small increase in rates
8 creates a more substantial increase in rates.
9
10 Due to its ownership of its transmission stations, NOTL Hydro has one of the lowest transmission
11 rates in the Province. Its transformation charge in the Line Connection Charge is zero. Due to a
12 cool summer in 2017, NOTL Hydro’s transmission rates are declining based on its rate application
13 for 2019.
14
15 NOTL Hydro’s line loss rate is one of the lowest in the Province and, at 3.79%, is tied for the
16 lowest in the Niagara Region with Alectra in St. Catharines. NOTL Hydro is applying to lower its
17 line loss rate to 3.73%.
18
19 Table 13: Bill Impact Summary – Segmented Impact
Bill Segment Residential GS < 50 GS > 50 USL Streetlights Large User
Distribution Rates plus ICM $ 0.38 $ 0.60 $ 5.71 $ 0.63 $ (669.04) $ 4,468.66
Rate Riders $ 1.00 $ 3.20 $ 228.68 $ (0.41) $ 62.71 $ 8,354.73
Line losses $ (0.04) $ (0.10) $ (3.59) $ (0.04) $ (0.53) $ (132.86)
Transmission $ (0.32) $ (0.84) $ (18.93) $ (0.33) $ (3.08) $ (965.50)
$ 1.01 $ 2.86 $ 211.87 $ (0.15) $ (609.94) $ 11,725.03
20 0.97% 1.10% 3.01% -0.14% -14.45% 4.59%
21 When all these factors are combined the net impact on our various customer classes is
22 summarized in the table above.
23
24 With little movement in rates sought for 2019, NOTL Hydro expects its rates will continue to be
25 the lowest in the Niagara region and one of the lowest in Ontario. NOTL Hydro plans to continue
26 to operate in a prudent manner so that this rate performance continues.
27
28Niagara-on-the-Lake Hydro Inc.
EB-2018-0056| Business Plan
Page 26 of 36
Filed: August 2018
1 Revenues
2 NOTL Hydro’s revenues are historically steady and changes in revenues are a combination of
3 customer growth and changes in rates excluding rate riders.
4
5 Table 14: Historical and Proposed Revenues
2014 2015 2016 2017 2018 2019
Residential Fixed 17.94 18.17 21.06 24.02 26.86 30.24
Variable 0.0126 0.0128 0.0098 0.0066 0.0033 -
Cust/Conn 7,230 7,551 7,772 7,913 7,976 8,152
kWh 69,164,029 70,322,391 72,859,329 70,851,537 73,760,865 73,998,981
Revenues $2,381,359 $2,483,926 $2,597,709 $2,731,715 $2,814,235 $2,958,334
GS50 Fixed 266.42 269.88 274.74 279.14 281.65 281.65
Variable 2.1025 2.1298 2.1681 2.2028 2.2226 2.6132
Cust/Conn 133 121 129 127 131 131
kWh 81,046,957 83,783,451 83,544,376 82,904,820 85,961,669 82,705,771
Revenues $842,669 $818,758 $835,662 $876,154 $934,564 $988,010
Large User Fixed $4,538.81
Variable 2.6132
Cust/Conn 1
kWh 23,308,825
Revenues $177,656
USL Fixed 20.05 20.31 20.68 21.01 21.20 20.15
Variable 0.0060 0.0061 0.0062 0.0063 0.0064 0.0085
Cust/Conn 22 19 16 28 26 26
kWh 237,520 245,994 178,578 273,288 251,508 251,508
Revenues $12,312 $5,395 $2,134 $7,674 $8,224 $8,426
Streetlights Fixed 7.42 7.52 7.66 7.78 7.85 6.87
Variable 29.0338 29.4112 29.9406 30.4196 30.6943 17.7609
Connections 2,080 2,098 2,126 2,126 2,155 2,187
kWh 1,160,024 979,421 850,570 858,869 873,782 886,616
Revenues $245,028 $267,284 $260,761 $271,284 $281,864 $224,121
Other Other $425,893 $309,649 $521,351 $353,310 $333,386 $502,939
revenue revenue
TOTAL Cust/Conn 8,695 9,028 9,261 9,406 9,469 9,649
kWh 190,793,158 197,043,769 200,239,261 195,611,162 203,154,504 223,029,214
Revenues $4,970,288 $5,002,950 $5,332,265 $5,337,666 $5,502,840 $6,047,363
Distribution $523 $520 $519 $530 $546 $575
Revenues
per Cust
6
7
8
9
10Niagara-on-the-Lake Hydro Inc.
EB-2018-0056| Business Plan
Page 27 of 36
Filed: August 2018
1 NOTL Hydro’s longer term performance in reducing distribution revenues per customer can be
2 seen in the table below. This ties in with the goal of keeping rates lower. Some of the increase
3 from 2016 to 2019 comes from the 2015 ICM rate riders which in 2019 will become distribution
4 revenue. The new large user will also drive up revenues per customer with high revenues
5 coming from only one customer.
6
7 Table 15: Historical and Proposed Revenues
8
9
10 NOTL Hydro expects that revenue will continue to grow at a steady level over the next years as
11 new customers are added. The revenue growth will continue to be driven primarily by customer
12 growth as rates increase largely just with inflation.
13
14 Capital Spending
15 NOTL Hydro believes capital spending should be largely consistent from year to year. This
16 consistency is needed to ensure that NOTL Hydro distribution grid is maintained over the long
17 term and to maintain fiscal discipline. It is recognized that there will be variations from year to
18 year due to customer requirements and due to the lumpiness of certain projects like new TS
19 transformers.
20
21 NOTL Hydro’s Distribution System Plan as provided in its 2014 Cost of Service Application laid
22 out NOTL Hydro’s philosophy towards capital spending. These align with the requirements of the
23 Ontario Energy Board Consolidated Distribution System Plan and include meeting the immediateNiagara-on-the-Lake Hydro Inc.
EB-2018-0056| Business Plan
Page 28 of 36
Filed: August 2018
1 needs of customers for new or expanded access (System Access), maintaining a sufficient and
2 stable asset replacement program (System Replacement), planning for the future including
3 investing in smart grid technologies (System Service) and maintaining adequate support systems
4 (General Plant). These background drivers coupled with the condition of field assets formed the
5 basis for determining priority spending for specific projects. This information is in turn used in
6 further considerations through engagement with all partners/stakeholders (see below) involved in
7 the planning process.
8
9 • Customers
10 • the Regional and Municipal Governments
11 • CDM Program Partners
12 • IESO
13 • the Transmission Company – Hydro One
14
15 NOTL Hydro places a high priority on balancing its obligations to accommodate growth while
16 addressing the upkeep and replacement of its infrastructure.
17
18 Table 16: Historical Capital Additions
2014 2015 2016 2017
System Access 1,335,187 1,142,488 1,140,579 1,110,764
System Renewal 1,004,902 639,645 1,025,066 770,255
System Service 26,201 121,282 182,663 218,817
General Plant 114,769 67,072 107,532 267,554
Total recurring 2,481,059 1,970,487 2,455,837 2,367,390
Transformer (ICM) 375,965 2,059,240 28,781 -
Total 2,857,024 4,029,727 2,484,618 2,367,390
19
20 System access capital are primarily expenditures to connect new customers or update customer
21 connections. It also includes pole relocations for third parties. The expenditures provided are
22 before any customer or third party contributions. These are charged according to our Conditions
23 of Service and the Ontario Energy Board economic evaluation model.
24
25 System renewal capital are expenditures to replace existing assets and ensure the overall system
26 is maintained appropriately. The annual projects are determined by the voltage conversion planNiagara-on-the-Lake Hydro Inc.
EB-2018-0056| Business Plan
Page 29 of 36
Filed: August 2018
1 and, going forward, by the asset management plan. Annual expenditures are determined based
2 on a combination of resource availability and the need to insure that over time annual
3 expenditures are sufficient to replace aging stock. This is estimated by adjusting the annual
4 depreciation of poles, conduit and transformers for inflation.
5
6 Table 17: Depreciation vs. System Renewal ($000’s)
2014 2015 2016 2017
Depreciation $564 $574 $590 $600
Inflation adjustment 143% 144% 144% 144%
Required expenditure $806 $827 $850 $864
Actual expenditure $1,005 $640 $1,025 $770
Variance $199 ($187) $175 ($94)
7
8
9 System service capital are expenditures to improve the operating capabilities of the NOTL Hydro
10 distribution grid. The replacement of the transformer at NOTL MTS is a system service
11 expenditure but has been shown separately due to its size and that it was approved through an
12 ICM application. The increase in system service expenditures is the result of upgrades to the
13 SCADA system and increased investments in automated switches to reduce outage times and
14 improve the flexibility of the system.
15
16 General plant capital are expenditures for the supporting infrastructure needed to operate the
17 distribution business including software upgrades, building improvements, general capital
18 supplies and rolling stock. A big expenditure in 2017 is the purchase of a new truck to replace
19 one that has reached end of life. The total cost of $343k is being spread over 2017 and 2018.
20
21 The utility’s Rate Base has increased proportionally to its capital investments and as such has
22 remained historically as stable as has its other financial metrics.
23
24Niagara-on-the-Lake Hydro Inc.
EB-2018-0056| Business Plan
Page 30 of 36
Filed: August 2018
1 Table 18: Future Capital Additions ($000’s)
2018 2019 2020 2021 2022 2023 2024 2025 2026 2027
System
1,808 835 851 842 854 873 885 897 910 927
Access
System
1,052 1,097 1,160 935 935 969 1,002 1,010 1,020 999
Renewal
System
85 85 98 100 130 106 170 142 175 140
Service
General
313 84 72 149 134 535 51 82 454 121
Plant
Total
3,258 2,101 2,181 2,026 2,053 2,483 2,108 2,131 2,559 2,187
recurring
Battery 442
Transformer - 3,250 - - - - - - - -
Total 3,258 5,793 5,181 2,026 2,053 2,483 2,108 2,131 2,559 2,187
2
3
4 The following are the key assumptions and planned expenditures included in the above table:
5 • The high system access expenditure in 2018 is the result of the installation of a new
6 feeder line for a customer and the movement of a pole line along Lakeshore Rd. for
7 the Region of Niagara.Niagara-on-the-Lake Hydro Inc.
EB-2018-0056| Business Plan
Page 31 of 36
Filed: August 2018
1 • System access expenditures beyond 2018 are expected to be lower than in the recent
2 past due to lower growth. Growth will be more by infill rather than new subdivisions.
3 As this is driven by customer demand, this is subject to change.
4 • System renewal expenditures will be maintained at a fairly constant level in line with
5 past expenditures and in line with deprecation adjusted for inflation. These
6 expenditures are necessary to maintain a healthy system. Over time the focus of the
7 investments will switch from primarily voltage conversions to being a mix of voltage
8 conversions and replacements of individual assets (poles, transformers) based on the
9 asset management system.
10 • System service expenditures will grow over time due to the development of a smarter
11 grid with investments in more automated switches, more reclosures, voltage regulators
12 and an upgrade in the SCADA. These investments will make the NOTL Hydro grid
13 more resilient and better prepared for the increased demands made on it in the future
14 as customers invest in distributed energy.
15 • The System Service expenditure is higher by $442K in 2019 due to the investment in
16 the battery, a Smart Grid Fund deployment project in which NOTL Hydro will install a
17 250 kW / 250 kWh lithium-ion battery on one of its feeders and analyze how the battery
18 can be used to increase the capacity of this feeder line for installed renewable
19 generation.
20 • Beyond the battery, the forecast does not include any expenditures on energy storage
21 or other solutions to address the challenge of having too much distributed generation.
22 This is a growing issue in NOTL as there is significant and growing investment in
23 distributed energy by customers and three feeders are already at capacity. There is
24 currently not sufficient information to forecast the best investments to address this
25 issue and their respective cost.
26 • The major general plant investments include new line trucks in 2018, 2023 and 2026,
27 major software upgrades every five years and work on the building in 2023.
28 • The new transformer is to replace the second aged transformer at the NOTL TS. The
29 first transformer was replaced in 2016 when one of the old 25 MVA transformers was
30 replaced with a 50 MVA transformer. In this project planned for completion in 2019, a
31 83 MVA transformer will replace the existing 41.7 MVA transformer at York TS and the
32 41.7 MVA transformer will be moved to NOTL TS to replace the second 25 MVA
33 transformer. This will provide NOTL Hydro with capacity at both stations to serve the
34 entire NOTL load; providing valuable redundancy. This project has been accelerated
35 due to ongoing problems with the second 25 MVA transformer at NOTL MTS.Niagara-on-the-Lake Hydro Inc.
EB-2018-0056| Business Plan
Page 32 of 36
Filed: August 2018
1
2 The impact of NOTL Hydro’s long-term capital program can be seen in the chart below. Net fixed
3 assets will remain at their current level in 2017 and 2018 but make a substantial increase in 2019
4 with the addition of the new transformer.
5
6 Chart 19: Net Fixed Assets per Customer
7
8
9
10 The key objectives of the capital investment program proposed by NOTL Hydro for the next five
11 to 10 years include:
12 • Ensuring customer needs for supply system security and reliability are met through
13 implementation of cost effective solutions, by mitigating the risk of asset failures in
14 service, and through economically efficient investments;
15 • Mitigating and reducing the public safety risks from distribution system operations;
16 • Meeting NOTL Hydro’s regulatory obligations to customer service, including the
17 obligation to serve customers within the service territory and the obligation to relocate
18 lines when requested by the Regional and Municipal Governments, in conjunction with
19 road widening programs and compliance with Measurement Canada regulations
20 related retail revenue metering;
21
22 • Providing access to connect green energy generation to distribution system through
23 Smart grid development initiatives, improving protection, controls and monitoring ofNiagara-on-the-Lake Hydro Inc.
EB-2018-0056| Business Plan
Page 33 of 36
Filed: August 2018
1 distribution stations and effective use of data provided by smart meters for energy
2 conservation and demand management; and
3 • Improving worker safety and productivity and enhancing operating efficiency.
4
5 More detail on all the forecast capital investments can be found in NOTL Hydro’s DSP.
6
7 Operational Costs
8 NOTL Hydro continually reviews its business and operational goals against; its workforce needs,
9 its financial strength and the impact on its customers. NOTL Hydro recognizes the importance
10 and value of maintaining a skilled and engaged workforce, where all employees are customer
11 focused and enjoy working for the utility. Operational planning focuses on balancing cost effective
12 spending with practical operational requirements and finding efficiencies when possible. Example
13 of efficiencies include co-operating with other LDCs (UCS, CHEC), outsourcing and automation.
14
15 Table 20: Operation Costs Table
Board
2014 2015 2016 2017 2018 2019
Approved
Operations $532,044 $491,400 $548,540 $654,295 $673,867 $679,413 $715,973
Maintenance $416,132 $412,259 $451,578 $476,273 $414,737 $473,074 $449,790
Billing and Collecting $534,260 $559,556 $601,150 $547,188 $573,154 $597,617 $632,867
Community Relations $17,800 $578 $758 $9,700 $4,161 $12,765 $11,485
Administrative and General $655,026 $744,411 $721,094 $844,735 $929,202 $1,141,995 $1,164,070
Total $2,155,262 $2,208,203 $2,323,119 $2,532,191 $2,595,121 $2,904,865 $2,974,186
16 %Change (year over year) 2.5% 5.2% 9.0% 2.5% 11.9% 2.4%
17
18 Operational spending in a smaller LDC such as NOTL Hydro is necessarily uneven as relatively
19 small changes can have a pronounced effect; especially if you have several in one year. The
20 large increase in costs from 2017 to 2018 is due to less time spend on capital work by senior
21 management, the new Utilismart contract, maternity leaves and a new VP Operations. The
22 increase in cost per customer, as per the table below, reflects these changes.
23
24 Table 21: Operational Costs per Customer
2014 2015 2016 2017 2018 2019
NOTL Hydro 258 262 277 276 307 308
Ontario average 271 275 278 - - -
25 NOTL Hydro does not currently have any plans for new staff and will be absorbing the changes
26 made in 2018 for a few years. The operating cost per customer is therefore expected to be stable
27 for the next few years.Niagara-on-the-Lake Hydro Inc.
EB-2018-0056| Business Plan
Page 34 of 36
Filed: August 2018
1
2 Chart 22: Operational Costs per Customer Provincial Comparison
3
4
5 Personnel
6 NOTL Hydro currently employs 18 full time employees. The only part-time employee is the safety
7 consultant. Twelve of the staff are part of the union, IBEW Local 636, while six are management.
8
9 NOTL Hydro’s comparatively small staff allows a team atmosphere to be developed. The
10 increased communication, mutual support and customer focus that derives from this team spirit
11 cannot be underestimated. The team spirit is maintained by continuing investment in staff,
12 monthly all team meetings and, most important of all, the general recognition that we are all equal
13 as human beings.
14
15 The continuing investment in staff and technology has resulted in a consistently improving
16 financial performance as measured by the number of customers per staff. This can be seen in the
17 following chart. Due to the small size of NOTL Hydro as an LDC it is important to look at the
18 overall trend rather than the variations from year to year.
19
20 No new hires are currently planned for 2018 and 2019. Hires subsequent to 2019 will be
21 determined based on workload and growth.
22
23 One of the challenges with a small company like NOTL Hydro is succession planning. It is not
24 possible to have a back-up for every position in the company. It is also in the company’s bestNiagara-on-the-Lake Hydro Inc.
EB-2018-0056| Business Plan
Page 35 of 36
Filed: August 2018
1 interest to promote from within when possible. NOTL Hydro has developed succession plans for
2 its mid-level management. Developing succession plans for the executive team is more
3 challenging. NOTL Hydro reviews these successions on a case-by-case basis with the long-term
4 goal being a mix on internal promotions and external hires.
5
6 Chart 23: Customers per Employee
Niagara-on-the-Lake Hydro Customers per Employee
600
550
500
450
400
350
300
Number of NOTL Hydro employees:
NOTL customers per employee Ontario customers per employee
Linear (NOTL customers per employee)
7
8Niagara-on-the-Lake Hydro Inc.
EB-2018-0056| Business Plan
Page 36 of 36
Filed: August 2018
1 Financial Performance
2 NOTL Hydro’s past and future financial performance is summarized below.
3
4 Table 24: Financial Performance ($000’s)
2014 2015 2016 2017 2018 2019
(Actual) (Actual) (Actual) (Actual) (Application) (Application)
Distribution
Revenues 4,878 5,003 5,332 5,338 5,502 6,047
OM&A 2,238 2,342 2,474 2,617 2,940 3,009
Depreciation 1,137 950 898 892 783 1,157
Interest 381 490 512 476 416 392
Net Income before
Tax 1,121 1,221 1,448 1,352 1,363 1,489
Net Income after
Tax 1,114 714 1,009 1,384 1,197 1,308
Return on Equity
(Deemed capital) 10.85% 8.90% 7.44% 9.81% 9.00% 9.00%
5
6 In 2018, of the amortization of the excess revenue NOTL Hydro had earned between the time it
7 extended the useful life of many of its assets under IFRS and the incorporation of this reduced
8 expense in rate was completed. This had served to reduce other income with a corresponding
9 reduction in depreciation. In addition, since 2015, contributed capital has been amortized to
10 revenue rather than net against depreciation. This also corresponds to the increase in
11 depreciation.
12
13 Interest is based on actual expected debt levels rather than on the deemed debt. The interest
14 expense will therefore be lower than that used in the rate application while the tax expense and
15 net income will be higher.
16
17 Return on Equity is shown based on a deemed capital structure. The actual return on equity will
18 be lower due to NOTL Hydro’s conservative capital structure. The deemed return on equity for
19 2017 is 9.81%, which is slightly above the Board Approved rate of return of 9.36%. Return on
20 equity will show more volatility than expected based on annual revenues and expenses due the
21 tax expense. For 2018 and 2019 the target return on equity will be the OEB allowed rate of 9.00%.
22
23 NOTL Hydro expects that financial performance will continue to improve. However, the
24 improvement will be limited to the increase in net assets as per the regulatory model. The increase
25 in net assets will be limited by NOTL Hydro’s goal of keeping low rates.You can also read