Comparing Crises: Great Lockdown versus Great Recession - Food and ...
←
→
Page content transcription
If your browser does not render page correctly, please read the page content below
Comparing Crises: Great Lockdown versus Great Recession
Comparing crises:
“Great Lockdown” vs “Great Recession”

 By Josef Schmidhuber and Bing Qiao
 Trade and Market Division Economic and Social Development Department

 Food and Agriculture Organization of the United Nations, Rome, 2020
Required citation:
Schmidhuber, J. and Qiao, B. 2020. Comparing Crises: Great Lockdown versus Great Recession. Rome, FAO.
https://doi.org/10.4060/ca8833en

The designations employed and the presentation of material in this information product do not imply the expression of
any opinion whatsoever on the part of the Food and Agriculture Organization of the United Nations (FAO) concerning
the legal or development status of any country, territory, city or area or of its authorities, or concerning the delimitation
of its frontiers or boundaries. The mention of specific companies or products of manufacturers, whether or not these
have been patented, does not imply that these have been endorsed or recommended by FAO in preference to others
of a similar nature that are not mentioned.

The views expressed in this information product are those of the author(s) and do not necessarily reflect the views or
policies of FAO.

ISBN 978-92-5-132526-1
© FAO, 2020

Some rights reserved. This work is made available under the Creative Commons Attribution-NonCommercial-ShareAlike
3.0 IGO licence (CC BY-NC-SA 3.0 IGO; https://creativecommons.org/licenses/by-nc-sa/3.0/igo/legalcode).

Under the terms of this licence, this work may be copied, redistributed and adapted for non-commercial purposes,
provided that the work is appropriately cited. In any use of this work, there should be no suggestion that FAO endorses
any specific organization, products or services. The use of the FAO logo is not permitted. If the work is adapted, then it
must be licensed under the same or equivalent Creative Commons licence. If a translation of this work is created, it must
include the following disclaimer along with the required citation: “This translation was not created by the Food and Agri-
culture Organization of the United Nations (FAO). FAO is not responsible for the content or accuracy of this translation.
The original [Language] edition shall be the authoritative edition.”

Disputes arising under the licence that cannot be settled amicably will be resolved by mediation and arbitration as de-
scribed in Article 8 of the licence except as otherwise provided herein. The applicable mediation rules will be the media-
tion rules of the World Intellectual Property Organization http://www.wipo.int/amc/en/mediation/rules and any arbitration
will be conducted in accordance with the Arbitration Rules of the United Nations Commission on International Trade Law
(UNCITRAL).

Third-party materials. Users wishing to reuse material from this work that is attributed to a third party, such as tables,
figures or images, are responsible for determining whether permission is needed for that reuse and for obtaining permis-
sion from the copyright holder. The risk of claims resulting from infringement of any third-party-owned component in the
work rests solely with the user.

Sales, rights and licensing. FAO information products are available on the FAO website (www.fao.org/publications)
and can be purchased through publications-sales@fao.org. Requests for commercial use should be submitted via: www.
fao.org/contact-us/licence-request. Queries regarding rights and licensing should be submitted to: copyright@fao.org.
CONTENTS

Acknowledgments ......................................................................................................................... v
Executive Summary ....................................................................................................................... 1
Introduction and objective ............................................................................................................ 3
 Impacts on overall economic activity – Gross Domestic Product (GDP) levels and growth........4
 The Great Lockdown: Unlike the Great Recession, a truly global crisis.................................. 5
 Island states are always hard hit................................................................................................ 7
 Small Island Developing States (SIDS) will be hardest hit....................................................... 7
 Credit markets ......................................................................................................................... 10
 Exchange rates ........................................................................................................................ 11
 Trade ....................................................................................................................................... 12
 Total merchandise trade ..................................................................................................... 12
 Trade in food and agriculture .............................................................................................. 13
 Greater diversification in agricultural trade............................................................................. 14
 Food prices .............................................................................................................................. 16
 Food stocks and “storers” ....................................................................................................... 17
 Energy markets, biofuels and agricultural input markets ........................................................ 19
 Transportation and supply chain disruptors ............................................................................ 21
 Bulk...................................................................................................................................... 22
 Container and truck transportation ..................................................................................... 23
 Air freight ............................................................................................................................ 23
Key messages .............................................................................................................................. 23
REFERENCES ................................................................................................................................ 25
Annex 1 ....................................................................................................................................... 27
Annex 2: Methodological note explaining the calculations of aggregate import dependency .... 30
Annex 3: Data sources for the overview table ............................................................................. 32

 Page iii
Figures
Figure 1: GDP growth, annual changes in percent, by income group ............................................ 6
Figure 2: Import dependency rates (%) of Small Island Developing States .................................... 8
Figure 3: Personal remittances, share of GDP, 2016-2018 average............................................... 8
Figure 4: Share of inbound tourism in GDP, by country, 2016-18 average .................................... 9
Figure 5: GDP growth, island states, annual changes in percent ................................................. 10
Figure 6: US Dollar Index, Trade-weighted USD exchange rate ................................................... 12
Figure 7: Depreciation rates in percent, January – March 2020, by country ............................... 12
Figure 8: Total merchandise trade, 2000-2022 under different COVID-19 impact assumptions . 13
Figure 9: Agricultural trade projections, own calculations based on WTO estimates .................. 14
Figure 10: Changes in the HHI for all traded commodities, imports and exports ........................ 16
Figure 11: Price changes for food products, Great Recession vs Great Lockdown ...................... 17
Figure 12: Cereal stocks, evolution across crises ......................................................................... 18
Figure 13: Crude oil prices, Great Recession vs Great Lockdown ................................................ 20
Figure 14: DAP fertilizer prices, Great Recession vs Great Lockdown .......................................... 21
Figure 15: Urea prices, Great Recession vs Great Lockdown ....................................................... 21
Figure 16: Baltic Dry index, 1995-2020 (tradingeconomics.com, 2020) ...................................... 22
Figure 17: Storers and stocks prior to the Great Lockdown ........................................................ 27
Figure 18: Storers and stocks prior to the Great Recession ......................................................... 27
Figure 19: Cereal Stocks and Stocks-to-Use ratios across countries ............................................ 28
Figure 20: Fuel index, Great Recession vs Great Lockdown ......................................................... 28

Tables
Table 1: Overview – Comparing Crises .......................................................................................... 4
Table 2: Energy and metal prices since January 2020.................................................................... 7
Table 3: Concentration ratios of global cereal stocks (closing levels) .......................................... 19
Table 4: Exchange rate changes for the 50 largest economies in 2020 (till 10 April) ................... 29
Table 5: Lists of HS codes of food products in FBS groups........................................................... 31

 Page iv
ACKNOWLEDGMENTS
The authors appreciate the valuable comments, corrections and inputs provided by Boubaker
Ben-Belhassen, Maximo Torero and Abdolreza Abbassian. They are equally grateful to Ettore
Vecchione and Araceli Cardenas for the design and publishing support.

 Page v
EXECUTIVE SUMMARY
A comparison of the Great Lockdown of 2020 underway with the Great Recession of 2009,
reveals some regularities, yet many differences. Notably, the shock associated with the Great
Recession arose out of economy-wide stress, particularly high-income countries, while in direct
contrast, the Great Lockdown was borne outside of the global economic system, and
seemingly is set to leave most countries severely affected, high and low-income countries
alike. Both crises, however, have led to similar impacts to economies throughout the world,
with significant contractions to economic growth, economic activity and employment.

For global food and agriculture, the Great Recession unfolded as a combination of two distinct
crises that followed each other from 2007 to 2009. The initial 2007-2008 crisis was largely
limited to food and agriculture, arising from a combination of supply and demand shocks
within the global food sector. The 2009 crisis arose from an external demand side shock,
brought about by the sharp contraction in overall economic activity in 2009, which is now
known as the Great Recession. When referring to the Great Recession, this paper distinguishes
two distinct sub-crises, i.e. the global food crisis of 2007-2008 and the global recession of
2009.

Findings

The findings of the study show that the commonalities of both crises manifest in sharp declines
in economic activity combined with equally sharp increases in unemployment. Yet, these
aggregate changes mask a number of subtle differences in how and where impacts are the
hardest felt. In the Great Recession of 2009, significant contractions in Gross Domestic Product
(GDP) were largely limited to high- and middle-income countries, whereas many low-income
countries experienced only mild reductions in income growth, if any at all. This is in stark
contrast to the expected effects of the current crisis. According to the IMF’s latest World
Economic Outlook (April 2020), the Great Lockdown will again hit the GDP of high-income
countries (-6.1 percent in 2020) proportionately more than the low-income ones (-1.0 percent
in 2020), but seemingly, no country or country group will escape the crisis unscathed. All-in-
all, COVID-19 is expected to lead to much deeper recessions at both the country and global
level than that of the Great Recession.

Indeed, the commodity boom associated with the Great Recession proved beneficial to
commodity exporters of emerging nations, especially those situated in Latin America and in
“Developing and Emerging Europe”, whereby they reaped the rewards of soaring commodity
prices. During the Great Lockdown, their fortunes are expected to reverse strongly to the point
that they are foreseen to be the hardest hit, with concomitant economic contractions for each
region of -5.2 percent in 2020.

Another important finding is that Island states, whether high-income or low-income, did not
escape the contractionary impacts of the Great Recession, and are also unlikely to elude the
recessionary consequences of the Great Lockdown. Again, Small Island Developing States
(SIDS) are especially vulnerable, given their lack of economic diversification and their high
dependence on tourism and remittances. The latter are expected to sharply decline in 2020.
With their added high dependence on food imports and other basic necessities, the
vulnerability of these countries is expected to sharply increase under the current Global
Lockdown. Equally worrying is the indebtedness of many developing countries that have

 Page 1
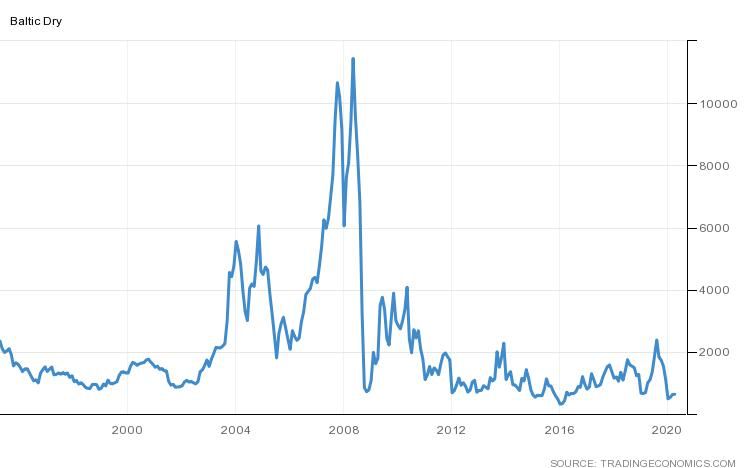
Comparing crises: Great Lockdown versus Great Recession

instigated lockdown measures, which could exacerbate their illiquidity and fiscal constraints
that may ultimately lead to debt defaults.

Many developing countries that are vulnerable to COVID-19 are also susceptible to localised
shocks, particularly in Africa, in the form of locust outbreaks or other pest and disease
incidences, as well as civil strife. These countries require special attention. The world food
economy was ill-prepared for the shocks that characterized the global food crisis in 2007-2008
and the recession that followed in 2009. A combination of adverse supply (poor crops in
several exporting countries) and positive demand shocks (biofuels) created a sudden and
substantial gap in food supplies that could not be met by a drawdown of stocks, which
incidentally, were hovering around multi-year lows. Spiking transportation costs and adverse
policy reactions (notably, export restrictions) exacerbated the impact of the supply gap on
international markets and resulted in a pronounced price hike for basic foods.

A compelling finding of this study is that the initial conditions of the Great Lockdown are in
stark contrast to those of the Great Recession and are far more supportive to avoiding an all-
out potential food crisis. Food stocks are ample, staple food prices are low, trade is much more
diversified with more and more importers and exporters partaking in global trade. Farmers are
also on an assured footing, with fertilizer, energy and other input prices at very low levels, and
where relevant, given the collapse in demand for biofuels, competition for agricultural
feedstocks for energy has diminished.

That said, where agriculture and associate supply chains are labour-intensive, the effects of the
Great Lockdown are bearing down prominently. Labour market shocks arise from mobility
restrictions on workers and the direct health impacts of the new coronavirus, weighing directly
on the ability of workers to produce or process food. They also arise from unemployment and
underemployment and a possible deterioration of occupational health and safety (OHS)
standards.

Finally, a commonality between both crises concerns logistics, in that local and international
distribution channels constitute an important channel of transmission of macroeconomic
shocks into food and agriculture. While the Great Recession caused transportation costs to rise
across all modes of transportation, the impacts of the Great Lockdown are strongly
differentiated across transportation modes. Costs for bulk shipments are at levels close to the
all-time lows, while they reached all-time highs during the Great Recession. However, costs for
container and truck transportation, while still low overall, could be highly exposed, particularly
if labour and or container shortages become more commonplace. The hardest hit segment is
air cargo, particularly for foods transported in the bellies of passenger planes; as these
shipments have come to a near standstill, volumes of food shipped, especially for perishables,
have precipitously declined creating large price wedges for high value foods between
exporting and importing regions. Again, island states and SIDS in particular are most severely
affected, given their remoteness from regular transportation routes.

Guidance for policy

This study finds that “global stabilisers” – allowing market forces to equilibrate markets –are
key to solidifying the fundamentals for international food security. However, the hindrances
to logistics and distribution must be addressed and mitigated. In this regard, governments
must recognise the importance of ensuring that trade, whether internal or international,

 Page 2
Comparing crises: Great Lockdown versus Great Recession

remains open and frictionless, free from restrictions, and meets capacities in terms of volumes.
This also implies speedy clearances at customs, borders and ports.

The truism that food is the most fundamental need, necessitates that farmers and agricultural
workers are placed on the same footing as health workers engaged in fighting COVID-19. The
same is true for global and national food systems to be equally regarded as health systems in
ensuring that hunger and poor nutrition are left unabated, which requires that farmers
maintain and invest in productivity with access to affordable credit, and consumers have
normal access to procure food needs on the international marketplace Not all countries can
manage, especially SIDS, which are highly dependent on food imports, as well as localised
shock-prone countries in sub-Saharan Africa, and therefore international intervention will be
required to safeguard their populations.

INTRODUCTION AND OBJECTIVE
With the new coronavirus spreading rapidly, the impacts of the COVID-19 pandemic on global
agricultural markets are becoming increasingly apparent. The contours of these impacts are
shaped by changes in macroeconomic environments, energy and credit markets, and
importantly, input prices and prices in agricultural factor markets. Some of these shifts
resemble those of previous global crises, while others are markedly different. Understanding
and analysing differences and similarities to the crisis of 2007-2009 through lessons learnt can
help target policy responses in addressing the challenges of the ongoing severe economic
crisis.

This assessment gathers evidence as is available so far and compares the two crises based on a
number of selected indicators. It brings to the fore commonalities and differences, examines
the underlying factors and the initial conditions that explain sector-specific differentials. The
assessment identifies differences in the effect on the food and agricultural sector between the
two crises and across countries and commodities. Based on these comparisons, it identifies
hotspots of the current crisis and potential areas for targeting policy responses to address
related problems.

 Page 3
Comparing crises: Great Lockdown versus Great Recession

Table 1: Overview – Comparing Crises
 Great Recession Great Lockdown
 (estimated/probable)
 1. GDP growth -0.1% -3%, estimates
 High income -3.3% -6.1%, estimates
 Middle income 2.8% -1.0%, estimates
 Low income
 2. Unemployment Sharp rise Highest since the Great Depression
 3. Equity prices “Lehman crash” “Corona crash”
 World (MSCI ACWI) -42.2% -16.39% by April 2020
 Developed Markets (23) -40.7% -15.7% by April 2020
 Emerging markets -53.3% -21.11% by April 2020
 4. EX Rates US Dollar weakness US Dollar strength
 5. Transportation costs
 bulk Prices at all-time highs Prices near all-time lows
 airfreight No major impact on capacity Sharp decrease in capacity
 6. Macro policy response
 Monetary Beginning of QE Multitude of QE and QE-like
 programs (PEPP, ESM, etc.)
 Fiscal Moderate expansion, large Massive expansion: 11.7% of GDP in
 (by 10 April 2020) differences across countries advanced G20, 2% in emerging G20
 7. Trade (merchandise) Sharp contraction by 17% Possible contraction by 13.6%-32%,
 estimates
 8. Food and Agriculture
 Food prices Boom-bust-boom Bust
 Supply Several simultaneous crop failures Ample supply, generally good
 prospects for 2019/20
 Demand Added demand from biofuels Declining biofuel use, African swine
 fever
 Food Stocks
 Levels Multi-year low Multi-year high (twice 2007)
 Stocks-to-use Multi-year low Multi-year high
 Concentration of “storers” High, CR5=64% Very high, CR5=73%

 Agricultural Trade Sharp contraction by 4.5% Possible contraction by 7.1%-13.5%,
 estimates
 9. Input prices All-time highs Multi-year lows
 10. Agricultural policy response
 Exports Export restrictions and bans Occasional export restrictions
 Imports Focus on lower tariff barriers Focus on higher non-tariff barriers
 11. Investment in agriculture Investment boom followed Investment bust to follow?
 commodity boom
Sources are compiled in Annex 3

Impacts on overall economic activity – GDP levels and growth

In reaction to the outbreak, practically all national, international and private agencies have
revised down their economic growth forecasts. The extent and duration of the predicted
slowdown or downturn across these forecasts differ widely and estimates are being updated
as new information about the spread and likely duration of the pandemic become available.
But all forecasts point to across-the-board contractions in GDP.

On 2 March 2020, the Organization for Economic Cooperation and Development (OECD)
revised its global growth forecast for 2020. Even in the best-case scenario of limited outbreaks
in countries outside of China, a sharp slowdown in global GDP growth is expected in the first

 Page 4
Comparing crises: Great Lockdown versus Great Recession

half of 2020. It is argued that supply chains in most sectors would be significantly disrupted,
commodity markets would be hit hard, tourism could drop precipitously, and overall economic
confidence would falter.

In addition, the OECD offered a much more significant growth reduction scenario. A broader
contagion across the wider Asia-Pacific region and in advanced economies – as has happened
in China - could cut global growth to as low as 1.5 percent in 2020, halving the OECD’s previous
2020 projection released in November 2019. Containment measures and loss of confidence
would hit production and spending, and drive some countries into deep recession, including
Japan and the Euro area.

As the severity of the crisis became increasingly manifest, national and international
institutions further cut their growth forecasts. For instance, the economic outlook of the
Federal Reserve Bank of St. Louis projected the United States of America unemployment rate
to reach 30 percent in the second quarter of 2020, reflecting shutdowns to combat the spread
of COVID-19. The same outlook expected an unprecedented 50 percent drop in GDP for the
second quarter of 2020.

On 14 April 2020, the IMF released its World Economic Outlook, which forecasts a global
recession to the tune of -3 percent fall in world GDP in 2020. This compares to a mere -0.1%
reduction in 2009. The IMF expects global growth to rebound in 2021 with a growth rate of
5.8% in 2021. Relative to the outlook prior to the Great Lockdown, GDP growth will still lie
considerably below the level expected for 2021. The cumulative output loss in both 2020 and
2021 amounts to US dollar 9 trillion according to the IMF (IMF, World Economic Outlook, April
2020, 2020). The IMF projections also suggest that all country groups, rich and poor alike, will
experience an economic contraction. While the anticipated recessions in high-income
countries will be deeper and will last longer, also low-income countries will be affected.

The Great Lockdown: Unlike the Great Recession, a truly global crisis
While the Great Lockdown will result in a deeper global recession, the Great Recession was
mainly an economic crisis of developed countries. Based on World Bank data, the country
groups of “lower middle income” and even more so those in the “low income” category
survived the Great Recession relatively unscathed (Figure 1) . Some commodity exporters,
many of which are middle income emerging economies, even saw their GDP rise in the
aftermath of the initial 2007-2008 crisis, benefitting from both high energy and food prices.
Overall, the Great Recession was mainly a “high-income” and “upper middle income country”
crisis, not a low-income country crisis (Figure 1).

 Page 5
Comparing crises: Great Lockdown versus Great Recession

 Lower income countries largely unscathed by the Great Recession

 High income Upper middle income Lower middle income
 Low income World
 10.0

 8.0

 6.0
GROWTH RATE, %

 4.0

 2.0

 0.0

 -2.0

 -4.0
 00
 01
 02
 03
 04
 05
 06
 07
 08
 09
 10
 11
 12
 13
 14
 15
 16
 17
 18
 20
 20
 20
 20
 20
 20
 20
 20
 20
 20
 20
 20
 20
 20
 20
 20
 20
 20
 20
 Source: World Bank, WDI

Figure 1: GDP growth, annual changes in percent, by income group

The Great Lockdown by contrast appears to affect developing countries more severely. The
revised IMF outlook of 14 April 2020 (IMF, World Economic Outlook, April 2020, 2020) predicts
GDP of emerging and developing countries to contract by 1 percent in 2020, those of energy
and commodity exporters such as Russian Federation and Brazil by -5.5 percent and -5.3
percent, respectively. Relative to the prior IMF predictions of January 2020, the GDP of
emerging and developing countries will be lower on average by 5.4 percent; particularly hard
hit will be Latin America and Developing Europe, where the new (April) GDP projections for
2020 will respectively be -7.4 percent and -7.8 percent lower than expected in January. Many
of these emerging economies are commodity exporters and thus heavily exposed to the sharp
deterioration in energy and metal prices (Table 1) and, to a lesser extent, falling prices of
agricultural products (denominated in US Dollars). This outcome would be in a stark contrast
with the Great Recession and, despite the relatively high GDP levels in these countries, could
result in higher poverty and even undernourishment problems.

 Page 6
Comparing crises: Great Lockdown versus Great Recession

Table 2: Energy and metal prices since January 2020
 Unit Price Unit Price Unit Price Mar/Feb Mar/Jan
 (Mar20) (Feb20) (Jan20)
 oil, WTI (USD/Barrel) 22.43 53.78 58.34 -58.3% -61.6%
 Platinum (USD/Ounce) 600.48 982.10 1020.20 -38.9% -41.1%
 Palladium (USD/Ounce) 1703.56 2677.30 2496.41 -36.4% -31.8%
 Silver (USD/Ounce) 12.85 18.40 18.06 -30.2% -28.9%
 copper (USD/Ton) 4854.85 5729.00 6244.50 -15.3% -22.3%
 nickel (USD/Ton) 11370.00 12681.50 13842.50 -10.3% -17.9%
 Lead (USD/Ton) 1673.00 1938.75 1952.85 -13.7% -14.3%
 Aluminum (USD/Ton) 1583.00 1711.15 1815.74 -7.5% -12.8%
 iron ore 89.57 86.15 94.80 4.0% -5.5%
 (USD/DM Ton)
 Gold (USD/Ounce) 1506.95 1621.31 1560.82 -7.1% -3.5%

Island states are always hard hit
While the group of low-income and middle-low income countries escaped the Great Recession
relatively unscathed, high income countries had to bear the brunt of global shocks. These are
at least the effects visible at a high level of aggregation across countries. This differentiation
between rich and poor no longer holds for island economies. Practically all island states, rich
and poor alike, saw their incomes plunge in 2009 (Figure 4). They were exposed through a
number of different channels, not least their high reliance on tourism and lack of
diversification, on remittances and their distance to major markets, which made
transportation to and from their markets more expensive. The 2020 crisis will exert an even
more significant shock on island economies, given their massive dependency on the tourism
and hospitality sector.

SIDS will be hardest hit
In many SIDS, inbound tourism accounts for more than 60 percent of GDP (Figure 5) and early
indications suggest a contraction in the sector by up to 90 percent. And while island economies
may benefit from lower transportation costs, the adverse impacts on inbound tourism, lower
inbound remittances and the direct health exposure of created by COVID-19 on their labour-
intensive economies are likely to exceed such benefits by a wide margin.

Many SIDS are not only exposed through their high dependence on tourism, they also import
large shares of the food they consume. The food import dependency rates (FAO, FAOSTAT,
2020)1 depicted in Figure 2 suggest that many SIDS are not only dependent on tourism for their
foreign exchange earnings, but also spend a large share of these earnings on food imports.
Therefore, without export earnings from tourism, their capacity to import food is in jeopardy.

1
 Estimates are based on FAOSTAT, see Annex 2 for methodological details

 Page 7
Comparing crises: Great Lockdown versus Great Recession

 Extreme dependence by many SIDS on imports to meet food needs
 2015/17 Average

 100
 90
 IMPORT DEPENDENCY RATES, %

 80
 70
 60
 50
 40
 30
 20
 10
 0

 on Cu iji

 Be na
 Sa arb go

 Gr N s
 B a V er a

 Isl ba
 Su -Les s

 in a
 d ba s

 Ca int L da

 an Kit B ena s

 ri te
 an am e

 au sau

 Ki nds
 in H oa

 e
 d ts ah da

 Ti nad vis

 Sa ipe

 -B iti

 us

 Gu rea
 rb de

 ic u i
 Ko u
 bl an at
 or e
 e nd a
 Gr ado
 an To ive

 i

 Pr ic
 e J nam

 liz
 of at
 F
 bo uc

 ea a
 th a am

 m in

 iti
 u

 ya
 m

 pu V ib
 e e

 d a
 c

 is

 a
 ua nd ld

 r

 r
 tig d a Ma

 B

 M

 m
 Gu

 lo
 An ida

 So
 m

 Re
 nt nt

 To
 in

 ce ai

 's
 Tr

 in S

 o

 le
 Sa

 op
 Pe
 tV

 tic
 in

 ra
 Sa

 oc
 m
De
 Source: Own calculations (Annex) based on FAOSTAT
 FBS
Figure 2: Import dependency rates (%) of Small Island Developing States

 Remittances contribute heavily to GDP in many SIDS
 40
 PERSNAL REMITTANCES, %

 35
 30
 25
 20
 15
 10 World, 0.75%
 5
 0
 ri u
 CaComlanca

 en . u

 St Ne te

 So d B urit os
 a

 . K Ti Gr inc ize

 ea
 itt mo en ipe

 a Lu is

 m yc u s
 r l i
 bo o ds

 pu M ob rld
 i
 ce M nic D uy uru
 an on uin Re in a
 d es ea pu ica

 a S ald ago
 e , F is lic

 Va dints.

 u

 an Marba cia

 an s
 nu es
 Tuerdes

 on h da

 an Pal ds
 d Wo au

 w ina es
 in e
 al m oa

 nd Le a
 sh Ja m i

 d Be Fij
 Nabat
 ar SaHait

 lo Se arb iu
 Isl elle
 V ro
 ng

 nt icr G an om an

 s a r- ad

 Gu m
 Gr ed sa
 Ki val

 at

 v
 s
 l Is ai

 th ia -B b

 Ne ur iv
 d
 a S
 To

 .
 G

 T
 P

 B
 an

 ad
 e

 ua
 M

 m
 i

 id
 m

 tig
 St
 To

 Pa
 in
 Do

 An

 Tr
 o
 Sa
 in
 .V

 Source: World Bank, WDI
 St

Figure 3: Personal remittances, share of GDP, 2016-2018 average

In addition to export earnings from inbound tourism, SIDS are also dependent on remittances
for their foreign exchange supply (Figure 3). Under the Great Lockdown, many SIDS are being
affected not only through tourism, but also through lower remittances, as many citizens of
SIDS working abroad could lose their jobs or see their wages cut. In summary, this means that
SIDS face a particularly precarious situation where their high food import dependency is no
longer supported by inflows of foreign exchange, neither from tourism nor from remittances.

 Page 8
Comparing crises: Great Lockdown versus Great Recession

This underlines that SIDS must receive particular policy attention and assistance to avoid more
significant hardship.

 Tourism is the chief driver of GDP in the majority of SIDS
 (2016-18 average, countries>10%)
 Sint Maarten
 China, Macao SAR
 Turks And Caicos Islands
 Aruba
 Maldives
 Antigua And Barbuda
 Saint Lucia
 Anguilla
 Palau
 Grenada
 Seychelles
 Saint Kitts And Nevis
 Vanuatu
 Saint Vincent And The Grenadines
 Dominica
 Bahamas
 Cabo Verde
 Fiji
 Belize
 Montenegro
 Barbados
 Samoa
 Croatia
 Georgia
 Curaçao
 Jamaica
 Cambodia
 Montserrat
 Albania
 Mauritius
 Cayman Islands
 Lebanon
 Cyprus
 Jordan
 Thailand
 Malta
 Iceland
 Bahrain
 China, Hong Kong SAR
 Tonga
 Marshall Islands
 Panama
 0 20 40 60 80 100
 PERCENT
 Source: UNWTO, own calculations

Figure 4: Share of inbound tourism in GDP, by country, 2016-18 average

 Page 9
Comparing crises: Great Lockdown versus Great Recession

 Island states affected by the Great Recession

 World

 16 Caribbean
 14 Atlantic Ocean, Indian Ocean and South China Sea
 12 Pacific Ocean
 10
 GROWTH RATE, %

 8
 6
 4
 2
 0
 -2
 -4
 00
 01
 02
 03
 04
 05
 06
 07
 08
 09
 10
 11
 12
 13
 14
 15
 16
 17
 18
 20
 20
 20
 20
 20
 20
 20
 20
 20
 20
 20
 20
 20
 20
 20
 20
 20
 20
 20
 Source: World Bank, WDI

Figure 5: GDP growth, island states, annual changes in percent

Credit markets
The 2007-2009 crisis was in its core a “credit crunch” – a sharp drop in liquidity - which mainly
affecting developed markets. Higher food prices and economic spill-over effects
notwithstanding, developing countries remained less directly affected, not least in their lower
exposure to the financial instruments (sub-prime mortgages, CDOs) that were undermining the
financial sector in developed countries. The 2020 crisis also affects credit markets and there
are reasons to assume that developing countries could be hard hit, given their high
indebtedness in foreign currencies, sharply falling exchange rates and low commodity and
energy prices which make it harder to service these debts.

In response to the COVID-19 crisis, central banks around the world intervened in lowering
interest rates. By 23 March 2020, 39 central banks2 had lowered interest rates or increased
liquidity. Despite these interventions, market rates for borrowing fresh capital have often
risen,3 particularly in low-income countries. A Jubilee Debt Campaign (jubileedebt.org, 2020)
reported that interest rates have on average risen by 3.5 percentage points for low- and
middle-income countries since mid-February, and that costs for new borrowing stood at 10
percent.

A recent report (UNCTAD, 2020) by the United Nations Conference on Trade and Development
(UNCTAD) showed how sustained debts could pose a larger problem for the global economy
and financial system. According to the report, in 2018, total debt (private, public, domestic and

2 Inter alia, the Central Banks of the United States of America (Fed), Euro Area (ECB), United Kingdom of Great
Britain and Northern Ireland (BoE), Brazil, Chile, China, Hong Kong SAR, Indonesia, the Republic of Korea, Mexico,
New Zealand, Norway, Peru, Philippines, Poland, Romania, South Africa, Thailand, and Turkey.
3 There are several factors that led to higher interest rates. Importantly, the rapid price declines in other asset

classes, notably equities, forced many investors to sell bonds (including T-bills and German bunds). This in turn led
to downward pressure on bond prices and increases in the underlying yields (interest rates).

 Page 10
Comparing crises: Great Lockdown versus Great Recession

external) across developing countries was equal to almost twice their combined GDP—the
highest ever. The build-up of private debt by non-financial corporations, e.g., private and
public enterprises, which now amounts to nearly three-quarters of total debt in developing
countries (a much higher ratio than in advanced economies), is seen as particularly concerning.
According to UNCTAD, inherently volatile “foreign shadow financial institutions” have played a
major role in fuelling this accumulation, such that around one-third of private non-financial
corporate debt is located in low-income countries. Similarly, a report by the IMF (IMF,
Macroeconomic Developments and Prospects in Low-Income Developing Countries,
2018)shows that rising debt levels have led to increased debt vulnerabilities in many low-
income developing countries (LIDCs). While debt vulnerabilities remain contained in the
majority of LIDCs, some 40 percent of them currently face significant debt-related challenges,
up from 21 percent in 2013. Nine-of-twelve countries that moved from “low/moderate risk” to
“high risk/in debt distress” are located in sub-Saharan Africa.

With rising costs for capital, the impacts would also be felt in agriculture, notably capital-
intensive forms of production. Credit markets could become an important channel of
transmission, adversely affecting capital-intensive agriculture. Capital intensive production in
low-income countries (e.g. row crops in Latin America) could be particularly hard hit. This
would further deteriorate the commodity terms-of-trade for many commodity-dependent
LIDCs that has been underway since the last price hike in 2012.

Exchange rates
One of the immediate outcomes to the 2020 COVID-19 crisis has been an adverse change in
exchange rates. Figure 7 presents the changes in exchange rates since January 2020 for most
of the largest economies relative to the US Dollar. A common feature of the currency shifts
was a significant (trade-weighted) appreciation of the US dollar against almost all other
currencies, visible in Figure 6. The same holds, albeit to a lesser extent, for the Euro.

The rising US Dollar prior to and during the Great Lockdown has had immediate impacts on
world trade and international prices. The Dollar strength has made non-US exporters more
competitive and kept a lid on US Dollar denominated commodity prices, notably maize and
sugar, which suffered from both lower energy prices and high export availabilities. Over the
medium-term, the Dollar strength in conjunction with higher commodity prices could add to
inflationary pressures in commodity exporting countries. It could also add to existing problems
in servicing dollar-denominated debts, which have seen a massive increase over the past years.

The exact opposite shifts in exchange rates were observed during and after the Great
Recession. Particularly the so-called commodity currencies that benefited from a run-up in
commodity prices and saw their currencies appreciate vis-à-vis the US Dollar. Figure 6
compares the trade-weighted changes in exchange rates against the US Dollar between the
two crises.

 Page 11
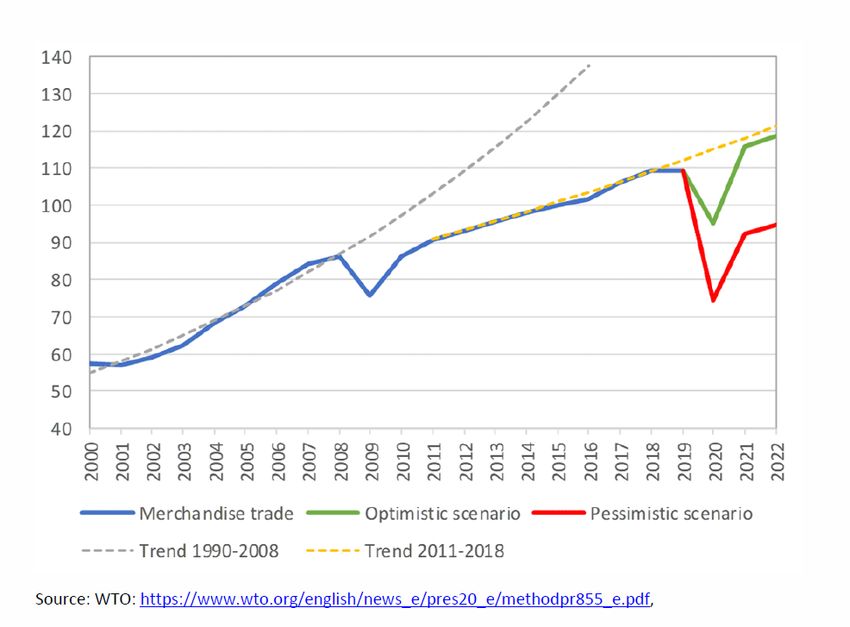
PERCANTAGE CHANGE USD INDEX

 Trade
 0

 -35
 -30
 -25
 -20
 -15
 -10
 -5
 100
 110
 120
 130

 60
 70
 80
 90
 Zambian Kwacha 2013-06 2001-01
 Basotho Loti
 Namibian Dollar 2013-12 2001-07
 Swazi Lilangeni 2014-06 2002-01
 South African Rand
 Brazilian Real 2014-12 2002-07
 Mexican Peso
 Seychellois Rupee 2015-06 2003-01

 Total merchandise trade
 Sudanese Pound 2015-12 2003-07
 Kyrgyzstani Som
 Colombian Peso 2016-06 2004-01
 Russian Ruble
 Belarusian Ruble
 2016-12 2004-07
 Icelandic Krona 2017-06 2005-01
 Angolan Kwanza
 Norwegian Krone 2017-12 2005-07
 Ukrainian Hryvnia 2018-06 2006-01
 Uruguayan Peso
 2013-2020

 Indonesian Rupiah 2018-12 2006-07

 Figure 6: US Dollar Index, Trade-weighted USD exchange rate
 Botswana Pula
 2019-06 2007-01

Page 12
 Chilean Peso
 Kazakhstani Tenge 2019-12 2007-07
 Turkish Lira

 Dollar Jan-Apr 2020
 the Great Lockdown

 Georgian Lari 2020-06 2008-01

 Figure 7: Depreciation rates in percent, January – March 2020, by country
 New Zealand Dollar
 Australian Dollar 2008-07
 2001-2012

 Tuvaluan Dollar 2009-01
 Hungarian Forint
 Polish Zloty 2009-07
 Mozambican Metical
 Czech Koruna
 2010-01
 Mauritian Rupee 2010-07
 Thai Baht
 Argentine Peso 2011-01
 Comparing crises: Great Lockdown versus Great Recession

 Pakistani Rupee 2011-07
 Canadian Dollar
 From a weak Dollar in the Great Recession to a strong Dollar in

 Sharp depreciations of "commodity currencies" vis-a-vis the US

 Ni-Vanuatu Vatu 2012-01

 In a first impact assessment, the World Trade Organisation (WTO) estimated that total
 Albanian Lek
 Nepalese Rupee 2012-07
 Bhutanese Ngultrum

 merchandise trade is expected to fall between 13 to 32 percent in 2020 (WTO, Trade set to
 2013-01
 Indian Rupee

 plunge as COVID-19 pandemic upends global economy, 2020). The WTO notes that “the wide
 Source: www.xe.com
 Source: investing.com
Comparing crises: Great Lockdown versus Great Recession

range of possibilities for the predicted decline is explained by the unprecedented nature of this
health crisis and the uncertainty around its precise economic impact. But according to WTO
the decline will likely exceed the trade slump brought on by the global financial crisis of
2008-09” (Figure 8).

The WTO expects a recovery in trade in 2021. although the extent of the recovery is likely to be
limited. The WTO offers two recovery scenarios and only in the optimistic case, global
merchandise trade is likely to resume its pre-crisis trajectory. After the financial crisis of 2008-
09, trade never returned to its previous trend (Figure 8). The WTO notes that a “strong
rebound is more likely if businesses and consumers view the pandemic as a temporary, one-
time shock. In this case, spending on investment goods and consumer durables could resume
at close to previous levels once the crisis abates”. If the outbreak is prolonged and/or recurring
uncertainty becomes pervasive, households and business are likely to spend more cautiously.

 Total Merchandise Trade to contract significantly
 volumes in constant prices of 2010

Figure 8: Total merchandise trade, 2000-2022 under different COVID-19 impact assumptions

The WTO study also offers estimates of the extent of impacts across major groups, both across
merchandise trade and trade in services (WTO, Methodology for the WTO Trade Forecast of
April 8 2020, 2020). Unsurprisingly, trade in health care services will be least affected.
Depending on the recovery path, it will decline by -1.2% (V-shaped), -6.4% (U-shaped) and -
8.0% (L-shaped recovery). Trade in basic pharmaceutical products is even projected to rise,
because it is an important input into the Health Care sector, whose demand alone in the public
sector is assumed to rise by 50 percent.

Trade in food and agriculture
Trade in agriculture and processed food is projected to contract more significantly, but less
than the average across all goods and services. A number of reasons suggest that agricultural

 Page 13
Comparing crises: Great Lockdown versus Great Recession

trade is likely to be less affected by the Great Lockdown than total merchandise trade. First,
demand for agricultural products is relatively income inelastic; food is an essential product for
all countries, and the options for import substitution, i.e. replacing food imports through
domestic production are rather limited in the short-term. Second, a lot of agricultural trade
takes place in bulk shipments, highly capital-intensive, highly automatized with little human
interaction. Bulk shipments also benefit from lower transportation costs, which account for an
above average element of shipments compared to other, more expensive goods. Disruptions
due to health reasons or strikes are no-doubt possible, but they are less likely to result in
lasting disruptions of bulk shipments. For processed food products, where bulk shipments play
a lesser role, the impacts of COVID-19 are expected to be more pronounced. Third, while
global value chains in food and agriculture are also becoming increasingly complex, the
international division of labour in international food and agriculture is much less pronounced
than in other sectors such as consumer electronics or the automotive industry. Finally,
international prices for food and agricultural goods have so far remained low or have even
declined, which has limited recourse to widespread trade restricting measures such as export
bans or taxes.

 Total Agricultural Trade to contract more markedly in the Great
 Lockdown
 (volumes based on WTO 2020 forecasts)
 1 700
 ag exports V-shape U-shape L-shape
 AGRICULTURAL EXPORT VOLUME, USD BILLIONS

 1 600
 1 500
 1 400
 1 300
 1 200
 1 100
 1 000
 900
 800
 700
 2000
 2001
 2002
 2003
 2004
 2005
 2006
 2007
 2008
 2009
 2010
 2011
 2012
 2013
 2014
 2015
 2016
 2017
 2018
 2019
 2020
 2021
 2022

 Source: WTO, own calculations

Figure 9: Agricultural trade projections, own calculations based on WTO estimates

Greater diversification in agricultural trade
Exposure of the global trading system to a crisis is also conditioned by the concentration of
exporters and importers. A high concentration of exporters makes markets susceptible to
logistical constraints or policy interventions (export restrictions) imposed by large players,
potentially jeopardising access to food for importers. Conversely, a high concentration on the
import side could mean that a sharp reduction in import demand of one or two major
importers could jeopardize revenue streams for exporters dependent on these agricultural
exports.

 Page 14
Comparing crises: Great Lockdown versus Great Recession

Figure 10 depicts the change in concentration for all agricultural commodities, both for exports
and imports.4 The changes are based on the differences between the average Herfindahl-
Hirschman Index (HHI) prior to the two crises, i.e. the difference between the average of HHIs
from 2013 to 2017 and the average from 2003 to 2007. The calculations are undertaken for all
agricultural commodities. Comparing the pre-crisis situation between 2007 and 2009 and in
2020 suggests that the concentration of agricultural trade has declined for many products on
both the export and import side, i.e. for many agricultural products. These are the bubbles in
the lower left quadrant of Figure 10, i.e. all commodities for which the number of importers
and exporters has risen, not declined. This means that, when moving into the 2020 crisis, more
exporters and importers were participating in trade, which should make the global trading
system for any given commodity more resilient to shocks not more vulnerable.

Despite the greater diversity over importers and exporters in general, there are a number of
noticeable deviations from this trend, i.e. commodities where either imports or exports (or
both) have become more concentrated over countries. The latter (both more concentrated
imports and exports) are commodities depicted in the upper right quadrant of Figure 10,
entitled “less diversified imports, less diversified exports”. The most important product in this
rubric is the global soybean, where China has become the dominant importer with a world
market share close to 65 percent. Also, exports have remained in the hands of a few countries,
notably the United States of America, Brazil, Argentina and, more recently, Paraguay.

The generally greater diversification offers added resilience to the agricultural trading system,
which should prove increasingly important, as the number of importers and exporters affected
by the crisis rises.

4
 Trade values and commodity disaggregation used are based on the trade domain of FAOSTAT.

 Page 15
Comparing crises: Great Lockdown versus Great Recession

 Generally more diversity in agricultural imports and exports
 CHANGE IN HHI FOR IMPORTS BETWEEN 2003/07 AND 2015/17, SQRT HHI 2013/17 vs HHI 2003/07

 0.6
 A B
 More diversified exports, Less diversified exports,
 0.4
 less diversified imports less diversified imports
 Soybeans

 0.2
 Wheat Cheese, cow milk Palm oil
 Crude mats.
 Rice
 Alcoholic bev. 0
 -0.6 -0.4 -0.2 0 0.2 Products
 Choc. 0.4 0.6
 Maize
 Cigarettes
 -0.2
 Wine Beef
 Pastry Cake, soybeans
 Meat, chicken
 -0.4
 More diversified exports, Less diversified exports,
 more diversified imports more diversified imports
 -0.6
 D CHANGE IN HHI FOR EXPORTS BETWEEN 2003/07 AND 2013/17, SQRT C
 Note: Changes in HHI for imports/exports between 2003/2007 and 2013/2017 are presented on a square root
 scale. For negative values, we take the squareroot of the absolute value and the values as negative ones.

 Source: FAOSTAT, own calculations

Figure 10: Changes in the HHI for all traded commodities, imports and exports

Food prices
Arguably the most important difference for global food security between the two crises lies in
the differences in the levels and the changes in food prices. The 2007-2008 crisis was
characterised by a sharp increase in practically all basic food items, whereby staples such as
rice and wheat saw the most impressive hikes (Figure 11). The price hikes for basic foods on a
global level also made the 2007-2008 crisis a particularly serious one. Consumers were not
only losing jobs and incomes; they also saw their purchasing power decline as food prices rose.
The price changes caused by the 2020 crisis are in stark contrast to the 2007-2008
developments. With the exception of smaller increases in international quotations for wheat
and rice, prices for most other basic foodstuffs actually declined, particularly those for
vegetable oils and sugar (Figure 11).

Barring major disruptions in the supply chain, the projected recession means that the trend in
generally lower food prices could prevail throughout the current crisis. Lower food prices on
international markets should also attenuate global food security concerns compared to the
Great Recession; but they cannot necessarily prevent local, national and international
disruptions in food supply chains. Neither do they ensure that prices in local currencies do not
see increases, given the often-hefty depreciation of currencies against the US Dollar.

 Page 16
Comparing crises: Great Lockdown versus Great Recession

 Food price hikes in the Great Recession
 Food price slumps in the Great Lockdown

 120% Dec 2019 vs. Mar 2020 Jul 2007 vs. Oct 2007 Jul 2007 vs. Jul 2008

 100%
 CHANGE OF PRICE INDEX

 80%
 60%
 40%
 20%
 0%
 -20%

 s

 ls
 e
 at
 od

 ce
 t
 t

 vin at

 s

 iry
 t

 r
 ea

 ea

 al

 ed
 aiz
 ea

 ga
 Oi
 he
 e

 Ri
 Fo

 re

 Da
 gM

 M
 M

 lSe
 M

 Su
 M
 W
 Ce
 e
 try

 Oi
 Pi

 ul

 Bo
 Po

 Notes: Data of Jul 2007, Jul 2008, and Dec 2019 are averages between Jun-Aug 2007, Jun-Aug 2008, and Nov 2019-Jan 2020

 Source: FAO, AMIS

Figure 11: Price changes for food products, Great Recession vs Great Lockdown

Food stocks and “storers”
Food stocks play a critical role in smoothing consumption and contributing to food security.5
“Storers” smooth out troughs in prices after large harvests by “buying low and selling high”.
They reduce the risk of expected shortages by holding stocks and thus raise the current prices
and lower future ones. When stocks run out, shocks must be absorbed by drops in the use of
supplies for animal feed use or biofuels production, or less much desirably, by poor (food
insecure) consumers.

At the beginning of the 2007-2008 food crisis, cereal stocks both in absolute terms (Figure 12)
and relative to utilization hovered around a multi-year low (Figure 12). These low stock levels
made the global food supply system more susceptible to exogenous shocks. A number of
shocks were exerted on the global food system, arising from both the supply side and the
demand side. On the supply side, successive drought-affected wheat crops in Australia
(2006/07 and 2007/08) combined with below-average cereal crop in the European Union in
2006/07, and a low US maize crop in 2006/07 led to a shortage in available supplies, notably
for wheat. On the demand side, the burgeoning use of biofuels reduced the availability of
maize for food and feed and diverted other grains into non-food uses. In response, prices had
to rise to ration demand and create incentives to step-up production for the next season.

5 Food security analysts therefore monitor the availability of food stocks with great attention. This monitoring task was at the
heart of the AMIS project, a G20 initiative, established in the aftermath of the 2007-2008 food crisis. Its main mandate focuses on
four important food products that critically influence international food security. This mandate arose from the recognition that
low storage levels prior to the 2007-2008 world food crisis comprised the buffer capacity of global food markets to exogenous
shocks, arising either from the supply side (weather, droughts or floods) or the demand side (mandated allocation of agricultural
products to non-food uses). The 2007-2008 crisis was characterised by both, a supply and a demand shock.

 Page 17
Comparing crises: Great Lockdown versus Great Recession

 Global Cereal Stocks:
 Multi-year lows during the Great Recession, multi -year highs in
 the Great Lockdown
 (closing levels)
 1 000
 Rice-milled Wheat Coarse grains CEREALS
 800
 MILLION TONNES

 600

 400

 200

 0
 1995/96
 1996/97
 1997/98
 1998/99
 1999/00
 2000/01
 2001/02
 2002/03
 2003/04
 2004/05
 2005/06
 2006/07
 2007/08
 2008/09
 2009/10
 2010/11
 2011/12
 2012/13
 2013/14
 2014/15
 2015/16
 2016/17
 2017/18
 2018/19
 2019/20
 Source: FAO, CCBS

Figure 12: Cereal stocks, evolution across crises

At the beginning of the 2020 COVID-19 crisis, cereal stocks hovered around a multi-year high of
about 850mmt. In absolute terms they were nearly twice as high as at the beginning of the
2007-2008 crisis (472mmt) and even relative to utilisation, they had reached levels much
above those registered in 2007-2008. These high stocks should provide a solid buffer against
adverse shocks such as, for instance, bad weather in the 2020/21 growing season. While
important, the absolute levels of stocks are not all that matters for buffer capacity. Equally
important is the distribution of stocks over countries, over exporters and importers and
importantly their concentration over storers (few or many).

Table 3 summarizes the concentration of cereal stocks for the top 1, 3, 5 and 7 storers in
2007/08 and 2020. All calculations are based on quantities. It shows that the concentration of
stocks across countries was already very high in 2007/08 but has further increased over time. A
large share of stocks is not only in the hands of a few countries, but also held by storers like
China and India who may not be responsive to global price signals. Put into the context of the
current crisis, the high stocks held globally may not provide as much buffer capacity as their
absolute levels suggest in the case of a disruption in the global supply chains, caused, for
instance, by a breakdown in bulk shipment facilities.

 Page 18
Comparing crises: Great Lockdown versus Great Recession

Table 3: Concentration ratios of global cereal stocks (closing levels)

 cr1 cr3 cr5 cr7
 2007/08 37% 62% 64% 67%
 CHN CHN, USA, EUR CHN, USA, EUR, CHN, USA, EUR,
 IND, RUS IND, RUS, CAN, UKR
 2019/20 49% 65% 73% 76%
 CHN CHN, USA, IND CHN, USA, IND, CHN, USA, IND,
 EUR, BRA EUR, BRA, ARG, RUS

Energy markets, biofuels and agricultural input markets
Agriculture is a highly energy-intensive industry. Energy markets affect agriculture both on the
input and the output side. On the agricultural output side, lower energy prices will reduce the
amounts of agricultural feedstocks used for the production of biofuels. The typical feedstocks
of sugar cane and maize, are likely to see the most pronounced contractions in demand and
the most significant downward pressure on prices.

Trends and absolute levels of energy prices in 2020 are radically different from those in 2007-
2008. In 2007-2008, Western Texas Intermediate (WTI) crude oil prices experienced a massive
run-up, culminating by mid-2008 at levels close to USD 140/bbl, measured on a monthly
average basis (Figure 13). By April 2020, by contrast, crude oil (WTI) prices had fallen below
USD 20/bbl (Figure 13) on a monthly basis and even below USD 12 during intra-day lows. On
20 April 2020, quotations for nearby futures of WTI closed at levels of minus USD 35/bbl,
reflecting the need to rollover nearby futures to avoid delivery in May. The shifts in the
broader energy price index (Figure 20, Annex) do not yet fully mirror the precipitous fall in
crude oil prices.

In 2007-2008, the rise in energy prices was so significant that it turned agricultural products
into competitive feedstocks for the energy market, siphoning off an increasing quantity of
agricultural products from food markets into the biofuels market. The most direct effects were
visible in the demand for energy feedstocks, i.e. maize, sugar and vegetable oils; the more
indirect effects came through substitution on the demand side and competition for cropland
on the supply side, which eventually lifted prices for all agricultural products.

The exact opposite set of drivers was at work at the beginning of the COVID-19 crisis. The
sharp decline in energy prices (Figure 13), caused prices of ethanol and biodiesel to collapse
and resulted, without any time lag, in strong declines in the demand and prices for bioenergy
feedstocks such as maize, sugar and vegetable oils. These effects can create an automatic
stabiliser for international food security, they keep prices for basic foodstuffs under downward
pressure and help ensure access to food amid falling incomes.

 Page 19
You can also read