FMCG and Retail Sector in Africa - 2020 SECTOR REPORT - Istanbul Africa Trade ...
←
→
Page content transcription
If your browser does not render page correctly, please read the page content below
2020
FMCG and Retail
Sector in Africa
       SECTOR REPORT
       Corporate guide for the packaged food
       sector in African countries and possible
       synergies with Turkey

              1
2

    About Istanbul Africa Trade Company

    Istanbul Africa Trade Company aims to improve economic relations between Turkey and African
    countries. Through our international trade services, businesses reach better products and deliver
    services to large areas.

    In addition to international trade services, we proudly provide product investigation, trade strategy
    development, contract manufacturing services.

    Disclaimer
    Copyright © 2020 Istanbul Africa Trade Company

    This business report was developed to provide information about current economic outlook in Africa
    from our perspective. This guide does not constitute legal or regulatory advice, nor guidance or advice
    regarding the preparation of policies and procedures. The practices and standards described in this
    report may not be sufficient under applicable law or for another financial institution with which the
    user seeks to do business.

    All rights reserved. Istanbul Africa Trade Company accepts no liability whatsoever for the actions of
    third parties in the distribution of the report. The data, analysis and insights in this report were prepared
    by Istanbul Africa Trade Company. This report is not a business and trade advice. Istanbul Africa Trade
    Company is not liable to update the information or conclusions in this report. Istanbul Africa Trade
    Company does not accept any liability for any loss arising from information contained in this report.

                                                                                            www.istanbulafrica.com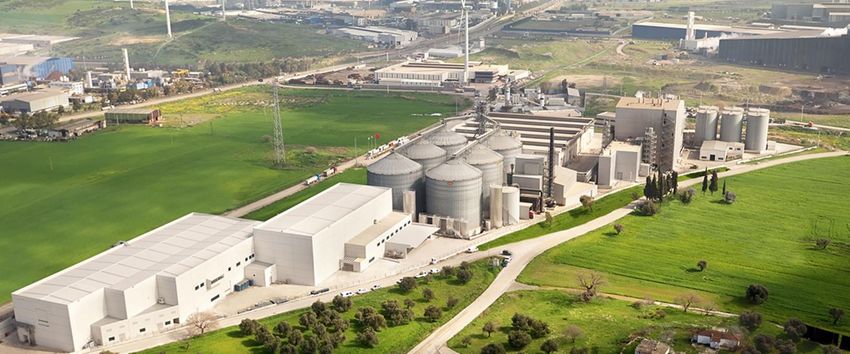
3

    Contents
     I)    Foreword: Booming Retail Sector in Africa ........................................................................................ 4
    II)    Macroeconomic Highlights ................................................................................................................ 5
    III)   Market Analysis................................................................................................................................. 7
                      South Africa .......................................................................................................................... 7
                      Nigeria.................................................................................................................................. 9
                      Kenya ................................................................................................................................. 11
                      Tanzania ............................................................................................................................. 13
                      Ghana ................................................................................................................................. 15
    IV)    Major Supermarket Chains in Africa ................................................................................................ 17
                      Shoprite.............................................................................................................................. 18
                      Massmart ........................................................................................................................... 19
                      Pick n Pay ........................................................................................................................... 20
                      Spar .................................................................................................................................... 21
                      Choppies ............................................................................................................................ 22
                      OK Zimbabwe ..................................................................................................................... 23
                      Uchumis ............................................................................................................................. 24
                      Naivas................................................................................................................................. 25
                      Melcom .............................................................................................................................. 26
                      Carrefour ............................................................................................................................ 27
    V)     Position of Turkey for FMCG Products ............................................................................................. 28
                      Aves ................................................................................................................................... 30
                      Namet ................................................................................................................................ 32
                      Kent (Mondelez) ................................................................................................................. 34
                      Mey İçki .............................................................................................................................. 36
                      Arbel Group ........................................................................................................................ 38
                      Banvit ................................................................................................................................. 40
                      Penguen Gida ..................................................................................................................... 42
                      Abalıoğlu Group.................................................................................................................. 44
                      Sütaş .................................................................................................................................. 46
                      Altınmarka .......................................................................................................................... 48
    VI)    Final Notes ...................................................................................................................................... 50

                                                                                                                                     www.istanbulafrica.com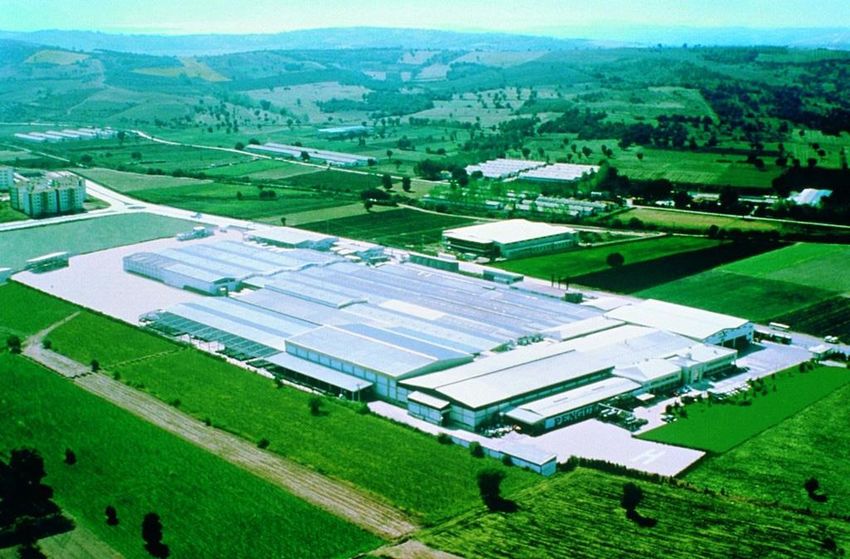
4

    Foreword: Booming Retail Sector in Africa
    The population growth and increase in the disposable income are the main drivers for the consumer
    goods market size. African countries are favorable for the packaged food and other FMCG products
    thanks to their demographic properties and macroeconomic growth numbers. Africa is the second
    most populated continent with approximately 1.3 billion people living in 54 independent countries.
    The population is expected to reach 1.6 billion by 2030. In addition, according to the World Bank
    Data, the cumulative average GDP per capita growth was 1.1% in the Sub-Saharan African countries
    in the last decade. The increase in GDP per capita on top of the population growth can be translated
    as a development in average household disposable income.

    The distribution and infrastructure network in Africa has been developing rapidly. The African
    governments are investing in international dryports, railroads and highways. The Port of Durban,
    located in South Africa, is the largest and busiest shipping terminal in Sub-Saharan Africa. It handles
    up to 31 million tons of cargo annually. It is the fourth largest container terminal in the Southern
    Hemisphere, handling 2.5 Million TEU. Tanzania is investing $10 Billion on a new port and special
    economic zone in the Bagamoyo region. Once completed, it is expected to be the largest port in
    Africa. In 2018, Turkish construction giant Yapi Merkezi and the Government of Tanzania signed a
    $1.9 billion contract to design and construct a high-speed railway in Tanzania.

    Finally, the supermarket chains are expanding into new territories and formalizing the retail sector.
    The South African supermarket chains are the leaders in internationalization in the African continent.
    For example, the Shoprite Group has 2,319 stores in total, primarily in South Africa with 1,957 stores.
    Namibia is the second largest market ahead with 94 stores, Angola and Zambia with 48 each. Shoprite
    Group has operations in Botswana, Mozambique, Lesotho and Nigeria. The expansion into Africa is
    followed by international supermarket chains such as SPAR and Carrefour.

    Turkish products can already be seen at major African supermarkets. African distributors and retailers
    source packaged food, candies, baby diapers, detergents and other consumer goods from Turkish
    companies, due to their high quality, reliability and reasonable price tag. We believe that Turkey is a
    very strong partner for African countries, and African businesspeople should consider Turkish
    companies as one of their sourcing alternatives.

    The 2020 edition of the Istanbul Africa Trade Company’s FMCG and Retail Sector Report provides a
    comprehensive analysis of the retail sector in Africa. Furthermore, the report provides insights into
    leading African supermarkets and Turkish packaged food manufacturers. The report was prepared by
    Istanbul Africa Trade Company management and regional partners. We hope that you will enjoy
    reading our report and find it useful for your business. Please do not hesitate to contact us for further
    information regarding trade inquiries between African countries and Turkey.

    Burak Unal                                                      Mete Unal
    Director of African Markets                                     Director of Supply Chain

                                                                                          www.istanbulafrica.com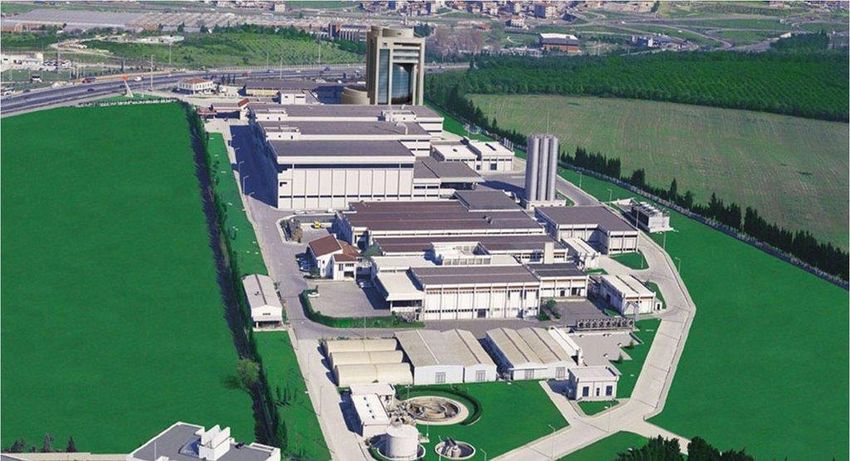
5

    Macroeconomic Highlights
    In 2019, the economic growth of Africa was 3.4%. The growth is expected to continue by 3.9% in 2020
    and 4.1% in 2021. Africa’s economy is growing with private consumption, investment and exports.
    Investment is accounting for the half of the continent’s growth. It is followed by private consumption
    and exports.

    Exhibit 1: GDP of the African Continent ($ Billion)

    The population of the continent is also increasing rapidly. Currently, the population of Africa is
    approximately 1.3 Billion people, and it is expected to reach 1.6 Billion people by 2030. The GDP
    growth and population growth will transform into a bigger market size and developing consumer
    demands.

    Exhibit 2: Population Estimation of Africa (Million)

                                                                                        www.istanbulafrica.com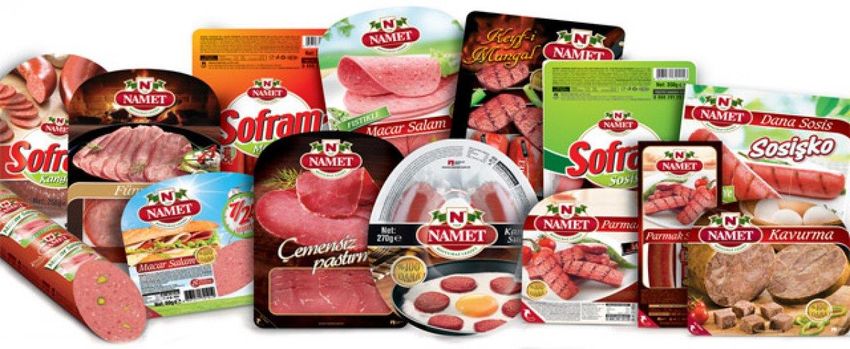
6

    Spending patterns are highly affected by income level of the country. World Bank classified countries
    under four income groups:

     Income Group         Income Bracket (GNI per Capita)                    Characteristics
                                                                 Fulfilling of basic needs, day-to-day
     Low income                  -              $1,025
                                                                                 survival.
     Lower middle                                               Usually living in urban areas, striving to
                             $1,025             $3,995
     income                                                                  be middle class.
     Upper middle                                             Brand consciousness is awakened. Quality
                             $3,996            $12,375
     income                                                        and convenience are important.
                                                               Very high purchasing power. Quality and
     High income             $12,376                 -
                                                                  luxury products are valued highly.

    Many African countries are in the low-income and lower-middle income groups. The size of the
    middle-income class is still very low in many countries. However, there is an upward shift in income
    level. As the proportion of middle-income households increase, the FMCG market will be more
    favorable for international companies. The consumers will demand branded, high-quality and well-
    packaged products. And their share-of-wallet will increase for high-quality products.

    Exhibit 3: GDP per Capita of African Countries

    In this report, five African countries are analyzed in-depth in the next section. From a general
    perspective, we can tell that African countries developed substantially in the last decade. We are
    optimistic about the future of African countries. We expect the following macroeconomic trends:

       •   Increased proportion of middle-income households.
       •   Higher consumer demand for branded products.
       •   More average household budget for packaged food and FMCG products.
       •   Formal distribution channels and supermarkets.

                                                                                        www.istanbulafrica.com
7

    Market Analysis
    South Africa
    South Africa is one of the most developed countries in the African continent. It is bordered by
    Namibia, Botswana, Zimbabwe, Mozambique, Swaziland and Lesotho. Its population is 57 million and
    has $350 billion GDP, second after Nigeria. South Africa is one of the founding members of the African
    Union.

    Packaged food reported strong retail sales growth in 2019. The products that are part of the daily
    diet of South Africans are the most selling items, such as dairy, rice and pasta. South African
    customers give importance on the price tag. The value for money is the key driver in the purchase
    behavior. The adverse economic conditions in South Africa affected the spending pattern of
    customers and many people cut their spending on non-essential products. The main patterns of these
    customers are bulk buying, preferring lower-priced products and choosing private label products.

    The busy lifestyle in South Africa pushes customers to buy meal solutions, such as snacks that are
    easy to prepare and healthy. Especially, the demand for ready meals is increasing as the number of
    single member households is going up. In addition, the health and wellness awareness of packaged
    food are being trendy. Many manufacturers are following this trend and they use signs like `sugar-
    free`, salt-free`, `natural` on their packaging. There are more margins on healthy products as the unit
    price is more expensive. However, targeting this segment limits the sale only to affluent customers.

    In South Africa, modern retailing is well developed and supermarkets are the leading distribution
    channels. The packaged food sector is expected to grow in the near future, with convenience and
    affordability being the main drivers for demand. However, the middle-income and high-income
    consumers are attracted to value-added products such as healthy and sugar-free food. They are ready
    to pay more for these products. The lower-income consumers are still very price sensitive and they
    continue to choose the cheapest product that offers adequate quality.

                                                                                         www.istanbulafrica.com
8

    Table 1: Sales of Packaged Food in South Africa: Volume (Thousand Tons)

     Products                                        2014       2015        2016    2017       2018       2019
     Edible Oils                                     634.7       635.3      647.1    660.0     656.6      664.9
     Ready Meals                                      31.8        32.8       32.8     33.5      34.6       34.3
     Sauces, Dressings and Condiments                126.3       133.2      139.3    142.4     149.5      152.3
     Soup                                             14.4        15.3       16.0     16.7      17.8       19.6
     Sweet Spreads                                    31.8        35.3       37.3     38.9      41.9       44.9
     Baby Food                                        43.7        45.0       46.2     46.0      46.5       46.6
     Dairy                                          2064.1      2191.7     2274.0   2364.3    2348.0     2394.1
     Confectionery                                   116.4       118.0      122.5    124.0     125.4      127.6
     Ice Cream and Frozen Desserts                    43.9        44.2       43.9     44.0      43.8       44.2
     Savoury Snacks                                  133.9       138.7      147.8    157.9     165.2      172.2
     Sweet Biscuits, Snack Bars and Fruit
                                                     70.4        76.8       86.1     91.2      95.1       101.9
     Snacks
     Baked Goods                                     717.5      734.0       760.2   777.5      797.0      821.3
     Breakfast Cereals                               120.1      127.1       132.3   136.9      144.5      151.9
     Processed Fruit and Vegetables                  193.5      196.8       202.2   207.4      211.6      214.1
     Processed Meat and Seafood                      142.8      145.5       147.2   149.7      130.1      131.6
     Rice, Pasta and Noodles                         374.7      388.5       406.3   428.8      454.4      469.6

    Table 2: Sales of Packaged Food in South Africa: Value (USD Million)

     Products                                        2014        2015       2016     2017       2018       2019
     Edible Oils                                    1049.0       932.4      866.8   1034.8     1128.5     1088.9
     Ready Meals                                     280.5       257.0      243.1    298.8      321.2      322.0
     Sauces, Dressings and Condiments                683.6       623.7      583.4    728.8      768.9      769.2
     Soup                                            127.2       120.3      117.7    139.2      153.4      147.8
     Sweet Spreads                                   160.0       155.8      153.8    188.5      214.4      225.1
     Baby Food                                       413.1       394.6      368.4    444.4      484.3      465.8
     Dairy                                          4401.3      4165.4     3939.6   4831.0     5240.3     5118.8
     Confectionery                                  1220.1      1128.9     1121.7   1368.4     1472.0     1482.8
     Ice Cream and Frozen Desserts                   206.5       187.1      181.0    217.3      235.4      226.8
     Savoury Snacks                                 1039.2       986.8      942.0   1165.7     1281.9     1274.5
     Sweet Biscuits, Snack Bars and Fruit
                                                     392.3       364.0      359.9    439.8      485.0      485.1
     Snacks
     Baked Goods                                     992.6       943.8      908.2   1093.9     1200.9     1215.0
     Breakfast Cereals                               512.6       473.4      455.4    551.8      590.7      595.5
     Processed Fruit and Vegetables                  652.3       584.0      544.3    640.9      677.5      649.7
     Processed Meat and Seafood                     1083.0       979.5      921.0   1084.7      992.7      962.5
     Rice, Pasta and Noodles                         580.4       553.6      525.1    635.1      708.6      697.8
    Packaged Food 149,783.9 163,964.8 180,716.5 197,132.5 210,301.4 226,384.8

                                                                                             www.istanbulafrica.com
9

    Nigeria
    The Federal Republic of Nigeria is located in West Africa. It is bordered by Cameroon, Niger, Chad
    and Benin. Nigeria is referred as the `Giant of Africa’, due to its strong economy and large population.
    Its population reached 191 million in 2018 and Nigeria has the highest GDP in Africa with $375 Billion.
    Nigeria overtook South Africa in 2014 to become Africa’s largest economy. Nigeria is a member of
    the African Union, United Nations, OPEC and Commonwealth.

    The customer spending power significantly decreased in Nigeria in the last 5 years due to worsening
    macroeconomic conditions. However, the packaged food sector has been performing well. There are
    two key drivers that support the growth of the packaged food sector. Firstly, the population of Nigeria
    is growing rapidly, especially the number of children and teenagers is increasing. Secondly, the
    consumer trend shifts from unpacked products to packaged products. Manufacturers produce in
    smaller packs in order to make their products more affordable. With urbanization and changing
    lifestyles, the market size of packaged food is growing faster.

    The deprecation of local currency made imports more costly. The foreign brands lost their appeal on
    customers’ eyes due to their higher price. However, the international players can still penetrate the
    market by lowering their price or making their products available in smaller packs. The retail market
    in Nigeria relies on non-formal trading, such as kiosks, open markets and small grocery stores. The
    formal and modern retailing increases its share in the total market thanks to new supermarkets,
    convenience stores and hypermarkets. Nigerian consumers started to change their shopping style by
    switching to modern retailers with the opening of new shopping malls.

    The Nigerian economy is expected to recover and the consumer buying power is expected to
    increase. This leads to an opportunity for higher-priced products in the market. In addition, the
    population of Nigeria is growing swiftly, and the young population will contribute to the size of the
    packaged food sector.

                                                                                          www.istanbulafrica.com
10

     Table 3: Sales of Packaged Food in Nigeria: Volume (Thousand Tons)

      Products                                  2014      2015         2016     2017       2018       2019
      Edible Oils                                57.4      59.7         42.1     46.7       51.9       56.9
      Ready Meals                                 -         -            -        -          -          -
      Sauces, Dressings and Condiments          329.2     330.2        242.4    241.8      256.2      283.7
      Soup                                       1.7       1.7          1.1      1.1        1.1        1.1
      Sweet Spreads                              2.5       2.5          1.6      1.6        1.7        1.8
      Baby Food                                  35.7      37.7         23.8     24.3       25.9       27.8
      Dairy                                     354.4     368.5        257.4    289.6      300.7      321.4
      Confectionery                              65.5      66.7         52.9     55.4       43.9       52.4
      Ice Cream and Frozen Desserts              16.9      17.1         13.0     13.4       11.7       12.8
      Savoury Snacks                             16.6      19.0         13.0     13.9       11.4       13.5
      Sweet Biscuits, Snack Bars and Fruit
                                                135.4     140.9        111.5    117.3      108.1      117.5
      Snacks
      Baked Goods                               598.3     609.5        417.5    443.8      466.4      482.6
      Breakfast Cereals                          42.6      43.2         31.6     34.1       35.1       37.8
      Processed Fruit and Vegetables             10.0      10.2         7.3      7.7        8.1        8.2
      Processed Meat and Seafood                 6.4       6.5          5.6      5.7        5.9        6.0
      Rice, Pasta and Noodles                   931.0     992.8        711.8    828.0      846.9      876.6

     Table 4: Sales of Packaged Food in Nigeria: Value (USD Million)

      Products                                  2014      2015         2016     2017        2018       2019
      Edible Oils                               242.8      221.7       154.3    153.5       145.1      160.5
      Ready Meals                                 -          -           -        -           -          -
      Sauces, Dressings and Condiments         1552.3     1449.1       986.2    988.7       955.8     1046.6
      Soup                                       14.5       13.1        8.2      7.7         6.7        7.0
      Sweet Spreads                              15.8       14.5        9.5      9.5         9.0        9.7
      Baby Food                                 622.6      582.1       383.0    375.2       364.0      394.5
      Dairy                                    1482.3     1353.6       954.3    990.1       939.2     1017.0
      Confectionery                             407.2      372.6       247.2    242.6       171.0      219.1
      Ice Cream and Frozen Desserts              65.0       60.3        41.3     39.4        29.7       35.4
      Savoury Snacks                            129.4      125.9        80.2     77.5        56.9       71.3
      Sweet Biscuits, Snack Bars and Fruit
                                                672.1     645.3        437.2    454.1       370.6      434.2
      Snacks
      Baked Goods                               903.3      844.7        558.5    549.5      503.5      546.7
      Breakfast Cereals                         323.1      299.4        206.8    196.1      183.8      194.6
      Processed Fruit and Vegetables             39.8       36.1         23.8     23.2       21.3       22.0
      Processed Meat and Seafood                 67.1       61.4         45.1     45.2       41.2       43.3
      Rice, Pasta and Noodles                  1763.8     1677.3       1267.2   1223.5     1131.3     1150.4

                                                                                         www.istanbulafrica.com
11
Kenya
Kenya is located in East Africa and it is bordered by Ethiopia, Somalia, South Sudan, Uganda and
Tanzania. Kenya’s population is 50 million and its GDP is $74 Billion. Kenya is a member of the United
Nations, World Bank, International Monetary Fund, COMESA, East African Community trade bloc and
other international organisations.
Kenya experienced a severe drought in the last years. Due to the drought, the income of households
that rely on agriculture decreased and the price of food raw materials increased. Kenyan food
manufacturers faced challenging time and they entered into a price competition to attract the
remaining consumers. Recently, many firms are investing in better quality and better packaging to
attract customers.
The growing middle class in Kenya prefers packaged food over unbranded and unpackaged products.
This led to a sizeable growth in the sector in spite of the drought, financial crisis and trade dispute
with Tanzania. The international players and local companies compete against each other. The local
companies have the market familiarity advantage and they know the consumer taste better.
However, international companies have the resources to promote their products and offer
reasonable price for price-sensitive consumers.
The modern retailers such as supermarkets and hypermarkets are becoming more popular and they
increase their share in total distribution. However, the groceries still dominate the retail market. We
expect the increase in modern retailing thanks to new shopping malls and foreign supermarket chains
entering the Kenyan market. We expect a better future for the agriculture production in Kenya, which
will contribute to the packaged food sector as lower raw materials cost.
www.istanbulafrica.com12
Table 5: Sales of Packaged Food in Kenya: Volume (Thousand Tons)
Products 2014 2015 2016 2017 2018 2019
Edible Oils 142.1 144.4 149.4 153.8 157.7 164.9
Ready Meals - - - - - -
Sauces, Dressings and Condiments 5.2 5.3 5.3 5.4 5.6 5.8
Soup 0.4 0.4 0.4 0.4 0.4 0.4
Sweet Spreads 1.1 1.2 1.2 1.3 1.4 1.4
Baby Food 2.1 2.2 2.3 2.5 2.6 3.0
Dairy 611.7 637.2 642.6 673.2 689.1 727.4
Confectionery 7.0 7.2 7.3 7.4 7.4 7.8
Ice Cream and Frozen Desserts 7.7 8.5 8.8 9.3 10.6 11.8
Savoury Snacks 4.7 5.1 5.3 5.7 6.0 6.5
Sweet Biscuits, Snack Bars and Fruit
13.2 13.9 14.1 14.7 15.9 16.4
Snacks
Baked Goods 157.1 171.1 185.3 206.9 223.7 245.5
Breakfast Cereals 3.8 4.0 4.2 4.4 4.6 4.9
Processed Fruit and Vegetables 6.5 7.2 7.6 8.3 9.2 10.1
Processed Meat and Seafood 9.9 10.3 10.5 10.9 10.9 11.7
Rice, Pasta and Noodles 95.5 101.3 106.0 111.5 116.8 121.5
Table 6: Sales of Packaged Food in Kenya: Value (USD Million)
Products 2014 2015 2016 2017 2018 2019
Edible Oils 469.2 451.4 470.0 487.4 546.9 584.9
Ready Meals - - - - - -
Sauces, Dressings and Condiments 46.0 43.1 44.0 45.5 50.0 54.1
Soup 3.5 3.1 2.9 2.9 3.0 3.9
Sweet Spreads 5.8 5.1 5.9 5.7 7.0 6.9
Baby Food 35.3 35.9 38.0 41.2 47.3 54.1
Dairy 2315.0 2228.3 2299.2 2453.8 2740.6 2989.9
Confectionery 84.4 80.1 81.7 86.6 93.4 100.0
Ice Cream and Frozen Desserts 51.3 52.7 59.0 64.5 77.5 88.4
Savoury Snacks 40.9 41.2 45.8 52.7 62.1 72.5
Sweet Biscuits, Snack Bars and Fruit
59.6 57.3 61.6 68.0 86.4 94.3
Snacks
Baked Goods 216.4 211.1 224.6 251.8 278.8 299.7
Breakfast Cereals 29.8 29.0 29.7 31.3 35.2 37.2
Processed Fruit and Vegetables 17.2 16.3 17.9 19.4 21.9 23.6
Processed Meat and Seafood 85.0 81.5 84.2 87.7 98.8 105.6
Rice, Pasta and Noodles 263.9 256.9 277.0 308.9 349.0 388.2
www.istanbulafrica.com13
Tanzania
The United Republic of Tanzania is located in East Africa and it is bordered by Uganda, Kenya,
Mozambique, Malawi, Zambia, Rwanda, Burundi and the Democratic Republic of Congo. Tanzania’s
population is 58 million and its GDP is $42 Billion.
Tanzania is a diverse country in terms of food and nutrition trends. The middle-income and high-
income households have a better diet and they tend to consume packaged food, such as snacks and
confectionery. However, low-income consumers usually have only one meal per day and they do not
have much disposable income to spend on non-essential packaged products. There is also a wide
difference between the urban population and the rural population. People living in rural areas tend
to grow their own vegetables and fruits. The consumers living in urban areas do not have that chance,
and they tend to buy their food from groceries and supermarkets.
In Tanzania, the low-income population mostly eat traditional food such as Ugali (maize). Their
decision depends on the price of the food. As the income level increases, the consumers tend to eat
rice, potato, pasta and western food. They are less price-conscious and they prefer tasting new
dishes. In addition, the population of Tanzania is younger than the world average with 44% of the
population being under 14-years-old. This demographic structure is expected to positively affect the
consumption of packaged food in the future.
Similar to other African countries, the formal and modern retailing is very limited in Tanzania. Only
affluent people shop packaged food in supermarkets. The remaining majority go to street retailers,
independent grocery stores and open markets. The infrastructural problems limit the modernization
of retailing. The distribution network is weak due to substandard road conditions and many shops in
the rural areas do not have fridges. Companies that consider Tanzania as an export market should
keep these challenges in their mind and take steps accordingly.
www.istanbulafrica.com14
Table 7: Sales of Packaged Food in Tanzania: Volume (Thousand Tons)
Products 2014 2015 2016 2017 2018 2019
Edible Oils 80.3 85.3 86.2 90.2 93.4 96.2
Ready Meals - - - - - -
Sauces, Dressings and Condiments 77.3 80.7 83.4 87.4 92.2 95.0
Soup 0.0 0.0 0.0 0.1 0.1 0.1
Sweet Spreads 1.2 1.3 1.4 1.5 1.6 1.7
Baby Food 1.9 2.0 2.1 2.2 2.3 2.4
Dairy 246.3 261.0 270.9 294.7 308.6 320.0
Confectionery 11.5 11.9 12.3 12.9 13.3 13.7
Ice Cream and Frozen Desserts 2.3 2.5 2.6 2.8 2.9 3.0
Savoury Snacks 5.7 6.2 6.5 6.8 7.2 7.5
Sweet Biscuits, Snack Bars and Fruit
13.2 14.0 14.8 16.1 16.9 17.9
Snacks
Baked Goods 231.9 241.8 251.2 264.8 276.0 290.8
Breakfast Cereals 3.6 3.9 4.0 4.2 4.3 4.5
Processed Fruit and Vegetables 1.2 1.2 1.3 1.3 1.3 1.4
Processed Meat and Seafood 2.7 2.9 3.1 3.2 3.3 3.4
Rice, Pasta and Noodles 99.1 106.7 114.1 123.5 132.2 138.8
Table 8: Sales of Packaged Food in Tanzania: Value (USD Million)
Products 2014 2015 2016 2017 2018 2019
Edible Oils 216.8 190.3 198.6 216.8 231.2 258.6
Ready Meals - - - - - -
Sauces, Dressings and Condiments 287.5 258.0 268.6 289.4 315.8 353.2
Soup 0.2 0.1 0.1 0.2 0.2 0.2
Sweet Spreads 6.7 6.0 6.3 7.0 7.6 8.3
Baby Food 51.0 45.1 47.8 51.9 56.7 61.0
Dairy 515.1 456.7 462.5 503.9 544.7 593.1
Confectionery 196.4 187.9 184.5 202.4 217.9 230.8
Ice Cream and Frozen Desserts 29.1 26.8 27.5 29.9 31.7 35.3
Savoury Snacks 58.7 55.8 57.7 63.4 70.2 75.1
Sweet Biscuits, Snack Bars and Fruit
118.7 109.6 111.8 122.0 132.2 144.9
Snacks
Baked Goods 133.7 125.2 135.8 155.4 172.3 193.0
Breakfast Cereals 28.9 25.4 25.3 26.6 28.5 30.6
Processed Fruit and Vegetables 6.4 5.6 5.5 5.7 5.8 6.1
Processed Meat and Seafood 28.7 25.4 26.3 28.2 30.0 33.2
Rice, Pasta and Noodles 249.8 221.5 224.2 242.2 263.2 290.5
www.istanbulafrica.com15
Ghana
The Republic of Ghana is located in the West Africa and it is bordered by Ivory Coast, Burkina Faso
and Togo. Ghana’s population is 29 million and its GDP is $47 Billion. Ghana is a member state of the
Non-Aligned Movement, the African Union, the Economic Community of West African States
(ECOWAS), Group of 24 and the Commonwealth of Nations.
In Ghana, there is a wide difference in alimentation trends between population in urban areas and
rural areas. People living in rural areas have access to locally grown fresh food, that is why, packaged
food is not common in Ghanaian rural areas. In urban areas, packaged food is more common due to
its convenience. Especially, people with higher spending capacity purchase packaged food such as
yoghurt, biscuits and confectionery from grocery stores. There is a trend of eating healthy, which is
also promoted by the government. This increases the demand for smaller portions and less oily food.
The players in the packaged food industry are diversifying their product ranges and developing
smaller packaging sizes to attract new customers. The people in the lower income levels demand
products in smaller packs. Accra has a more sophisticated consumer base. Western-style
confectionery and fast food is getting more popular among consumers. The busy lifestyle in Accra
increases the demand for convenience food and ready-to-preapre food. However, the market size of
packaged food is not expected to increase significantly in the rural areas of Ghana.
The young population of Ghana is promising for the future of the FMCG industry. This demographic
fact positively affects the consumption of baby food, sweet biscuits and other snacks. In addition,
low-income and middle-income people in Ghana shop from informal retail channels, such as open
markets in the residential areas. Finally, the distribution network in Ghana is strong in the urban
areas. New shopping centers with supermarkets and hypermarkets develop the formal retailing
environment.
www.istanbulafrica.com16
Table 9: Sales of Packaged Food in Ghana: Volume (Thousand Tons)
Products 2014 2015 2016 2017 2018 2019
Edible Oils 52.3 55.1 56.2 59.4 61.8 65.6
Ready Meals - - - - - -
Sauces, Dressings and Condiments 18.2 18.8 19.4 20.5 21.6 21.9
Soup - - - - - -
Sweet Spreads 1.1 1.2 1.2 1.2 1.3 1.3
Baby Food 3.7 3.9 4.1 4.4 4.6 4.8
Dairy 292.0 306.8 316.0 321.9 341.5 348.3
Confectionery 4.2 4.4 4.5 4.6 5.0 5.5
Ice Cream and Frozen Desserts 37.2 39.6 43.0 48.2 51.6 55.0
Savoury Snacks 5.2 5.5 5.8 6.1 6.6 7.2
Sweet Biscuits, Snack Bars and Fruit
13.5 14.7 17.9 18.7 19.7 20.9
Snacks
Baked Goods 168.4 175.7 178.2 184.2 193.4 199.9
Breakfast Cereals 5.8 6.7 7.2 7.9 8.7 9.4
Processed Fruit and Vegetables 0.8 0.8 0.8 0.8 0.9 0.9
Processed Meat and Seafood 5.2 5.7 6.2 6.4 6.9 7.2
Rice, Pasta and Noodles 132.9 142.2 150.7 160.2 172.9 183.2
Table 10: Sales of Packaged Food in Ghana: Value (USD Million)
Products 2014 2015 2016 2017 2018 2019
Edible Oils 152.9 133.3 156.9 164.3 174.8 177.3
Ready Meals - - - - - -
Sauces, Dressings and Condiments 84.2 75.2 87.3 87.8 91.6 92.4
Soup - - - - - -
Sweet Spreads 7.7 6.9 8.2 8.7 9.5 10.0
Baby Food 35.7 31.3 37.2 37.7 39.9 40.0
Dairy 1188.9 1045.4 1200.3 1227.7 1266.6 1293.0
Confectionery 63.6 57.6 63.9 66.1 73.2 76.1
Ice Cream and Frozen Desserts 92.5 80.7 98.4 107.7 119.7 125.8
Savoury Snacks 43.8 39.4 46.1 48.9 53.7 54.8
Sweet Biscuits, Snack Bars and Fruit
103.3 95.3 126.5 135.0 141.9 140.0
Snacks
Baked Goods 415.9 364.5 434.7 457.6 500.5 528.4
Breakfast Cereals 36.4 31.6 36.6 37.4 39.3 39.4
Processed Fruit and Vegetables 2.9 2.6 3.1 3.3 3.5 3.6
Processed Meat and Seafood 31.7 28.4 34.4 37.2 40.4 42.1
Rice, Pasta and Noodles 330.5 297.5 350.4 365.6 385.8 394.2
www.istanbulafrica.com17
Major Supermarket Chains in Africa
The retail sector in Africa has been formalized by the expansion of supermarket chains. With a more
sophisticated distribution network and an increasing number of middle-income households, the
supermarkets expanded into new countries and territories. South African supermarkets are leading
this expansion process, however there are also other local and international players that take
advantage of the growing market in African countries.
The international supermarket chains will benefit from the integrated African market. African
countries are taking serious steps in promoting trade and developing welfare. In March 2018, 44 out
of 54 African countries signed the African Continental Free Trade Agreement (AfCFTA) in Kigali,
Rwanda. The agreement outlines the removal of tariffs on 90% of goods, allowing free access to
commodities, goods and services across African countries. If the African Continental Free Trade
Agreement enters into force, the Intra-Africa trade can converge to the level of Intra-Asia or Intra-
Europe trade. We believe that the supermarket chains will have lower customs and logistics costs
and this will increase their expansion process.
Retail sales in Africa reached to over $500 billion in 2018. Africa is made up of a combination of
traditional and modern retailing channels. The sales channels vary by country and are influenced by
factors such as economy, development state, consumer preferences and culture. Traditional and
informal retailing dominates the continent due to a lack of infrastructural development. Small
groceries and kiosks are the main players in the traditional retailing channel. These groceries offer
flexible trading times, accessibility and lower-priced products. In these groceries, customers can buy
smaller quantities and single items, compared to complete packs at supermarkets, such as single
cigarettes, sugar cubes, unpacked rice, etc.
Informal retailing is still a dominant retail sales channel in many African countries. This form of
retailing includes open-air markets, street vendors and tabletop merchants. Almost all the products
that are sold in supermarkets are also available in informal retail stores. As opposed to the general
perception, all levels of society shop through the informal retailing channel.
Africa’s rising middle class is contributing to the modernisation of retailing. New shopping malls are
being constructed across Africa. With the rise of disposable income, consumers show brand
consciousness and demand for higher quality.
In the next section, we analyzed 10 supermarket chains in Africa. You can find their brief summary,
number of stores, regional presence and financial data.
www.istanbulafrica.com18
Shoprite
Shoprite Group opened its very first store in 1979 and grew with new
acquisitions and innovative expansion strategies building it into the
leading food retailer in Africa. The Shoprite Group has business
operations in 15 countries on the African continent. The Group has an
influential presence in the South African food retailer market with a
30.6% market share. The group, which employs 147,268 people in 15
countries, is a huge job provider in the African continent. The Group
provides its food retail service in 4 different groups.
Firstly, Shoprite Store is the flagship brand, providing goods and services to the mass middle-income
market. Secondly, Usave shops are small-format stores that offer a limited range of basic food for
lower-income customers. Checkers is the brand for affluent customers, which prioritises
convenience, quality and freshness. Lastly, CheckersHyper is the larger version with wider-range
stores with similar products to Checkers.
In 2019, the Shoprite Group achieved around $8 billion in sales revenue. 74.8% of the sales acquired
from the South Africa division, other areas contributed 14.2%, the rest of the revenue received from
non-supermarket sales, such as furniture and other operations. The Group expanded its operations
and opened 126 net new stores and acquired 36 new trucks in 2019.
As of 2019, the Shoprite Group has 2,319 stores in total, primarily in South Africa with 1,957 stores.
Namibia is the second largest market ahead with 94 stores, Angola and Zambia with 48 each. Shoprite
Group has operations in Botswana, Mozambique, Lesotho and Nigeria.
www.istanbulafrica.com19
Massmart
Massmart was founded, with Mikro as the founding
entity, with 6 stores in 1990. Massmart, Africa’s
second largest retail group, was listed on the
Johannesburg Stock Exchange (JSE) on 4 July 2000.
The Group is currently a top 40 listed company (by turnover) and is a participant in the JSE Limited’s
Socially Responsible Investment Index. Currently, 52% of Massmart’s shares are owned by Walmart
(USA).
As of January 2019, Massmart has 436 stores across 13 sub-Saharan countries. Massmart employs
approximately 51,000 permanent and flexi-time staff and achieved annual sales of $5.3 billion for the
year ending December 2019. Massmart has four divisions each comprising widely recognized,
differentiated retail and wholesale formats. Game and Dionwired stores are the general merchandise
and food discounters. These mass discounters have a presence in 12 countries with more than 150
stores. Makro is the warehouse division of Massmart Group with 21 stores, which operate only in
South Africa. Builders brand is the building material supplier of Massmart, they are located in South
Africa, Botswana, Mozambique and Zambia. Jumb, Cash & Carry and Cambridge are the food
wholesaler and retailer division in 7 different countries.
Massmart is the second-largest distributor of consumer goods in Africa, and is the leading retailer of
general merchandise, liquor, home improvement and building supplies, and the leading food
wholesaler. Massmart’s main operation location is South Africa, where the company has 389 stores
and generated 91.3% of the total sales in 2017. Outside of South Africa, Massmart has 47 stores.
www.istanbulafrica.com20
Pick n Pay
In 1967, the first four Pick n Pay stores were purchased by
Raymond Ackerman in Cape Town, South Africa. The
Group has grown to encompass stores across South Africa,
Namibia, Botswana, Zambia, Eswatini and Lesotho with
1,795 stores. Also, Pick n Pay owns a 49% share of Zimbabwean supermarket chain, TM
Supermarkets. The company operates through multiple store formats under three brands – Pick n
Pay, Boxer and TM Supermarkets – and has the largest online grocery business in Africa. Out of 1,795
Pick n Pay stores in Africa, 1,019 of them are company-owned, 719 of them are franchise stores and
57 of them are TM Supermarkets.
The company offers different store formats in different countries. Exclusively in South Africa, 20 Pick
n Pay Hypermarkets provide a wide range of products to customers via an average 15,000 m2 store
area. 552 Pick n Pay Supermarkets are the most common type of Pick n Pay stores in 7 African
countries, they are around 3,000 m2 and more than half of them are franchise. In South Africa, BP
and Pick n Pay have a partnership. The company provides small 24-hour Pick n Pay Express
convenience stores at BP service station forecourts in South Africa. Pick N Pay Liquor stores are
situated close to their supermarkets and hypermarkets but with separate entrances. These stores
offer a range of wine, spirits and beer, including innovative local craft products. Lastly, Boxer stores
provide a “one-stop shop” for middle- to lower-income shoppers in South Africa and Eswatini and
are becoming South Africa’s leading limited-range discount supermarket.
Pick n Pay mainly operates in South Africa with 1,647 stores, but it has 148 stores outside South
Africa, with established operations in Botswana, Eswatini, Lesotho, Namibia, Zambia and Zimbabwe.
These operations generated segmental revenue of around $256 million in 2019.
www.istanbulafrica.com21
Spar
SPAR, originally DESPAR, is a Dutch multinational franchise that operates
food retail stores. SPAR started with one Dutch store in 1932 and now
comprises more than 13,100 stores in over 45 countries on four
continents. SPAR has an established presence in 11 countries in Africa
with over 1,000 stores. SPAR commenced its activities in the African
continent initially in South Africa in 1963.
South Africa is a critical hub for SPAR, the company is a dominant player
in the South African market with 887 stores and generated almost €5 billion revenue in 2018, second
highest turnover after SPAR Austria with €6.88 billion. In addition to South Africa, SPAR has a long-
lasting relationship with Zimbabwe since 1969. SPAR Zimbabwe continued to open new company-
owned stores in 2018; 14 stores of the 36 are company-owned, retail sales for the year were €154
million, an increase of 39.1%.
In the early 2000s, SPAR invested and started operating in various other African countries such as;
Botswana, Namibia, Zambia and Mauritius with 33, 29, 13 and 5 stores, respectively. Botswana is the
second highest revenue generator location in Africa with €184 million ahead, Namibia with €159
million and Zimbabwe with €154 million.
Trading conditions and political instability created challenges in Africa but many SPAR stores are
performing exceptionally well. In 2018, Botswana grew by 19.2%, Zimbabwe by 39.1%, Mozambique
by 56.2% and Cameroon by 65.6%. In Nigeria, SPAR grew sales to €110 million, an increase of 8%.
www.istanbulafrica.com22
Choppies
Choppies Enterprises Limited is a Botswana multinational grocery and
general merchandise retailer headquartered in Gaborone, Botswana.
Initially they were selling only food-based (both fresh groceries and
wholesale long-life foods) and other fast-moving consumer goods. The
group owns a centralised, in-house distribution network in South Africa,
Zimbabwe, Zambia and Kenya.
Choppies is a listed company on the Botswana Stock Exchange and Johannesburg Stock Exchange.
First Choppies store was opened in 1986 named “Wayside Supermarket”, the second one followed
in 1993. In 2008, Choppies expanded outside of Botswana and opened its first store in South Africa.
Later in 2013, the company acquired some of the SPAR stores in Zimbabwe. The belief in the potential
of the African market encouraged Choppies to expand into Zambia and Kenya in 2016 and into
Tanzania and Mozambique in 2017.
Choppies stores are filled by their distribution centers with central sourcing. The company's top-
selling products are directly distributed from distribution centers to the stores. Other products are
delivered from the manufacturer to the stores. Choppies owns two distribution centers in Botswana.
A new 10,000m2 South African distribution center opened in September 2012 for the South African
stores. In total, The group is present in 8 Sub-Saharan countries, with over 250 supermarkets and
operates 11 distribution centers and employs more than 17,000 people.
www.istanbulafrica.com23
OK Zimbabwe
OK Zimbabwe Limited is a leading retail group in Zimbabwe
with a product range that extends from groceries and
houseware products to clothing and textiles. OK Zimbabwe
Limited was first established in 1942. Through the time, the
company used various names and historically, the company was incorporated as Springmaster
Corporation in 1953, and in 1984 changed its name to Deltrade Limited which was then again
changed to the current name in July 2001. OK Zimbabwe, which trades under the popular brand
names OK Stores, Bon Marche Stores, and OKmart, operates in three major market categories,
namely, groceries, basic clothing and textiles, and houseware products.
Via a diversified distribution channel, the company is able to target all segments of the market,
responding to its customers’ requisite for convenience and value. Despite operating in a highly
competitive retail sector, OK Zimbabwe has maintained its dominant position, developing its own
brands through the Bon Marche Premier Choice and Shopperschoice labels.
OK Zimbabwe Limited operates approximately 61 retail outlets throughout Zimbabwe and owns
subsidiaries that complement its diverse product offering; Eriswell (Private) Limited, Swan
Technologies (Private) Limited and Winterwest (Private) Limited. Since 2001, the company is listed
on the Zimbabwe Stock Exchange.
www.istanbulafrica.com24
Uchumis
Uchumi Supermarkets Plc is a Kenya-based company engaged in
the retail supermarket operations. It distributes bakery, wines,
meat, fish, vegetables, as well as kitchen appliances and
decoration, among others. First Uchumi Store opened in 1975 to
create outlets for the equitable distribution of commodities and
to create retail outlets for Kenyan manufactures. Uchumi
Supermarket grew to become a retail success story in Africa. In the 90s, Uchumi spearheaded the
hypermarket concept in Kenya. It was the first in the region to list on the stock exchange in 1992.
Uchumi had hard times in the early 2000s. Uchumi started to experience financial and operational
difficulties occasioned by a sub-optimal expansion strategy coupled with weak internal control
systems. As a result, on 31st May 2006, the Board of Directors resolved that the Company ceases
operations and on 2nd June 2006, the Debenture Holders placed the Company under receivership.
Simultaneously, the Capital Markets Authority (CMA) suspended the Company’s listing on the Nairobi
Securities Exchange (NSE). Following a framework agreement between the Government of Kenya,
suppliers and debenture holders, the company is revived and commenced operations from 15th July,
2006 under Specialized Receiver Manager (SRM) and interim management.
From a negative bottom line in 2006, the company has reported profits in the last three financial
years. The lending banks in turn lifted the company’s receivership in 2010 and the company was
successfully re-listed in the Nairobi Securities Exchange on 31st May 2011 – exactly five years to the
date that it was suspended. The company is indebted in gratitude to the government, lending banks,
suppliers, customers and shareholders for their support and commitment to saving one of Kenya’s
oldest strongest brands with around 20 stores in major Kenyan cities.
www.istanbulafrica.com25
Naivas
Naivas Supermarket is the largest supermarket chain in Kenya,
with 62 outlets as of March 2020. Naivas is headquartered in
Nairobi, with retail outlets in many urban centers in the country.
The chain is the country's largest supermarket chain followed by
its competitor Tuskys.
Naivas Limited started as a family business serving the village of Rongai in the outskirts of Nakuru
town in 1992. Later, the company grew into a major wholesale and distribution business and was
registered as a company in 1993. The business expanded into Nairobi in 2001, where it opened its
first branch on Ronald Ngala Street, closing down its outlets in Rongai and Elburgon.
2013 was a milestone for Naivas, the Johannesburg Stock Exchange-listed Massmart offered to
acquire a 51% stake in Naivas at a cost of KSh3 billion, giving Massmart a controlling interest in the
retail chain. The bid triggered a feud at family owned Naivas, and some family members asked a court
to block the sale. In October 2013, Naivas management stated that they were no longer selling a
controlling stake to Massmart.
Naivas now operates with 62 stores as a traditional retailer, but also the company is the largest online
supermarket in Kenya. It provides shoppers a convenient platform for online grocery shopping with
over 60,000 items on the online supermarket. After the collapse of Nakumatt, a local supermarket
chain that had dominated the sector in Kenya, Naivas strengthened its presence in Kenya. In early
2020, a French investment fund acquired 30% of Naivas’s stake.
www.istanbulafrica.com26
Melcom
The Melcom Group of Companies consists of six separate entities:
Melcom Limited, Century Industries Limited, Crownstar Electronic
Industries Limited, Melcom Hospitality, Melcom Travel & Tours
Limited, and Melcom Care. Apart from capturing an extensive
retail market share with a network of 41 Melcom retail outlets and
3 Cash 'n Carry stores spread all over Ghana (Melcom Limited), the Group is well-diversified into other
businesses.
Melcom Group is best known for its retail chain, Melcom Limited. As Ghana’s largest chain of retail
department stores, Melcom is home to thousands of products and hundreds of well-known brands
all under one roof.
Melcom Limited started its business in 1989 and grew the number of its stores to 44. The group built
the single largest shop in Ghana (Melcom Plus in Kaneshie covering an area of over 130,000 square
feet). Melcom Limited offers 25,000 items procured locally as well as from around the globe. Melcom
Limited has 1,200 employees at and generates $169.70 million in sales.
www.istanbulafrica.com27
Carrefour
Carrefour S.A. is a French multinational corporation specialized in
retailing. The first Carrefour store in 1960, within suburban Annecy in
France. The Carrefour Group was the first in Europe to open a
hypermarket, a large supermarket, and a department store under the
same roof. They opened their first hypermarket on 15 June 1963 in
Sainte-Genevieve-des-Bois near Paris. The year 1999 was a milestone
for the Carrefour Group, which merged with Promedes, known as
Continent, one of its major competitors in the French market.
Internationalization started with Belgium in 1973 and then followed by Italy and Spain. The French
regulatory context and slowdown in economic growth favored the acceleration of Carrefour’s
international development, the company expanded into overseas locations such as Argentina in 1982
and Taiwan in 1989. Then in 1995, Carrefour entered the Chinese market.
At the beginning of the 2000s, the Group bolstered its positions in numerous countries through
targeted acquisitions: in France, Romania (Hyparlo, Artima, Penny Market), Belgium (GB), Poland
(Ahold), Italy (GS), Argentina (North) and Spain (Plus).
The Carrefour Group has over 100 stores in Africa, especially in North Africa such as in Egypt, Morocco
and Tunisia. In October 2016, Carrefour opened its first outlet in Kenya, East Africa’s largest economy.
Cameroon, Ivory Coast and Senegal are the other locations, where Carrefour has a presence in Sub-
Saharan Africa.
www.istanbulafrica.com28
Position of Turkey in the Global FMCG Sector
According to current GDP figures, Turkey ranks as the 18th largest economy in the World and 7th in
Europe. The economic size of Turkey is larger than the combination of Nigeria and South Africa. The
economic size of Turkey is $754.8 billion and it has a population of 82.6 million people. Turkey is an
export-oriented economy with an estimated $171.5 billion exports in 2019. The leading export
markets of Turkey are Germany, UK, Italy, Russia and the United States.
Istanbul is the economic heart of Turkey with 15 million population and a vibrant business life.
Ambarli Port in Istanbul is among the 50 largest container ports of the world. Istanbul and
neighboring cities (Kocaeli, Tekirdag and Sakarya) are the main body of the Turkish industry. 38 of
271 organized industrial zones in Turkey are located in these cities.
Mersin province also has a major international shipping port and many factories around this port.
The Port of Mersin is the base for the city's economy. The Mersin Industrial Free Zone is adjacent to
the port. The artificial harbor at the Port of Mersin exports minerals and agricultural products from
southeast Turkey. The city is the location for one of the biggest oil refineries in Turkey.
Turkish companies are specialized in the production of packaged food, household chemicals, diapers,
cosmetics and other FMCG products. These companies cater to the domestic demand and also export
their products to more than 100 countries. Global and local companies are present in Turkey with
their on-site manufacturing plants. P&G, Unilever, Nestle, Reckitt Benckiser and Mondelez are major
global corporations and all of them has a production facility in Turkey. Major Turkish companies in
the FMCG sector are Eti Gida, Hayat Kimya, Halk Hijyenik and Tat Gida. These companies are active
in Turkey and in the international arena, including Africa.
Turkey has been historically targeting the European Union countries as their export partners. In the
meantime, Turkish factories meet the demand from Russia, Middle East and North Africa. In 2005,
Turkish Government began to improve the relationship with African countries. Turkish Government
has had a significant initiative to build Turkish presence in major African countries. The number of
Turkish embassies in Africa has more than tripled, from 12 to 41, in the last 15 years. There have
been joint business forums and conferences, where companies from different countries found the
opportunity to take the first commercial steps. Turkish businessmen have been acquainted with the
Africa region and trade volume has significantly increased in the last decade.
Our research includes a list of top 40 Turkish food and beverage manufacturers. In addition, we
conducted an in-depth analysis of 10 major companies in the FMCG sector.
www.istanbulafrica.com29
Table 11: List of Top 40 Turkish Food and Bewerage Manufacturers
Company Name Sector 2018 Revenue (USD)
Eti Gida Biscuits/Confectionery/Chocolate $ 810,888,316
Konya Seker Fabrikasi Biscuits/Confectionery/Chocolate $ 714,032,100
Coca-Cola Icecek Non-Alcoholic Beverages $ 650,337,523
Sutas Milk & Dairy Products $ 566,370,895
Banvit Poultry/Chicken Products/Feed $ 558,366,343
Namet Gida Processed Meat $ 454,910,549
Senpilic Poultry/Chicken Products/Feed $ 414,090,097
Bunge Gida Cooking Oil $ 388,209,476
Abalioglu Yem-Soya Feed $ 386,670,965
C.P Standart Gida Poultry/Chicken Products/Feed $ 381,305,111
Erpilic Tavukculuk Poultry/Chicken Products/Feed $ 328,912,297
Altinmarka Gida Chocolate/Cocoa Production $ 318,396,472
Pinar Sut Milk & Dairy Products $ 311,349,158
Panagro Tarim Dairy and Meat Products $ 285,496,399
Solen Cikolata Chocolate $ 265,391,836
Anadolu Efes Brewery $ 255,134,544
Progida Tarim Nuts/Sesame/Cotton/Cacao $ 230,288,945
Cargill Tarim Feed/Agro Products $ 229,286,139
Tat Gida Dairy/Tomato Paste/ Canned Vegetables $ 226,097,811
Dogus Cay ve Gida Tea/Sugar/Potato Chips/Tomato Paste $ 213,952,604
Bifa Buskuvi ve Gida Biscuits/Cakes/Chocolate $ 211,203,022
Turk Tuborg Brewery $ 199,317,414
Aynes Gida Dairy Products $ 187,549,119
Cekok Gida Fruit & Vegetables $ 183,517,143
Yayla Agro Gida Boiled Beans/Rice $ 183,048,039
Elvan Gida Biscuits/Confectionery/Chocolate $ 179,242,842
Tadim Gida Sunflower Seeds/Nuts/Snack Bars $ 168,756,361
Aves Energi ve Yag Cooking Oil $ 166,702,003
Hastavuk Gida Poultry $ 165,510,153
Savola Gida Cooking Oil $ 165,126,610
Balsu Gida Hazelnut $ 158,415,901
Goknur Gida Fruit & Vegetable Concentrate $ 158,340,202
Kent Gida Confectionery/Chocolate $ 156,760,900
Yonca Gida Cooking Oil/Tomato Paste/Pickle $ 139,543,401
Peyman Sunflower Seeds/Nuts/Snack Bars $ 114,149,028
Mey Icki Alcoholic Spirits $ 102,499,604
Arbel Bakliyat Pasta/Lentils/Chickpeas/ Wheat/Beans $ 93,238,208
Ulusoy Un Flour Milling $ 73,551,566
Tukas Tomato Paste/Pickles/Jams/Olives $ 69,878,838
Penguen Gida Boiled Beans/Chickpeas/Sweetcorn $ 38,242,413
www.istanbulafrica.com30
Aves
Aves, with close to 25 years of experience in international commodity
trade, is a major player in sunflower oil production and supply in Turkey.
The company operates in the production and international trade of
vegetable oils and biodiesel; vegetable oil storage, real estate sector,
offshore ship loading and unloading platform.
Aves owns the largest fully integrated oilseed processing and biodiesel plant in Turkey. It produces
through direct extraction and pressed extraction. The facility was built on 120 acres of land in Mersin,
one of the biggest port cities in Turkey. It produces 1 million tons of vegetable oil, pulp and biodiesel
per year with 1,500 tons of crushing, 700 tons of refinery and 1,100 tons of filling capacity. The facility,
can operate 2 different seeds at the same time. There are 62,400 tons of seed storage silos and
different seeds can be stored in 12 different silos at the same time. It has a horizontal warehouse
with a storage capacity of 25,000 tons of soybean meal. For other oilseed meals, there are three
3,000 tons horizontal pulp tanks. The Facility has 84,000 cubic meters silo and 28,000 cubic meters
tanks storage capacity and has a shelf storage system built on 3,000 square meters.
In refinery and filling facilities, Aves produces a wide range of products ranging from 1 litre to 18 litre.
The company produces sunflower oil under the Safya brand, corn oil under the Sari Dari brand and
cotton oil under the Mersina brand.
According to 2018 data, Aves has purchased 460 thousand tons of oilseed cereals and it is
strengthening its position in the sector by sales revenue over 131 million dollars. Aves ranked 254th
in the Istanbul Chamber of Industry Top500 list.
Increasing its international market share with SAFYA branded sunflower oil, AVES realized an export
figure of over 65 million USD last year. It mainly exports to the Middle East, Asia Pacific and Africa
regions and exports to over 60 countries in total. According to Turkey Exporters Assembly data, it is
the 18th largest exporter in its sector.
The company has a significant logistics advantage to its competitors, thanks to Aves’ vegetable oil
storage facility with 220,000 cubic meter capacity in Mersin and Aves’ offshore ship
loading/unloading the port.
www.istanbulafrica.com31
Image 1: Factory of Aves in Mersin, Turkey
Image 2: Products of Aves
www.istanbulafrica.com32
Namet
Namet is a leading meat producer in Turkey, with more than 150 various
products from processed meat to fresh meat. The company has been
operating since 1929. As the fastest growing company among the biggest
500 firms of Turkey, in 2014 Namet acquired Maret, another leading meat
producer. Together under the same roof, Namet became the leading
meat producer of Turkey.
Offering product groups like pastrami, sausage roasting, salami, smoked wiener, roast beef, Namet
takes a role as the pioneer in the whole sector. Namet keeps developing new products for the market.
Operational since 2013, Şanlıurfa Integrated Fattening and Meat Plant is located on open land of the
740,000 square meters. Holding capacity of breeding farm is 40,000, while the annual breeding
capacity is 60,000 cattles. An isolation business for 4,200 heads is available within the plant. The
processing section of the plant has the capacity of butchering daily 2,500 ovines and 350 cattles.
Being one of the special breeding farms in Turkey, this plant gives the taste of Namet products.
Being equipped with state-of-art-technologies, Namet Çayırova Plant started production in 2010. This
giant plant is located on a closed area of 34,600 square meters and produces delicatessen, fresh
meat, further processed product, frozen meatball and burger. Being indicated as the technological
base of taste world, this plant is fit for European and World standards in all terms.
With around 120 vehicles, Namet fleet has the capacity of carrying 1,200 tons of products at one
time. In addition, technological infrastructure and cold air stores in regional directorates are
reflections of Namet's perfect quality mentality. Namet accesses to collective consumption and retail
channels via Marmara, Mediterranean, Aegean, Anatolia, and East Black Sea Regional Directorates.
Namet exports its products to various countries in Asia & Middle East.
Namet Çayırova Factory has quality and food safety system certificates including ISO 9001, IFS, BRC,
FSSC 22000 and TSE certificates of product and service compliance. These standards are applied
during the production processes of the plant. Namet has also Halal Food Certificate certified by
Turkish Standards Institution. Namet always makes all processes of product preparation, all products,
and raw materials control firmly. With the help of a retrospective tracking system, auxiliary material
and main raw material are monitored automatically and spontaneously via computer systems from
the entrance to exit. The products are controlled with micro-biological and chemical analyses carried
out in laboratories independent from production sites. Namet always improves its labor force quality
with regular personnel trainings .
www.istanbulafrica.comYou can also read