RURAL & AGRIBUSINESS 2018 - Research and Forecast Report - Colliers International
←
→
Page content transcription
If your browser does not render page correctly, please read the page content below
Research and
Forecast Report

                  Accelerating success.

   RURAL &
   AGRIBUSINESS
   2018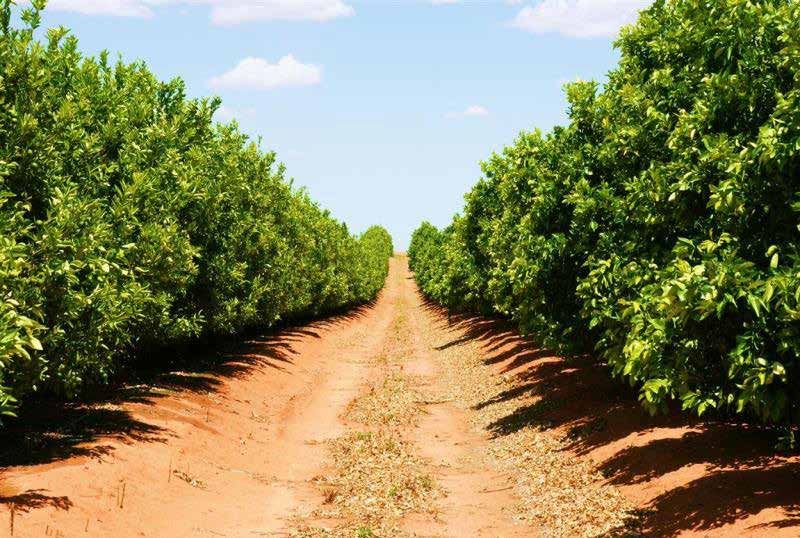
EXPERTS
IN PROPERTY DATA & INSIGHTS
Colliers Edge is a subscription service developed by our in-house
property research specialists, drawing on the expertise of our
national network of operators.

  DEEPER INSIGHTS               LIMITLESS SUPPORT          FAIRER PRICING
   Largest data set             Analysts not operators   Tailored to your needs
   on market today

Want better insights, faster? Talk to a Colliers Edge expert today
         Anneke Thompson
         National Director | Research
         +61 412 581 647
         anneke.thompson@colliers.com
         colliers.com.au/colliersedge

                                                               Accelerating success.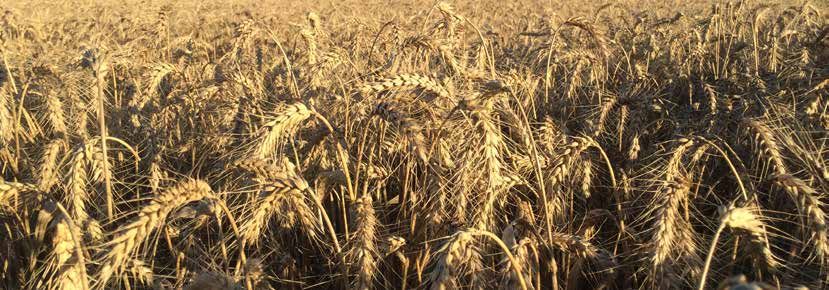
CONTENTS
Rural & Agribusiness market snapshots

Overview and Outlook                                                                4

Beef                                                                                8

Wine                                                                               10

Grains and Pulses                                                                  12

Sheep and Wool                                                                     14

Horticulture - Citrus                                                              16

Poultry                                                                            18

New Zealand                                                                        20

Passive Assets                                                                     22

Our experience – Rural & Agribusiness                                              24

                        Rural & Agribusiness | Research & Forecast Report | 2018    3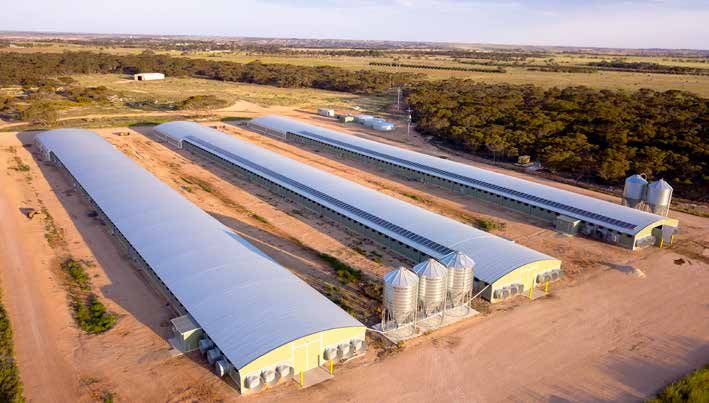
OVERVIEW
AND OUTLOOK
By Helen Swanson                    Rawdon Briggs
Manager | Research                  Head of Rural & Agribusiness
helen.swanson@colliers.com          Transaction Services
                                    rawdon.briggs@colliers.com
                                                                       permanent crop properties over the past 12 months. The results
Boom time!
                                                                       are explained in the quarterly data release “As the majority of
The Australian Bureau of Agricultural and Resource Economics           data subscribers revalue assets on an annual basis in June and
and Sciences (ABARES) figures released in September 2017               December, appreciation returns are expected to remain flat or
show that Australia’s agricultural sector was the largest              slightly negative over the third quarter of the calendar year”
contributor to National GDP in 2016-17. The agricultural sector        (Australian Farmland Index September Quarter Release, 2017).
contributed 0.5 percentage points of the national GDP total of 1.9
per cent growth. The gross value of farm production across the         Market Forecast
country reached a record $62.8 billion for 2016-17. The sector
also grew the fastest of all 19 industries monitored, up 23 per cent   The outlook for the Australian and New Zealand rural and
with the grains and livestock industry contributing strongly to this   agribusiness sector for 2018 appears positive. There appears to
growth.                                                                be strong appetite for investment in Australian and New Zealand
                                                                       agriculture from both farmers and agribusinesses as well as
ABARES also reported that the agricultural sector contributed          outside investors. Increased investment appetite across the
over $50 billion in exports in 2016-17, just under 14 per cent of      agri-sector resulted in the rise in the value of agricultural land in
total goods and service exports. Grains and livestock products         2017 and this is anticipated to manifest further in 2018. Rising
each contributed $10 billion to exports. Additionally, in 2016-        land values will be underpinned by improving commodity prices
17 pulse exports to the world were worth over $3 billion, wine         in select sectors along with a growing appetite for expansion in
exports $2.4 billion, nut exports $822 million and citrus over $330    other sectors. Colliers International predict many commodities
million. Almond exports were up over 50 per cent for the first half    will experience improved market performance in 2018. Population
of 2017. Chickpea exports to India increased by almost 90 per          growth and rising incomes offshore along with positive market
cent in 2016-17 to a record value of $1.1 billion. Strong growth       fundamentals particularly for the livestock and wine sectors
occurred in the export of agricultural product to China with wine      should contribute to the positive results this year. The table
achieving significant growth at a value of $596 million, a 43 per      overleaf outlines our forecast for commodities in 2018. In terms
cent increase on the previous year.                                    of individual commodities, exceptional performers - wool and
As monitored by the National Farmland Index powered by NCREIF          wine are likely to remain strong into the first half of 2018, with
(a North American based fiduciary data set), the annual total          prices also expected to remain supported in a number of other key
farmland return of a portfolio of selected Australian horticultural,   sectors.
pastoral, intensive livestock and cropping enterprises showed
16.95 per cent for the four quarters to Q3 2017. This compares
to 18.16 per cent for the four quarters to June 2017. Income           2018 Key Themes
returns for the period accounted for 6.30 per cent of returns          The Colliers International Rural & Agribusiness team has identified
while appreciation (capital) returns accounted for 10.23 per           four key themes which we consider will be features of the
cent. This continues to compare favourably to the NCREIF U.S           industry thematic in 2018.
Farmland Index with a total return of 6.15 per cent comprising
                                                                       1. Consolidation of entities within major Agribusiness sectors
4.94 per cent income and 1.17 per cent capital appreciation for the
                                                                       Liberalised free markets and exposure to new export markets
same 12 months to September 2017. In Australia income returns
                                                                       (e.g. TPP) has meant that agricultural firms have been driven to
were slightly down on the trailing year (Q3 2016 7.69 per cent)
                                                                       find scale efficiencies that allow them to compete globally and
while capital returns improved on the prior year (Q3 2016 8.40
                                                                       consequently this has created an impetus for agricultural firms
per cent). This is reflective of the dry winter season however
                                                                       to consolidate. Recent examples of consolidation include the
capital returns have been buoyed by activity in broadacre and

4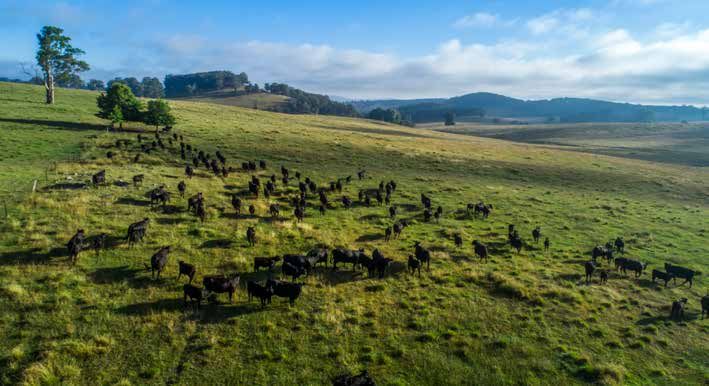
Commodity Market Forecast
         Sector          Production Volume   Prices                 Themes / Forecast First Half 2018

                                                         •   Growing global beef production and increased
                                                             inventory of cattle could exert moderate pressure
                                                             on this commodity price especially the 90CL
                                                             category.
                                                         •   Past property cycles have shown that land
                                                             markets in the beef sector generally continue
                                                             to rise as the commodity price begins to turn
           Beef                                              downwards (leading indicator). Consequently the
                                                             property market plays catch up, approximately 12
                                                             months following the commodity cycle.

                                                         •   Strong local production levels.
                                                         •   Tightening global market.
                                                         •   Positive outlook for the sector this year particularly
           Wine
                                                             for red wine varieties with the largest crop
                                                             harvested in 10 years, aligning with firming prices

                                                         •   Although grains and pulses assets are in high
                                                             demand there is currently low supply available for
                                                             purchase.
                                                         •   Despite Australian production declining during the
                                                             2017/18 season, global supply however remains
                                                             high. Consequently we anticipate Australian prices
     Grains and Pulses                                       for grains and pulses to remain stagnant and or
                                                             decline.
                                                         •   Pulse crop values are volatile particularly for
                                                             Chickpeas and Lentils.

                                                         •   Tight market conditions should support prices.
                                                         •   Wool prices have been achieving record levels so
                                                             far in 2018. Low numbers of Merino sheep flock to
                                                             continue to assist price growth.
      Sheep and Wool                                     •   Strong export markets and limited global growth to
                                                             support sheep meat prices.

                                                         •   Processor ownership issues beginning to be
                                                             resolved.
                                                         •   Global dairy surpluses to continue first half of the
                                                             year.
           Dairy                                         •   MG sale will be a significant game changer with
                                                             renewed confidence from August 2018 onwards.

                                                         •   Increasing access and demand from new export
                                                             markets.
                                                         •   Significant large fund investment is bringing
                                                             international technology to the table.
                                                         •   China exports set to increase this year.
       Horticulture
                                                         •   Growing demand of fresh produce.

                                             Rural & Agribusiness | Research & Forecast Report | 2018                 5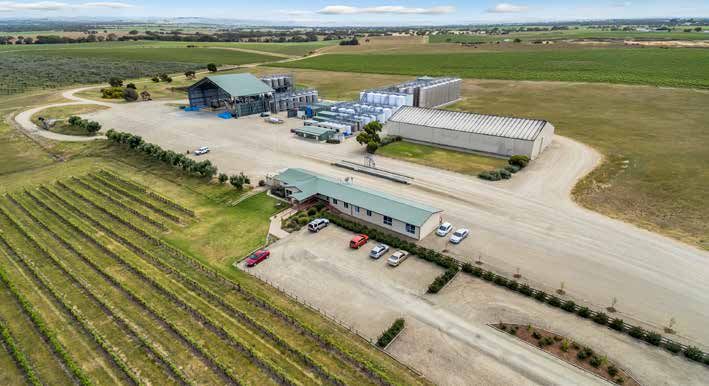
Vineyard & Winery Portfolio, SA & NSW
Valued by Colliers International

significant reduction in the number of companies involved in             The US federal reserve rate has increased 3 times in 2017 to
grain marketing, sugar milling and major bulk handling companies         1.5% with a cumulative increase of 75 basis points during the
having a strong grip over grain storage and handling in the sector.      year. This upward trajectory is likely to continue through 2018 and
Similar changes have occurred in the red meat, dairy, horticulture,      2019, potentially strengthening the US dollar against the Australian
and intensive production and processing sectors. Colliers                dollar. A falling AUD could be expected to create a stronger export
International Research team cannot see this trend changing until         market for Australian agricultural produce. This should increase
Australian bipartisan adoption of USA and antitrust style reforms        the attractiveness of agricultural investments, or potentially help
occur to our Trade Practices Act 1974.                                   offset any declines in global commodity prices.

2. Macro-Economic Impacts
                                                                         3. Sale and lease back agreements in trend for succession
February 2018’s US stock market correction served to spook
                                                                         planning
global equity and currency markets. This uplift in volatility is
                                                                         Sale and leaseback transactions were a feature of the agricultural
primarily a consequence of expected inflationary pressures within
                                                                         sector in 2017 and this trend should continue in 2018. These
the US economy serving to put upward pressure on US interest
                                                                         transactions see the seller paying rent to an investor who
rates. Colliers International’s view is that it is quite possible that
                                                                         purchases the land. The seller will then continue farming
such volatility may well provide renewed focus on the relevance of
                                                                         operations as a tenant of the property. This process has become
buying assets that provide a hedge against inflation. Agricultural
                                                                         popular with families and corporates who are looking to free
land is one such asset class.
                                                                         up cash and realise the value of their landholding and biological

6
assets whilst remaining in control of the business operations.         4. Greater dependence and development of agricultural technology
Sale and leaseback deals are ideal for institutional investors to      The innovation economy has a highly prized reward, including
obtain some exposure to the agricultural sector, without needing       increased productivity and the latest developments have
to be directly involved in management of agribusiness which            challenged the industry to investigate how technology can improve
requires specialist skills. Colliers International predict that 2018   results within the agricultural sector. Innovation at the farm gate
may see new players enter this space such as REITs, Super funds,       is thriving and looks to continue this trend over the next decade,
syndicates and high net worth individuals. The main difference         from driverless tractors to drones to monitor crop health and Uber
in 2018 is that these assets will need to be marketed openly with      style ride sharing apps for ferrying fresh produce. Researchers
a proforma lease completed showing the initial term of the lease       and farmers are now actively experimenting with data driven
and a triple net lease dollar return represented to comply with        applications to drive down costs and optimise land and water use.
FIRB Note 17.                                                          These are combination of economic, environmental and social
                                                                       governess drivers.

                                                        2018 Key Themes

                                Consolidation of entities                  Macro-economic Impacts
                                     in the Sector
                                                                            US Fed rate rises and
                                  Resulting in improved                    potential impact on AUD
                                    productivity and                      and future export demand.
                                    cost efficiencies.

                                 Sale and Lease back                     Greater Dependence and
                                agreements in trend for                Development of Ag Technology
                                  succession planning                  Remote decision tools, Livestock
                                                                       NLIS with a GPS tracker, Drones
                                Free up cash for other
                                                                          for targeted crop spraying,
                               possibility/uses etc while
                                                                            monitoring stock water,
                              market performing strongly.                irrigation, yield mapping etc.

                                                                  Rural & Agribusiness | Research & Forecast Report | 2018              7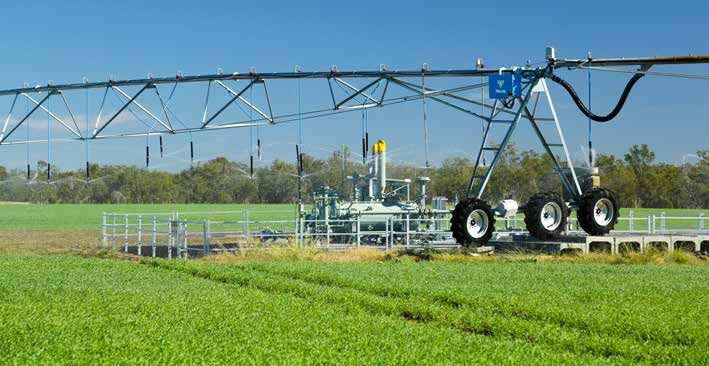
Research &
Forecast Report
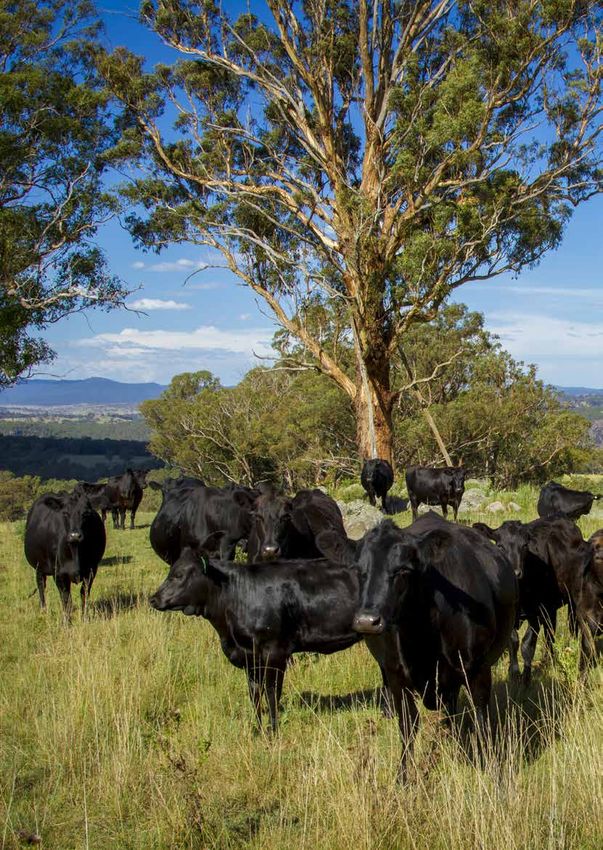
BEEF
Rural & Agribusiness | 2018
By Jim Guilfoyle Rawdon Briggs 2016 levels, while export markets for 2018 are forecast to be
Manager Head of Rural & Agribusiness challenging as many key competitors increase beef production,
Transaction Services Transaction Services including USA, Brazil and India.
Rural & Agribusiness rawdon.briggs@colliers.com
jim.guilfoyle@colliers.com
Angus & Wagyu in favour
Prices a reflection of extreme weather The domestic beef market continues to feel pressure from
conditions increasing pork and chicken consumption. Reduction in the price
point of both proteins contributed to this squeeze, and any further
The Eastern Young Cattle Indicator (EYCI) finished 2017 on a disparity of retail pricing of red and white meats will see this trend
positive note of 578c/kg with the index recovering in the fourth continue. Commoditised offerings remain largely unaffected and
quarter after a steady decline through the year. However, this a positive trend is forecast with the increased food service and
result was still behind the record year of 2016 (638c/kg). Early menu changes offering premium and well-marketed beef brands
in 2018, the cattle market has shown a declining trend due to a and breeds, the most obvious being Angus and Wagyu.
lack of summer rainfall in Eastern Australia, which is forcing large
numbers of cattle into the market. With limited buyer demand, The Australian feedlot industry has experienced a record year for
cattle pricing for the first half of the year will be very dependent numbers of cattle on feed. With over 1 million head in feedlots, a
on rainfall and seasonal conditions. The graph overleaf shows large contributor to this increase is the demand for high quality
these trends over the previous five years data. Wagyu and Wagyu-cross beef. This in turn is driving production
numbers along the supply chain from conception through to
As can be seen in the graph overleaf, a EYCI in both Australian feeding, processing and marketing of this highly sought-after
and US dollars terms, an inversion can be seen in 2010 which Australian export. While longer days on feed (up to 500 days)
is quickly corrected for the following two years due to a strong and heavier carcass weights are typical for Wagyu cattle, this has
Australian dollar. From 2013 onwards the currencies revert contributed to the increase of numbers in feedlots throughout the
to a stronger US dollar, with the largest gap between the two year. Infrastructure upgrades and asset expansions of feeding
currencies EYCI data seen in January 2015 where it hit a high operations are underway in many regions, or are in capital
of 40 per cent disparity. As the beef market in Australia is more expenditure pipelines. These upgrades will absorb the increase in
than 60 per cent beef export focussed, it is logical that a return demand for purebred Wagyu and Wagyu-cross stock.
to a USD inversion is probable in the future. As both the seasonal
conditions improve and the AUD>USD exchange rate changes, the 2017 has seen significant investment occur in both directions
per cent gap is likely to narrow significantly from late 2018. of the beef supply chain, including post-farm-gate investment
through feedlot and abattoir acquisitions, and record transactions
of high-quality property and livestock operations in eastern
Beef export levels steady although
Australian states. This has been even more prevalent in primary
challenges anticipated in 2018
production enterprises as the appetite increases for high-quality
Australian cattle slaughter numbers in 2017 (Jan -Nov) were breeder and backgrounding country suitable for Wagyu cattle.
marginally down when compared to the same period in 2016. Northern NSW and Southern QLD have been key focus areas
Although similar cattle numbers were slaughtered, more kilograms for property purchases for conversion or expansion of Wagyu
of beef were produced due to heavier carcass weights than the enterprises with significant corporate and private companies
previous year (for example more cattle from feedlots not from securing assets with reliable historic property performances,
pastures). Australian Beef exports ended the year in line with
8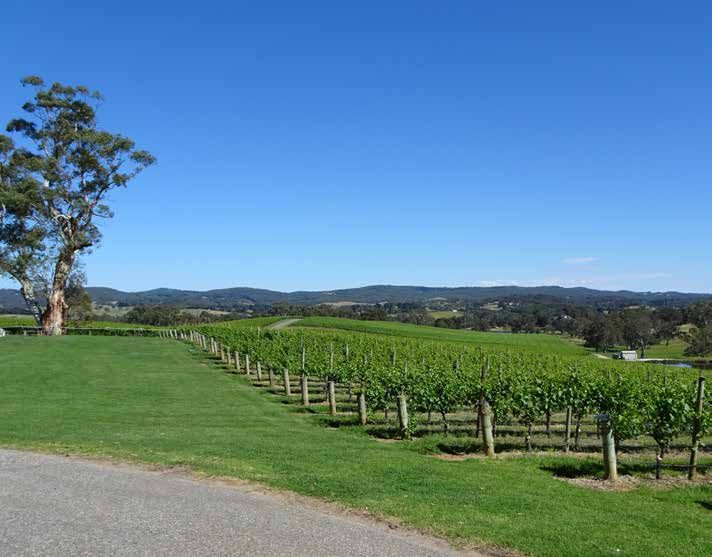
predictable weight gains data combined with low historic land                           Eastern Young Cattle Indicator
price downside volatility. A 15-20 per cent premium is common                                                                800

for suitable Wagyu country where these requirements are met.                                                                 700

Additional upside can be found if the existing supply chain

                                                                                        M o ntlhy Average (Ac/kg cwt)
                                                                                                                             600

relationships that provide immediate benefit to new owners can                                                               500

continue post a transaction.                                                                                                 400

                                                                                                                             300

First shipment of live cattle to China
                                                                                                                             200

                                                                                                                             100

The Northern live export industry has entered another market with                                                                0
                                                                                                                                      Jan     Feb          Mar   Apr       May          Jun      Jul     Aug        Sept     Oct   Nov     Dec

the first shipment of live cattle to China sourced and shipped from                                                                                                2014          2015         2016     2017         2018

Queensland in mid January 2018. This is a significant milestone                         Source : Meat and Livestock Australia and Colliers Agribusiness
for the northern live export industry as blue tongue issues
have previously restricted the supply of northern cattle for this                       Eastern Young Cattle Indicator in AUD & USD
                                                                                                                             8
emerging market. China trade numbers will be a key measurement
                                                                                                                             7
to watch for live and boxed beef trade.

                                                                                                 Monthly Average (Dollars)
                                                                                                                             6

In past property cycles the land markets in the beef sector have                                                             5

                                                                                                                             4
generally continued to rise as the commodity price begins to
                                                                                                                             3
turn downwards. The property market typically plays catch up
                                                                                                                             2
approximately twelve months later following the commodity cycle.                                                             1

                                                                                                                             0
                                                                                                                                 Jan May Sep Jan May Sep Jan May Sep Jan May Sep Jan May Sep Jan May Sep Jan May Sep Jan May Sep Jan

                                                                                                                                     2010           2011         2012         2013             2014          2015          2016     2017   2018

                                                                                                                                                                        EYCI in AUD            EYCI in USD

                                                                                        Source : Meat and Livestock Australia and Colliers Agribusiness

Maria River Cattle Company via Walcha, Armidale and Yarrowitch, NSW equity opportunity.
Colliers International are seeking Joint venture partners to complete a ‘Expressions of Interest’ for MRCC

                                                                              Rural & Agribusiness | Research & Forecast Report | 2018                                                                                                            9
Research &
Forecast Report

WINE
Rural & Agribusiness | 2018

By Nick Dean                     Nick Cranna                            months. These are predominantly located in the inland irrigated
National Consultant              Director                               regions, such as the Riverland and Murray-Darling, as well as
Wine Industry                    Valuation & Advisory Services          temperate regions, such as Langhorne Creek and the Wrattonbully
Transaction Services             Rural & Agribusiness                   and Padthaway regions of the Limestone Coast Zone of the South
Rural & Agribusiness             nick.cranna@colliers.com
                                                                        East of South Australia.
nick.dean@colliers.com
                                                                        There has been a noticeable spike in demand for premium
                                                                        vineyards with regional brands, particularly in the Barossa Valley
Future looks bright for Australia’s 4th largest                         and McLaren Vale in South Australia and the Yarra Valley in
agricultural commodity                                                  Victoria. Market activity in these popular regions has been boosted
                                                                        by some significant transactions, notably sales to market leaders
Wine is Australia’s 4th largest agriculture commodity with a total
                                                                        Treasury Wine Estates and Casella Wines, and by continued
export value of $2.64 billion; with a significant 12 percent increase
                                                                        inquiries from prospective Chinese buyers. High street locations
on last year. The established markets of the US and UK are still
                                                                        in the Yarra Valley and Mornington Peninsula are continually being
the largest importers of Australian wine, although volumes of bulk
                                                                        sought after by established wine companies and tourism operators
wine to these markets have fallen over the last decade. China
                                                                        alike. Both wine regions are popular amongst day trippers, with
continues to be the key growth market for wine exports with total
                                                                        Melbourne’s population forecast to double over the next 30 years.
value expected to reach $595 million in 2016/17, almost tripling
                                                                        We have seen instances where strong premiums have been paid
since 2013/14.
                                                                        to gain a foothold into these tightly held locations. Recent sales in
The 2017 vintage produced the biggest wine grape crop this              the Barossa Valley for smaller, high quality, planted holdings for
millennium at 1.93 million tonnes and still the average price of        example, show rates above $200,000 per hectare for iconic red
fruit rose 7 per cent (source: National Vintage Report). According      varieties and over $100,000 per hectare in the Yarra Valley and
to Wine Australia the average wine grape price has reached its          McLaren Vale for super premium plantings.
highest since 2008 at $565 per tonne. This equates to expected
                                                                        In summary, after a significant period of stagnation we are at last
revenue of $1.22 billion, up 13 per cent on 2016. The red grape
                                                                        witnessing some degree of upward pressure in vineyard values
crush of 1.062 million tonnes was up 12 per cent; the white
                                                                        which is depicted in the chart below as fruit prices and industry
grape crush at 0.887 million tonnes was down 2 percent. Shiraz
                                                                        margins are rising as a result of the improved outlook for export
representing 47 per cent was the dominant variety with an
                                                                        markets.
average price of $765 per tonne, up 12 per cent. The highest
average price was $884 per tonne for Pinot Noir.                        Although the overall outlook has improved, prices for established
                                                                        vineyards in many cases are still less than what it costs to
In 2017, the rate of inquiry for vineyards was generally healthier
                                                                        establish them. New plantings cost $40,000 to $50,000 per
across the board than for some time, albeit off a low base. Long
                                                                        hectare. A vineyard incurs annual maintenance costs of (up to)
standing vineyard listings also began to move and / or attract
                                                                        $10,000 per hectare, depending upon the region, the site, and the
market interest. Also noted was a similar increase in the inquiry
                                                                        varieties. It takes around seven years for new plantings to produce
rate for well-located, smaller wineries in premium wine regions.
                                                                        a “reliable” or dependable crop. Viticulturists then remind us of
                                                                        the effect of agricultural risk “bad years”, frost, pests, disease,
Commercial vineyards in demand                                          extreme weather events and increasing costs. These factors,
The principal targets at present are large scale commercial             coupled with the possibility of a rising market, translate into real
vineyards where we have seen values nearly double in the past 24        incentive for buyers to purchase established vineyards. The first

10
to respond are existing growers and wine producers, looking to Analysis Vineyard Transactions -
expand existing operations and who recognise the opportunity and
Inland Warm Climate Regions
understand the risks. $25,000 /ha
$22,500 /ha
At the time of writing, the growing season is well on its way $20,000 /ha
$17,500 /ha
and vintage is imminent in the warmer regions. Buyers are
Rate ($/ha)
$15,000 /ha
always attracted by the carrot of an upcoming vintage. Colliers $12,500 /ha
$10,000 /ha
International anticipate that there will be proportionately more $7,500 /ha
interest from prospective investors this year and additionally we
$5,000 /ha
$2,500 /ha
believe that vendors are better placed to capitalise upon these $0 /ha
Oct-11
Oct-12
Oct-13
Oct-14
Oct-15
Oct-16
Oct-17
Jul-11
Apr-12
Jul-12
Apr-13
Jul-13
Apr-14
Jul-14
Apr-15
Jul-15
Apr-16
Jul-16
Apr-17
Jul-17
Jan-12
Jan-13
Jan-14
Jan-15
Jan-16
Jan-17
favourable market conditions than they have previously been for
Rolling Trend Avg. Rate
a while. Colliers International Rural & Agribusiness will test this
hypothesis this year with the appointment of several important Source : Colliers International Rural & Agribusiness
listings of industry leading assets in popular South Australian and
Victorian wine growing regions.
Ballast Stone Winery, Currency Creek, SA
Sold by Colliers International
Rural & Agribusiness | Research & Forecast Report | 2018 11Research &
Forecast Report
GRAINS AND PULSES
Rural & Agribusiness | 2018
By John Harrison Emma Addinsal 90 per cent of Australia’s winter crop planted area dedicated to
Manager Analyst one of these four crops. Summer crops grown are mainly cotton,
Valuation & Advisory Services Transaction Services rice, sorghum, maize and other oilseeds. Crop production is
Rural & Agribusiness Rural & Agribusiness broken into three agroecological zones being the Northern Region,
john.harrison@colliers.com emma.addinsal@colliers.com Southern Region and Western Region, represented clearly in the
figure below.
Cropping assets to remain on radar ABARES latest update shows the 2017/18 winter crop production
figure at 37.8 million tonnes, a 36% reduction of the previous
Australia’s annual area under cereal grain and pulse production is season. The reduction in yields are primarily a result of
between 23 and 24 million hectares of which around 22 million inconsistent winter growing conditions for the majority of grain,
hectares is comprised of winter crops and the balance of summer pulse and oilseed growing regions of Australia. Additionally,
focused systems. The Australian winter crop production consists grain and pulse prices have also softened significantly squeezing
primarily of wheat, barley, chickpea and canola with approximately producer profit margins.
Australian agroecological zones
Australian agroecological zones
WESTERN REGION
WESTERN REGION WA Northern
WA Central
WA Northern WA Eastern Northern
Winter — Wheat, barley, oats, triticale, lupins, field peas, WA Sandplain and Mallee Territory
canola, faba beans, chickpeas
SOUTHERN REGION
WA Central Queensland
SA Mid-north – Lower Yorke, Eyre
Winter — Wheat, barley, oats, triticale, cereal rye, lupins, SA – Victoria Mallee
field peas, canola, faba beans, chickpeas SA – Victoria Border – Wimmera Western
Australia
WA Eastern Victoria High Rainfall
Winter — Wheat, barley, oats, triticale, lupins, field peas, NSW – Victoria Slopes South
canola, faba beans, chickpeas NSW Central (south) Australia
Tasmania New South
WA Sandplain and Mallee Wales
Winter — Wheat, barley, oats, triticale, lupins, field peas, NORTHERN REGION
canola, faba beans, chickpeas NSW Central (north)
NSW North West – QLD South West
NSW North East – QLD South East
QLD Central
SOUTHERN REGION Victoria
SA Mid-north – Lower Yorke, Eyre
Winter — Wheat, barley, oats, triticale, lupins, field peas, NORTHEN REGION
canola, chickpeas, faba beans, vetch, safflower Tasmania
SA – Victoria Mallee NSW Central (north)
Winter — Wheat, barley, oats, triticale, cereal rye, lupins, vetch, Winter — Wheat, barley, oats, chickpeas, triticale, faba beans, lupins, field peas,
canola, field peas, chickpeas, faba beans, safflower canola, safflower
SA – Victoria Border – Wimmera Summer — Sorghum, sunflowers, maize, mungbeans, soybeans, cotton
Winter — Wheat, barley, oats, triticale, lupins, field peas, canola, NSW North West – Qld South West
chickpeas, faba beans, vetch, lentils, safflower Winter — Wheat, barley, oats, chickpeas, triticale, faba beans
Victoria High Rainfall Summer — Sorghum, sunflowers, maize, mungbeans, soybeans, cotton
Winter — Wheat, barley, oats, triticale, lupins, field peas, canola
NSW – Victoria Slopes NSW North East – Qld South East
Winter — Wheat, barley, oats, triticale, lupins, field peas, canola Winter — Wheat, barley, oats, chickpeas, triticale, faba beans, millet/panicum,
safflower, linseed
NSW Central (south)
Summer — Sorghum, sunflowers, maize, mungbeans, soybeans, peanuts, cotton
Winter — Wheat, barley, oats, chickpeas, triticale, faba beans,
lupins, field peas, canola, safflower Qld Central
Tasmania Winter — Wheat, barley, oats, chickpeas
Winter — Wheat, barley, oats, triticale, lupins, field peas, canola Summer — Sorghum, sunflowers, maize, mungbeans, soybeans, cotton
Source: http://aegic.org.au/wp-content/uploads/2016/08/what_grows_where_map_higher_res.pdf
12Despite reduced price and production results in 2017/18, strong Market snapshot –
demand has been identified across the majority of Australia’s Western Districts of Victoria
grain-growing regions, as land values continue to strengthen
One of the hottest markets in 2017 was the Western Districts of
in both blue-ribbon and secondary dryland growing areas.
Victoria. Cropping land in this region has experienced a sharp
The market is also experiencing strong demand for irrigated
upswing in arable land values over the past 24 months off the
cropping properties, particularly in the Southern Riverina, Gwydir,
back of renewed corporate interest, a tight supply of listings
Namoi valleys of New South Wales and the traditional cotton
and a ‘flight to quality’ from institutional investors. Some large
and chickpea growing regions including central and southern
institutional investors that have been active in the region include
Queensland.
Proterra Investments, Laguna Bay, Growth Farms and Paraway.
In 2017, cereal grain and pulse property market hot spots attracted Colliers International’s research of historical land trends within
strong investment from private, corporate and institutional an approximate 50 kilometre radius of Skipton reveals that arable
investors. These hotspots include the Western Districts of Victoria, land rates have increased from an average of $4,899 per hectare
the Riverina in New South Wales, along with the reliable cropping in 2013 to $7,581 per hectare late in 2017. This represents a 55
areas of South Australia which include the Yorke Peninsula, Mid per cent increase over the four year period. The highest price
North and South East regions. Over the last five years we have paid for commercial scale cropping land in 2017 was in excess of
seen large irrigation properties in the New South Wales Riverina $10,000 per hectare according to our research.
region undergo significant transformation shifting their focus from
rice production to cotton. Forecast and outlook
The uplift in land values has been the result of several factors We expect land values to remain firm in the reliable and sought
including low interest rates, a lower Australian dollar, a shortage after blue-ribbon cropping districts. More affordable secondary
of available properties and ongoing interest in Australian cropping regions are expected to become more attractive due to
agriculture as a result of free trade agreements with export both price and the offer of greater efficiencies of scale.
destinations. Therefore, there is strong interest in high quality
agricultural land with both local land holders and corporate Large scale cropping holdings which meet the criteria of corporate
institutions looking to expand their existing land holdings in a low and institutional investors will remain highly desirable. As grain
supply market. prices remain stagnant, we expect operators holding diversified,
investment mandates to look to incorporate high value wool and
lamb into their enterprise to improve farm EBITDA. We also expect
farmers to increase the planting area of higher value legume
crops, such as chickpeas and lentils, to improve profit margins if
wheat and barley prices remain subdued.
Buangor Park, Buangor, VIC
Sold by Colliers International
Rural & Agribusiness | Research & Forecast Report | 2018 13Research &
Forecast Report
SHEEP AND WOOL
Rural & Agribusiness | 2018
By Ben Forrest John Harrison What has been the cause of this reduction in
Associate Director Manager sheep numbers?
Transaction Services Valuation & Advisory Services
Rural & Agribusiness Rural & Agribusiness As wool prices became depressed throughout the 1990s and
ben.forrest@colliers.com john.harrison@colliers.com 2000’s, many woolgrowers shifted their focus to composite and
meat sheep breeds, emphasising on prime lamb production as
this was viewed to be a more viable option in comparison to
Good results for sheep & wool prices wool. As highlighted in the National Trade Lamb Indicator graph
overleaf, since 1998 prime lambs have enjoyed strong returns for
Sheep and wool prices have been impressive throughout 2017,
producers which has meant that lamb producers have not had
consistent with other agricultural commodities benefiting from
any reason to consider shifting their focus back to Merino wool
low supply, increased demand and new capital flows. Wool
production.
prices are up 30 per cent on the same period last year with the
Eastern Market Indicator (EMI) in record territory nearing 1,800 Since 2015 however, the price of wool has been steadily
cents per kilo clean which is the largest annual gain in 15 years. increasing and at present is in record territory at least on a
Saleyard prices for sheep also continue to break new territory nominal price level. This strong uplift in value has been a result of
with crossbred ewe sales achieving up to $362 per head in early Australia’s Merino sheep flock being at historically low numbers in
January 2018. National flock numbers have declined dramatically addition to strong offshore demand for Australian wool.
since 1991-92 when totals were well over double today’s 70
At the peak of the market in 1988, Australia’s sheep population
million head.
numbered 180 million with Russia demanding about one third of
According to the ABS 2015-2016, Merino ewes make up the wool supply. There are now only 70 million sheep and China
approximately two thirds of the total breeder population with other processes 80 per cent of the total wool supply. Wool is no longer
breeds one third. a predominantly winter fibre and has shifted towards consumer
preferences to a year-round product, formal and informal with
The reduction in sheep numbers contributed to reduced wool
improved comfort factor. According to www.wool.com this makes
production which over a similar timeframe has ranged down from
for more sustainable market drivers, even considering our reliance
approximately 800 kilotonnes in 1992-93 down to a forecasted
on China.
340 kilotonnes for the 2017-18 season. This decrease in
production is highlighted in the Australian wool production chart How has the continued strength of the meat
overleaf. sheep and surge in wool prices impacted on
The major cause in the decrease in wool production has also property in 2017?
largely been a result of pastoral operators opting to shift from The million-dollar question is how long are current price trends
a Merino flock to meat sheep breeds, primarily Dorpers which likely to continue and moving forward which is the best way to
do not produce a harvestable fleece. Graziers have been drawn go - sheep and wool or purely meat sheep production? Whilst
to meat sheep breeds, because of their superior lambing this does depend on numerous variables such as location and
percentages, strong growth rates, low maintenance, lower land suitability, current gross margins for Dorper operations
operational costs (specifically don’t require shearing or crutching) are attractive. That said, at current wool prices, merino sheep
and are also better suited to arid climate conditions or periodic operations are now also back in the spotlight. Looking forward
droughts in comparison to Merinos. there is likely to be continued volatility however fundamentals
remain positive for sheep meat, and on the back of low global
14production we expect demand for wool to continue with prices Merino Ewe numbers vs Other breeds
remaining firm in the medium term.
2017 property sales and DSE values
11,957,698
Throughout 2017 we identified several transactions at rising
market values within the sheep sector with values ranging from 25,224,164
$300 to $750/DSE. Transactions of note include the “Clover
Downs” sale at Cunnamulla which was marketed by Colliers
International and reflected a $415/DSE.
Livestock - Sheep and lambs - Livestock - Sheep and lambs -
Further south, the South Australian Pastoral property market Breeding ewes 1 year and over - Breeding ewes 1 year and over -
Merinos (no.) Other breeding ewes n.e.c. (no.)
is currently hot with demand for pastoral holdings currently
Source: ABS, Agricultural Commodities, 2015-16
outstripping supply. Several recent transactions reveal a surge in
values. The transactions of Beltana Station and Martin’s Well, both Australian Wool Production
located in the Flinders Ranges, achieved analysed rates of $370/ 200 900
DSE and $384/DSE respectively whilst the sale of Kalabity in the 180 800
160 700
North East of South Australia started the trend, achieving $373/ 140
600
120
DSE. Over the border in the Western Division of New South Wales,
(kt g reasy)
500
M illion
100
400
record values were also achieved with Eaglehawk at Broken Hill 80
300
60
selling for a reported $3.45 million, reflecting $627 /DSE based 40 200
on an advised carrying capacity of 5,500 dry sheep equivalents. 20 100
0 0
These values in both South Australia and the Western Division
of New South Wales have been somewhat underpinned by the
Sheep Numbers Shorn (million) Shorn Wool Production (kt Greasy)
additional income derived from good populations of feral goats
which are also enjoying strong returns. Source: AWI, MLA and Colliers International
Demand for high rainfall grazing properties in the South East of National Trade Lamb Indicator – 1998 to 2018
South Australia and Western Victoria has also been strong with
800.00
values ranging from $450 to $730 /DSE. Towards the end of
700.00
2017, we have seen the market for high quality grazing properties
600.00
in high rainfall areas further strengthen with Thomas Foods 500.00
c/kg C WT
International acquiring Mount Schanck Station in the Lower South 400.00
East of South Australia for a reported price in excess of $50 300.00
million (walk in walk out – including livestock and plant). This 200.00
transaction further underpins the confidence in the rural property 100.00
market for assets suitable for sheep and wool production. 0.00
98 99 00 01 02 03 04 05 06 07 08 09 10 11 12 13 14 15 16 17 18
Ye ar
Property outlook and forecast Source: MLA and Colliers International
In 2018, we expect strong demand to continue for properties QLD gross margins per DSE
suitable for sheep and wool production with property values likely
40
to increase further. At present demand for high quality grazing
35
assets in both pastoral and high rainfall regions is currently 30
Gross Margin per DSE AUD
outstripping supply. We expect interest to come from both private 25
family operations looking to further expand and corporate/ 20
institutional grade investors. 15
With the strong returns achieved for sheep meat and wool, we 10
expect cropping operators who have historically solely focused 5
on grain, oilseed and pulse production to incorporate sheep 0
Dorper DBL F1 Lambs Boer Goats Dorper Aut Merino 21U Dorper Cont SR Herd Cattle
into their enterprise in an attempt to diversify and improve their
Source: 2017 Data and assumptions courtesy of Lloyd Dunlop, Sheep and Lamb
farm profitability. As the national Merino sheep flock is still at Consultant, Goondiwindi
historically low numbers, we expect current wool prices to be **Margin data is Qld based and subject to assumptions including location, carrying
capacity, genotype, feed intake, improved lambing percentages and labour inputs. Chart
sustained throughout 2018 and potentially increase further which is indicative only.
will create a flow on effect in the price for Merino breeding stock.
Rural & Agribusiness | Research & Forecast Report | 2018 15Research &
Forecast Report
HORTICULTURE – CITRUS
Rural & Agribusiness | 2018
By Jesse Manuel Nick Cranna Australian exports remain a relatively minor portion of worldwide
Associate Director Director trade, accounting for approximately 3 per cent of global trade.
Transaction Services Valuation & Advisory Services Over the past three years the volume of citrus exported to China
Rural & Agribusiness Rural & Agribusiness has increased significantly as depicted in the chart overleaf. The
jesse.manuel@colliers.com nick.cranna@colliers.com
staged reduction in tariffs, together with the lower Australian
dollar, has also helped to assist with exports.
Asian demand driving up fruit prices and Orchard values on the rise
orchard property values
The citrus orchard market is seeing its strongest market
The citrus industry in Australia is one of the largest fresh
conditions in several years, driven by the increased profitability
fruit exporters with an estimated 230,000 tonnes exported to
in the sector that has been largely due to China’s demand
numerous countries around the world, totalling more than $300
for Australian product. This increased profitability of citrus
million in gross sales during 2017. This is compared to 2015,
enterprises coupled with the lack of buying opportunities for
where Australia exported 208,000 tonnes of citrus products
purchasers, is placing significant upwards pressure on orchard
valued at $288 million. Much of the production in the sector is
values.
controlled by a select group of large farming families, corporate
agribusinesses and a growing pool of passive or institutional These market dynamics have encouraged a spike in demand for
investors (including superannuation funds). It is estimated that mature citrus orchards in recent months and market activity has
around 20 per cent of growers produce approximately 90 per cent been boosted by some notable transactions showing nearly 100
of produce. per cent increase in values in less than three years for mature
orchards comprising sought-after varieties.
The three largest citrus producing regions (Riverland, Riverina,
and Sunraysia) represent more than 80 per cent of total Important sales to note include the following three sales which
production. Oranges are the most widely produced citrus crop, occurred in 2017:
accounting for approximately three quarters of production in 2017, SOS Citrus at Colignan, VIC, which totalled around 75 hectares
with around half being grown for juice. The 2017 season was a of predominantly fresh varieties and sold for $3.225 million. This
strong year for producers with demand far-outweighing supply sale reflects an analysed orchard rate of $30,000 per hectare
with prices moving from $280-$300 per tonne for Valencia’s to (average).
$500-$600 per tonne due to the shortage.
Impi Citrus at Lindsay Point, VIC, which totalled around 77
Over the last 24 months, global competition in citrus trade has hectares of citrus plantings including mandarins and grape fruit.
reduced, largely because of the ongoing drought in California and This sale is under contract for around $5 million which reflects an
Hurricane Irma which impacted yields in late 2017. Both resulted analysed rate of around $45,000 per hectare (average).
in a decrease in exports and lower volumes of supply. This has
had a positive effect on Australian citrus exports with an increase Sunraysia Salads at Nangiloc, VIC, totalled around 101 hectares
in demand for early season Australian citrus, given the reduction of citrus plantings and included significant areas of development
of supply of late season California citrus. land. The citrus orchard was planted mainly to Navel oranges and
had minor plantings of mandarins and lemons. Our analysis shows
a rate of around $40,000 per hectare (average).
16Owners of quality citrus assets are undoubtedly better placed than Australian Citrus Production Outlook
they have been for a long time. Over the past 12 months we have 300,000
seen new institutional investors enter the market via sale and 250,000
leasebacks and walk-in walk-out sales. Institutional investors who 200,000
Tonnes
have entered the market recently include CK Property Holdings, 150,000
Prime Value, Costa Group, Blue Sky Agriculture and Agriculture 100,000
Capital to name a few. 50,000
0
Buyers have been focussing on orchards which are well located Queensland Riverina
2016
Murray Valley
2020 2025
Riverland WA
to labour and packing facilities can be efficiently managed and are
Source: Colliers International and Citrus Australia
developed to fresh citrus varieties, seedless varieties and lemons,
which are showing the highest margins recently. Australian Citrus Exports to China
90,000
Some Citrus asset operators run significant Table grape 85 ,000
80,000
enterprises as a physical commodity hedge. The Colliers 70,000
International Rural & Agribusiness team will bring a number of 60,000
To nnes
horticulture assets to market in 2018 that will test the values 50,000
40,000
outlined above.
40,000
29 ,000
30,000
18,000
20,000
14,25 0
10,000
3,85 0
400 1,100
0
2010 2011 2012 2013 2014 2015 2016 2017 (f)
Citrus Exports
Source: Citrus Australia
Rural & Agribusiness | Research & Forecast Report | 2018 17Research &
Forecast Report
POULTRY
Rural & Agribusiness | 2018
By Jesse Manuel Alex Thamm of free range production in South Australia, whereby in excess of
Associate Director National Director 60 purpose built free-range sheds have come into production over
Transaction Services Valuation the last three years to take advantage of consumer demand for
Rural & Agribusiness Rural & Agribusiness this product segment.
jesse.manuel@colliers.com alex.thamm@colliers.com
Farm change of use
Australian Chicken Meat Industry - As a result of the consolidation or closing down of certain
Consolidation processor’s operations in various eastern state locations, a
number of contract growers have had their contracts terminated
The Australian chicken meat industry is undergoing significant
and are having to seek an alternative use for their facilities. This
consolidation, particularly with the major processors’ desire for
has undoubtedly caused unrest in the industry with producers,
increased economies of scale in every facet of their supply chain
investors and financiers alike taking greater caution in assessing
from breeder farms through to processing facilities. On one
broiler farm acquisitions. In some cases, owners of broiler farms
hand, this is driving major investment in the sector. On the other,
have not been able to secure alternative production arrangements
third party contract growers in regions that are becoming more
for their sheds and have been forced to sell due to the loss of
expensive for processors to conduct their business, are losing
income.
contracts to the bigger broiler farm operators where greater
operational efficiencies can be achieved. The two main alternative uses for out-of-contract broiler farms
include rearing layer hens for the egg industry and actual egg
Baiada’s significant expansion in New South Wales in recent
production. Both uses require investment in farm modifications,
years and the closure of its Victorian and South East Queensland
meaning the price that egg industry participants can afford to pay
processing operations has led to a greater shift in the profile
for these farms is likely to be significantly less than the value of an
of contract broiler growers. This has resulted in the shift from
asset operating as a commercial broiler farm. Further, the returns
traditional small family owner operator model to large corporate,
that egg producers are able to generate out of these assets is
institutional and private syndication investments (i.e. modern
generally lower than broiler rearing operations, also having an
‘super farms’).
impact on value.
Such projects have required tens of millions and in some
There are now several owners of un-contracted broiler farms
instances hundreds of millions of dollars invested in strategic and
throughout the eastern states looking for an alternate use or
centralised poultry ‘hubs’. These regions have access to abundant
a sale. Whilst there is interest from parties looking to convert
feed grain for poultry consumption, affordable land, proximity to
uncontracted broiler farms to an alternate use, the depth of this
high capacity power and water supply and importantly, access to
market is limited. It is our view that those farms that enter the
markets.
market ahead of their competition have a greater chance of being
Griffith and Tamworth in New South Wales are two regions whose taken up by alternate users.
communities have benefited significantly because of the expansion
It is still too early to accurately determine the effect of a loss
in poultry related infrastructure. For example, Baiada’s rapid
of contract on broiler farm values, however there has been
expansion in Griffith has included the construction of hundreds of
some recent sales evidence showing a 40 per cent to 50 per
broiler rearing sheds built by a handful of private operators and
cent reduction in the sale price of vacant farms compared to
Australia’s largest contract broiler rearing operation, “ProTen”.
their previous value as operating commercial broiler farms. One
Australia’s other major chicken meat processor, Ingham’s, has also transaction completed by Colliers International was the sale of
undergone significant expansion activities, particularly in the form the Meredith Broiler Farm in Victoria. The asset comprised four
18modern tunnel ventilated production sheds, associated broiler Poultry - Australia’s Biggest Share of Meat Plate
farm improvements and a large homestead located on the Midland
Highway, halfway between Geelong and Ballarat. The property
7%
sold to a local egg producer for $3.52 million and showing a circa
45 per cent reduction on its previous sale value when the property Lamb
42% 23%
had a contract grower agreement. The saleability and achievable Pork
value of farms will be a case by case situation and ultimately Beef
depends on such things as the value of the underlying land and Poultry
the level of the demand for alternative uses. 28%
Market outlook
Source: OECD, December 2016
The key factors in play that we are watching carefully are:
• The recent expansion and consolidation within the broiler
industry into production hubs has resulted in increased
future margin squeezes. It can be difficult to reprice product
supply of birds to processors in these key areas.
upwards once consumers become accustomed to lower
• The conversion of major poultry processors from private to prices.
public ownership has the potential to alter market dynamics.
• From a valuation perspective, lower payments to growers (if
Shorter term profit expectations and other management
they eventuate) will most probably make it more difficult to
drivers can differ under public ownership and there is
justify new shed construction for those farms contemplating
potential for these motivations to cause disruption within
expansion.
the sector.
Notwithstanding the above potential headwinds, chicken meat
• Supermarket retailers have discounted poultry products
remains a key protein choice for Australian consumers and the
in recent times to attract customers in a similar manner to
vast majority of meat products are consumed within Australia’s
the new way milk was treated earlier this decade. While
domestic market place. Well located, modern broiler farms
the market indications are that this has increased sales for
are expected to remain one of the stronger cash generating
processors without margin pressure, there is potential for
investments to be made in the agricultural sector.
Mypolonga Broiler Farm, SA
For sale by Colliers International
Rural & Agribusiness | Research & Forecast Report | 2018 19Research &
Forecast Report
NEW ZEALAND
Rural & Agribusiness | 2018
By Shane O’Brien in the horticulture industry in the next 3-4 years.
National Director
Marlborough’s wine area is potentially expanding by 5,000 hectares
Real Estate | Rural & Agribusiness
shane.obrien@colliers.com (25 percent) towards 2020, Zespri is planning to release 400
hectares of Gold3 kiwifruit licenses annually for the next three
Primary sector exports to grow 9.7 per cent years. Apple and pear planted areas could exceed 11,000 hectares
in 2018 (an increase of 11 percent from current levels) by 2020.
The New Zealand primary sector exports are expected to grow by
9.7 per cent during 2018 to $41 billion on the back of a strong and Good years to continue for the viticulture sector
diversified primary sector with forestry and horticulture continuing We have seen strong growth in the wine industry over the last five
to do well, along with recovery in the dairy sector after a tough to six years on the back of increased processing capacity within
few seasons. The change of Government in September 2017 did wineries, stronger demand from export markets and a lift in the
little to stem market activity although the promise to limit overseas contract grape price paid to growers. This has resulted in land
investment in rural land saw a marked decline in offshore enquiry. values increasing with an active property market at the current time.
Buyer sentiment remains positive with sale prices remaining
consistent with earlier years, but a flight to quality in the dairy Annual wine export revenue currently exceeds $1.6 billion and with
sector is seeing some farms remaining unsold at the end of 2017. the growth in grape plantings predicted in coming years reflect
Forefront within the mind of potential purchasers is the reliability ongoing industry confidence.
and cost of future production, as the changing environmental Together, the two main wine regions in New Zealand, Marlborough
landscape and imposition of increasingly stringent regional plans and Hawke’s Bay, make up 78 per cent of the total for New Zealand
is starting to become evident. producing vineyard area, up from 70 per cent in 2006. In the past
Overseas purchasers have been less active in 2017 compared to 10 years, the total vineyard area in New Zealand has grown from
previous years, where they had a visible impact on some markets. 17,852 hectares to 27,976 hectares or a 56.7 per cent increase.
A reduction in new capital from foreign purchasers and reduced Recent surveys by the Ministry of Primary Industries show a
credit availability from the trading banks has the potential to slow potential 20 per cent or approximately 5,000 hectare increase
the New Zealand dairy market in 2018, particularly for larger scale in Marlborough’s vineyard area in the next five years, increasing
and higher value properties. production levels beyond 2020 and drive further export growth.
Very dry conditions over much of New Zealand in early 2017 On average, vineyard values throughout Marlborough, have
was offset by much needed spring rains with farmgate prices increased by around 6 per cent over the past 12 months,
remaining steady despite supply being constrained in some areas. with greater lifts in the Lower Wairau area which has already
experienced a strong lift in values during 2016 of around 15 per
cent. The increase in vineyard values is influenced by both the rise
Positive outlook for horticulture exports
in contract grape price, increased production in recent years and
Strong growth in horticulture exports are expected with a total strong export demand.
value increasing to $6.3 billion by 2021, predicted to be led by
We have seen a number of record vineyard sale prices in recent
kiwifruit and supported by strong ongoing growth prospects for
months including a sale in excess of $300,000 per planted
wine, apple and pear exports.
hectare in Marlborough to a well-established wine company.
Further vineyard expansion is forecasted, along with the release of This demonstrates the continued confidence within the industry
more Gold3 kiwifruit licenses, and the replanting and expansion of and strong demand for Marlborough wine which has also been
apple orchards are driving an expectation of strong volume growth highlighted by recent export figures.
20Forestry Beef
The market value for both pre-1990 and post 1989 forestland has Dairy-beef cross market remains strong with prices ranging from
continued to strengthen over the last 12 months with numerous $500 to $550 for 100 kg live-weight dairy-beef cross steer and
sales occurring right across the spectrum of the market. heifer calves in 2017. There is some concern about the emerging
issue of Mycoplasma Bovis and the risk of further spread of
Nelson Forests Limited was marketed earlier in the year, a 60,000
disease from movement of dairy stock.
hectare pine forest across Nelson and Marlborough and includes
a sawmill. We understand it has sold to “Australian domiciled The store cattle market has weakened following an extended dry
OneFortyOne Plantations”. spell from mid-October and trading at $2.80 to $3.00 kg live-
weight for heifers and $2.90 to $3.10 kg live-weight for steers,
The government has announced that it is considering including
although a lack of buyers due to dry could push prices.
more than 50 hectares of cutting rights or forestry rights as being
sensitive land under the act. This may hinder overseas investment The prime cattle market remains strong relative to historical
within this sector. levels although has come off record highs despite commentators
suggesting prices may ease. The current beef schedule for prime
China continues to be our largest market with over $1.81 billion
steers and heifers is at $5.20 to $5.40/kg carcass weight.
worth of logs exported in the first 11 months of 2017 accounting
for over 75per cent of the softwood market. Export prices are influenced by US beef prices which have
remained firm due to strong demand. Japan’s tariff increase on
The value of forestland or land suitable for afforestation continues
frozen beef from March 2018 is a negative factor, moving up to 50
to be influenced by the carbon market which has strengthened
per cent from 38 per cent.
over the past two years from a low of $9.00 to $21.40 per tonne in
January 2018. Sheep
New seasons prime lambs are selling well with farmers receiving
Wool
$6.90 kg carcass weight or approx. $130/head for average 19 kg
Fine and mid-micron wool types are at or near record highs carcass weight lamb.
driven by demand from the apparel sector.
International demand is high with lamb prices well above
Crossbred wool representing the majority of the New Zealand historical averages and expected to be higher than the 2016-17
wool clip has lifted slightly from record lows however are selling season with supply tight.
still trading at historically low levels due to a drop in demand
Store lamb market dropped to $2.85 kg live-weight and expected
from China and weak demand for carpet yarn generally. Some
to firm to $3 kg live-weight following recent rainfall.
stockpiled crossbred wool has been moving through the system.
Breeding ewe prices are strong although have eased recently due
to an increase in supply because of dry conditions underpinned
by strong schedule prices. Alliance Group is offering $4.35 kg
carcass weight for cull ewes.
Global demand for sheep meat is firm for all cuts.
Dairy
2017 has been a year of cautious recovery for the New Zealand
dairy farm market. Following two challenging years of low milk
solid prices at or below the cost of production, the milk solid
payout is more reflective of the long term trend and has seen an
improvement in market sentiment from previous lows.
There have been a number of strong dairy farm sales transact
within 2017, however it is becoming apparent that a two stage
market is emerging. Well located and improved farms with a
good physical resource mix of soils, water and climate have been
selling well, whilst those properties within fringe areas or with
management challenges have been stagnating on the market.
White Rock, South Canterbury, NZ
Sold by Colliers International
*All references to amounts are reported in NZD.
Rural & Agribusiness | Research & Forecast Report | 2018 21You can also read