CONSOLIDATED INTERIM REPORT 2018 - Poste Italiane
←
→
Page content transcription
If your browser does not render page correctly, please read the page content below
Financial Office

                           CONSOLIDATED
                           INTERIM REPORT 2018

  Consolidated Interim Report 2018
Financial Office

   CONTENTS

   Corporate bodies

   Group structure

   REPORT ON OPERATIONS

         -     Executive summary

         -     Economic and market environment

         -     Operating review

         -     Financial review

         -     Equity and solvency margin

         -     Operating results

         -     Organisation of the Poste Vita Group

         -     Relations with the parent and other Poste Italiane Group companies

         -     Other information

         -     Events after 30 June 2018

         -     Outlook

   Financial statements

        -     Income statement

                                                       2
   Consolidated Interim Report 2018
Financial Office

   Corporate officers

   BOARD OF DIRECTORS(1)

   Chairwoman                                         Maria Bianca Farina

   Chief Executive Officer                            Matteo Del Fante (2)

   Director                                           Antonio Nervi

   Director                                           Francesca Sabetta (3)

   Director                                           Dario Frigerio

   Director                                           Roberto Giacchi

   Director                                           Gianluigi Baccolini

   BOARD OF STATUTORY AUDITORS(1)

   Chairman                                           Marco Fazzini

   Auditor                                            Marco De Iapinis

   Auditor                                            Barbara Zanardi

   Alternate                                          Maria Giovanna Basile

   Alternate                                          Massimo Porfiri

   INDEPENDENT AUDITORS(4)                            BDO Italia SpA

   1.    The Board of Directors and the Board of Statutory Auditors were appointed by the shareholders at the General Meeting held on 19
         June 2017 and will serve for three-year terms of office, until approval of the financial statements for 2019.
   2.    Following Tania Giallatini’s resignation as a Director, on 26 July 2017, Poste Vita’s Board of Directors coopted Matteo Del Fante to
         serve as a Director. At the same meeting, Mr Del Fante was also appointed Poste Vita’s Chief Executive Officer.
   3.    Francesca Sabetta resigned as a Director of Poste Vita SpA with effect from 20 April 2018.
   4.    Appointment approved by the shareholders at the General Meeting of 29 April 2014.

                                                                        3
   Consolidated Interim Report 2018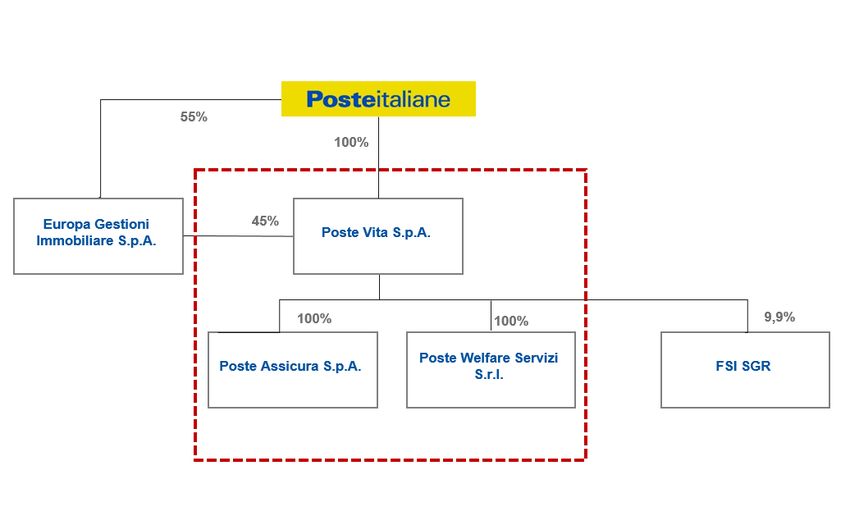
Financial Office

   Group structure

   The Poste Vita Insurance Group’s current structure and its scope of consolidation are briefly
   described below:

   The Poste Vita Group operates in the life and non-life insurance sectors, and has a leading position
   in the life sector and a growth strategy in the non-life sector.
   The scope of consolidation includes the subsidiary, Poste Assicura SpA, an insurance company
   founded in 2010 to provide non-life insurance, excluding motor insurance, and a wholly owned
   subsidiary of the Parent Company, Poste Vita, and Poste Welfare Servizi Srl, a company that
   primarily provides its customers with administrative, technical and software assistance relating to the
   management of health funds and data acquisition and validation. The latter company is also a wholly
   owned subsidiary of Poste Vita.

   The Parent Company also holds a non-controlling interest in Europa Gestioni Immobiliari SpA, a real
   estate company tasked with the management and development of Poste Italiane’s properties no
   longer used in operations. This investment is not accounted for on a line-by-line basis, but using the
   equity method.

                                                      4
   Consolidated Interim Report 2018
Financial Office
EXECUTIVE SUMMARY
In keeping with the strategic objectives set out in the business plan, in the first half of 2018, the Poste
Vita Insurance Group primarily focused its efforts on:
• strengthening its leadership in the life market for traditional and pension products, whilst also
developing its Class III business;
• achieving growth in the protection and welfare segment.
The reclassified income statement, broken down by category of insurance, is shown below:
RECLASSIFIED INCOME STATEMENT €m
for the six months ended 30 June 2018 2017
Non-life business Life business Total Non-life business Life business Total
Net premium revenue 61.7 8,813.8 8,875.5 49.0 11,048.9 11,097.9
Gross premium revenue 81.6 8,820.5 8,902.1 64.7 11,057.8 11,122.5
Outward reinsurance premiums (19.9) (6.7) (26.5) (15.8) (8.9) (24.6)
Fee and commission income 8.7 8.7 4.6 4.6
Net finance income from assets related to traditional products 2.0 1,715.5 1,717.5
2.1 901.6 903.7
Income 2.1 1,415.9 1,418.0 1.9 1,367.0 1,368.9
Realised gains and losses 0.0 155.3 155.3 0.0 97.9 97.9
Unrealised gains and losses 0.0 (669.6) (669.6) 250.6 250.6
Net finance income from assets related to index- and unit-
69.9 69.9
linked products (18.4) (18.4)
Net change in technical provisions (14.4) (9,071.4) (9,085.9) (14.2) (12,165.6) (12,179.7)
Claims paid (17.5) (3,956.9) (3,974.4) (12.0) (5,137.7) (5,149.6)
Change in technical provisions (5.6) (5,118.3) (5,123.9) (8.3) (7,036.3) (7,044.5)
Share attributable to reinsurers 8.6 3.9 12.4 6.1 8.3 14.4
Investment management expenses (0.2) (22.3) (22.5) (0.2) (19.9) (20.1)
Acquisition and administration costs (20.2) (265.5) (285.8) (19.9) (288.0) (307.9)
Net commissions and other acquisition costs (9.3) (223.7) (233.0) (6.4) (243.5) (249.9)
Operating costs (10.9) (41.8) (52.7) (13.5) (44.5) (58.0)
Other revenues/(costs), net 3.8 (17.4) (13.7) 2.8 (32.3) (29.5)
GROSS OPERATING PROFIT 32.7 329.1 361.8 19.5 333.1 352.6
Net finance income from investment of free capital 43.4 43.4 30.5 30.5
Interest expense on subordinated debt (15.1) (15.1) (13.6) (13.6)
PROFIT BEFORE TAX 32.7 357.4 390.1 19.5 350.0 369.4
Income tax expense (9.3) (128.8) (138.1) (5.3) (129.6) (134.9)
NET PROFIT 23.4 228.6 251.9 14.2 220.4 234.6
The Life business generated gross premium revenue of €8.8 billion, marking a decline with
respect to the first half of 2017 (€11 billion), but reflecting an uneven performance depending on
class of business. Class III premiums amount to €416 million, marking a significant improvement
with respect to the €232 million of the same period of 2017 (growth of 79%), driven by inflows into
the PIR (Piano Individuale di Risparmio) product launched from the second half of 2017, amounting
to €225 million, and the positive performance of the multiclass product which, with net premium
revenue of €299 million (including €148 million generated by sales of Class III products), registered
growth of 45% compared with 2017.
After years of significant growth, and within the context of a shrinking market, gross premium revenue
from sales of Class I and V investment and savings products (traditional separately managed
accounts), including pension products, amounts to €8.4 billion, down from the €10.8 billion of the
first half of 2017. Net premium revenue of €4.9 billion remained positive (€5.9 billion in the first half
of 2017), contributing significantly to the growth in assets under management, in line with the stated
aim of consolidating the group’s market leadership.
Sales of regular premium products also performed well (Multiutile Ricorrente, Long Term Care, Posta
Futuro Da Grande), with over 34 thousand policies sold during the period, as did sales of the
PostaPrevidenzaValore product which, with almost 29 thousand policies sold during the period and
5
Consolidated Interim Report 2018Financial Office
a total number of members that has reached 966 thousand. This has enabled the Company to
consolidate its leadership in the pensions market.
Sales of pure risk policies (term life insurance), sold in stand-alone versions (not bundled together
with products of a financial nature), recorded sales of over 93 thousand new policies during the
period (gross of cancellations), whilst the number of new policies, again of a pure risk nature, sold
bundled together with financial obligations deriving from mortgages and loans sold through Poste
Italiane’s network totalled approximately 44.3 thousand.
While the contribution of the Non-life business to the Group’s results is still limited, sales in this
area have also performed well, with total gross premium revenue for the period of approximately
€96.4 million (€81.6 million after the change in technical provisions), up 32% on the same period of
2017 (€73.3 million). Growth was driven by all the types of policy: i) CPI up 44%; ii) Property and
Personal up 11% thanks also to the launch of the Posta Protezione Casa 360 product, which has
introduced cover for guarantees linked to natural disasters, and iii) Welfare, where revenue is up
from €4.1 million in the first half of 2017 to €14.3 million, driven by the launch of the health care fund
for the Poste Italiane Group’s employees from April 2018 and by growing inflows into other health
care funds and collective accident policies.
In terms of investments during the period, the investment policy continues to be marked by the
utmost prudence, based on the guidelines established by the Board of Directors. As a result, the
portfolio is primarily invested in government securities and corporate bonds, with an overall exposure
that represents around 78% of the entire portfolio. The rest of the portfolio is primarily invested in
multi-asset, harmonised open-end funds of the UCITS (Undertakings for Collective Investment in
Transferable Securities) type. Returns on investments linked to separately managed accounts
registered good performances, with returns of 3.25% for PostaPrevidenza accounts and 2.76% for
PostaValorePiù accounts.
The negative performances of the financial markets during the period, above all the increase in the
spread between ten-year Italian Treasury Notes (BTPs) and German Bunds from May 2018, was
reflected in an overall reduction in unrealised gains, which are down from €8.3 billion at the beginning
of the year to €3.4 billion at 30 June. The investment of “free capital” generated net finance income
of approximately €43.4 million, an increase on the figure for the first six months of 2017 (€30.5
million).
As a result of the above operating and financial performance, technical provisions for the Life
business’s direct Italian portfolio amount to €121.1 billion (€115.3 billion at the end of 2017). This
includes €116.5 billion in mathematical provisions for Class I and V products (up on €110.5 billion at
the end of 2017) and provisions for products where the investment risk is borne by policyholders,
amounting to approximately €3.2 billion (down from the €3.5 billion of 31 December 2017). Deferred
Policyholder Liability (DPL) provisions, linked to the above change in the fair value of the financial
instruments covering the provisions, amount to approximately €3.3 billion, down from €8.2 billion at
the beginning of the year.
Technical provisions for the Non-life business, before the portion ceded to reinsurers, amount to
€160.2 million at the end of the period, up 12.7% compared with the end of 2017 (€160.2 million),
reflecting the growth in business.
6
Consolidated Interim Report 2018Financial Office
With regard to organisational aspects, the period witnessed a reduction in the cost of consultants’
fees and of external professionals, as well as completion of the amortisation of the “PASS” operating
system used by the Non-life business. This resulted in operating costs of approximately €52.7
million in the first half of 2018, down from €58.0 million in the first half of 2017. This means that
operating costs continue to remain at around 0.6% of earned premiums and 0.1% of provisions,
figures broadly in line with 30 June 2017.
*****
The above operating and financial performance has resulted in EBITDA of €390.1 million for the
period (€369.4 million for the same period of 2017). After tax, net profit amounts to €251.9 million,
up 7.4% on the €234.6 million of the first half of 2017.
7
Consolidated Interim Report 2018Financial Office
Key performance indicators
A summary of the principal KPIs is shown below:
( €m )
PRINCIPAL FINANCIAL KPIs 30 June 2018 31 December 2017 Increase/(decrease)
Equity 3,194.3 3,369.3 -175.0 -5.2%
Technical provisions 124,581.0 123,650.6 930.4 0.8%
Financial investments* 127,187.2 126,824.0 363.2 0.3%
Solvency II ratio 185.1% 279.4% -94.3%
Workforce 551 535 16
PRINCIPAL OPERATIONAL KPIs 30 June 2018 30 June 2017 Increase/(decrease)
Gross premium revenue 8,902.1 11,122.5 -2,220.4 -20.0%
Net profit 251.9 234.6 17.4 7.4%
ROE** 15.8% 14.9% 0.9% 0.9%
Operating costs / Earned premiums 0.6% 0.5% -0.1
Operating costs / Provisions 0.1% 0.1% 0.0
* including cash
** in calculating this indicator, the figure for equity w as determ ined net of the FVOCI reserve
8
Consolidated Interim Report 2018Financial Office
ECONOMIC AND MARKET ENVIRONMENT
Economic and market environment
Global economic growth remained strong during the second quarter of 2018, though the outlook is
less positive given concerns over US trade policy and over the Brexit talks. The rising price of oil
has caused inflation to rise in advanced economies, although price pressures remain under control.
Against this backdrop, the process of normalising monetary policy continues to be gradual, allowing
the financial markets to adapt to the new environment without any major shocks.
Growth in the United States remains strong, with spare capacity continuing to decline, full
employment (the unemployment rate is 3.8%) and core inflation having returned to 2%, in line with
the Federal Reserve’s target. In this context, in June, the Federal Reserve raised the cost of
borrowing by 25 basis points (to within the 1.75%-2.00% range) and eliminated its forward guidance.
The central bank remains committed to gradual increases in interest rates, although according to
the so-called dot plot, there should be 4, and no longer 3, rate rises in 2018, despite the fact that the
target range remains 3.00%-3.25%. At the same time, having eliminated forward guidance, the
Federal Reserve may consider itself free to raise rates as it wishes, based solely on macroeconomic
data.
Eurozone growth continues apace, despite macroeconomic data pointing to a slowdown in both
exports and a number of different variables (e.g. climatic factors or strikes). At the moment, the
slowdown is not expected to bring a halt to the current growth phase, but downside risks are
increasing as a result of international tensions and the US’s growing appetite for protectionist
policies. The rise in the oil price has driven up inflation, which is up from 1.4% at the end of 2017 to
2.0% in June 2018, but a lasting, sustained increase in consumer prices is likely to also lead to a
rise in core inflation. Against this backdrop, as widely expected, at its June meeting, the ECB left
interest rates unchanged and announced the end of its asset purchase programme (APP) at the end
of the year, although the central bank intends to continue to reinvest the proceeds after this date.
The ECB specified that interest rates will remain at current levels at least until the end of summer
2019, whilst it intends to halve its purchases from €30 to €15 billion a month between October and
the end of the year.
Among the BRIC economies (Brazil, Russia, India and China), economic growth in India remains
robust, whilst the slowdown in China is continuing. Brazil and Russia, which have both come out of
recession, have seen ongoing improvements in their economic prospects, though growth remains
weak.
Financial market trends
At the end of the second quarter of 2018, the year yields on ten-year US and German government
bonds stood at 2.86% and 0.30%, respectively, compared with 2.40% and 0.42% at the beginning
of the year.
In Europe, the decline in yields primarily reflects the absence of significant inflationary pressures
and the gradual normalisation of the ECB’s monetary policy within the context of albeit slowing
expansion. In the US, the return of the yield to above 3%, in May, reflects the strengthening
economic cycle and fears that the Federal Reserve may accelerate interest rate rises.
9
Consolidated Interim Report 2018Financial Office
At the same date, the yield on 10-year Italian Treasury Notes (BTPs) stood at 2.68%, compared with
2.01% at the end of 2017. In the same period, the spread with respect to ten-year German
government bonds rose from 158 to 237 basis points. The yields on Italian debt are subject to the
uncertainty surrounding the new government’s policies which, in June, led the yield on ten-year
bonds to rise to above 3.10%.
The Poste Vita Group is monitoring the operational and financial impact of any further increase in
the spread. Furthermore, the parent, Poste Italiane, has given a commitment to inject fresh capital
into Poste Vita should the solvency ratio fall below 130%.
Euro-denominated investment grade corporate bonds has continued to benefit from purchases by
the ECB and the widespread improvement in the macroeconomic environment. As a result of the
increase in free-risk rates, the average yield on BBB-rated investment grade issues has risen from
1.05% at the beginning of the year to 1.20%.
Global equity markets have not performed particularly well since the start of the year: the MSCI
World Index is down 0.7%, the S&P 500 up 1.7%% and the Eurostoxx 50 down 3.09%. Falls in
emerging stock markets have been even sharper, with an overall decline of 7.6%. Fears that the
Federal Reserve could accelerate interest rate rises and concerns over a number of technology
stocks (impacting equity markets in the first quarter) have now been joined by fears of the effects on
global economic growth of the US government’s protectionist leanings.
On the foreign exchange markets, the euro has fallen 2.5% against the US dollar.
Life insurance market
Based on the available official data (source: ANIA), new business for Life insurance policies at 31
May 2018 amounts to €36.4 billion (up 3.8% on the same period of the previous year). If new Life
business reported by EU insurers is taken into account, the figure rises to €43.1 billion, substantially
in line (up 0.2%) with the same period of 2017. Analysing the composition and performance of new
business, Class I premiums amount to €23.3 billion, up 2.2% compared with the same period of the
previous year, whilst new business for Class V policies has also performed well, with premium
revenue rising 6.3% to €0.7 billion. New business for unit-linked Class III Life products has seen
strong growth in the first five months of the year, rising 6.8% compared with the same period of 2017
to €12.3 billion. Sales of long-term care products (Class IV) have also performed well, with premium
revenue, albeit modest, rising more than 56% compared with the same period of 2017 to €7 million.
New business and contributions relating to individual pension plans are slightly up (0.9%) at the end
of May 2018 compared with the same period of 2017, reaching a total of €0.5 billion since the
beginning of the year.
10
Consolidated Interim Report 2018Financial Office
With regard, finally, to distribution channel, over 70% of new business was obtained through banks
and post offices, with premium revenue of €26.0 billion up 7.0% compared with the first five months
of 2017. In terms of agents as a whole, the volume of new business amounted to €5.0 billion in the
first five months of 2018, marking growth of 2.4% compared with the same period of 2017.
The performance of new business obtained through authorised financial advisors was, on the other
hand, negative, with premium revenue of €5.2 billion marking a decline of 9.2% compared with the
figure for the same period of 2017.
Single premiums continued to be the preferred form of payment for policyholders, representing 94%
of total premiums written and 60% of policies by number.
Non-life insurance market
Based on the available official data (source: ANIA), total direct Italian premiums in the Non-life
insurance market, thus including policies sold by Italian and overseas insurers, amounted to €9.1
billion at the end of the first quarter of 2018, slightly up on the same period of 2017 (an increase of
11
Consolidated Interim Report 2018Financial Office
1.7%). This marks the fourth consecutive quarter reversing the negative trend seen over the last five
years. The performance was helped by both the slight increase in premium revenue from vehicle
insurance and further growth in other Non-life classes.
In detail, third-party land vehicle premiums amount to €3.4 billion, down 0.2% on the first quarter of
2017 (when the reduction was 3.5%), whilst land vehicle hull premiums amount to €0.8 billion, up
6.8% on the same period of the previous year. Other classes have continued the positive trend of
recent quarters, with premium revenue of over €4.8 billion in the first quarter of 2018, an increase
of 2.1%.
Other classes, in terms of volumes and growth rate, include general third-party liability insurance,
with premium revenue of €1.0 billion up 4.5%, medical, with premiums of €0.7 billion (up 3.2%), and
other property insurance, with premiums of €0.7 billion (up 2.9%).
In terms of distribution channel, as regards policies sold by Italian and overseas insurers, agents
continue to lead the way with a market share of 75.2%, slightly down on the figure for the end of the
first quarter of 2017 (75.8%). Brokers represent the second most popular channel for Non-life
products, with a market share of 8.8%, whilst the market share of banks and post offices is in line
with the same period of 2017 at 6.4%. Direct sales accounted for 9.3% of the market at the end of
the first quarter of 2018, up compared with the first quarter of 2017 (8.9%)
12
Consolidated Interim Report 2018Financial Office
OPERATING REVIEW
Premium revenue, net of outward reinsurance premiums, totalling approximately €8.8 billion, is
down 20% compared with the €11.1 billion of the same period of 2017. The table below breaks down
net premium revenue by type of business compared with the same period of 2017.
(€m)
Premium revenue
2018 2017 Increase/(decrease)
for the six months ended 30 June
Class I 8,333.1 10,763.2 (2,430.1) (22.6%)
Class III 416.3 232.0 184.3 79.4%
Class IV 15.4 14.4 1.1 7%
Class V 55.7 48.2 7.5 15.6%
Gross "Life" premium revenue 8,820.5 11,057.8 (2,237.3) (20.2%)
Outward reinsurance premiums (6.7) (8.9) 2.2 (24.8%)
Net "Life" premium revenue 8,813.8 11,048.9 (2,235.1) (20.2%)
Non-life premiums 96.4 73.3 23.1 31.5%
Outward reinsurance premiums (20.0) (18.1) (1.9) 10.3%
Change in premium reserve (14.8) (8.6) (6.2) 72.6%
Change in share of premium reserve attributable to
reinsurers 0.1 2.4 (2.3) (96.2%)
Net "Non-life" premium revenue 61.7 49.0 12.7 26.0%
Total net premium revenue for the period 8,875.5 11,097.9 (2,222.3) (20.0%)
Life business
Life business operations were aimed almost exclusively at the marketing of Class I and V
investment and savings products (traditional separately managed accounts), with total premium
revenue of approximately €8.4 billion (€10.8 billion in the same period of 2017). Total revenue from
the sale of Class III products rose but remained marginal at €0.4 billion (€0.2 billion in the first half
of 2017).
13
Consolidated Interim Report 2018Financial Office
The following table shows a summary of premium revenue for the period by class, net of outward
reinsurance premiums:
(€m)
Premium revenue
2018 2017 Increase/(decrease)
for the six months ended 30 June
Class I 8,333.1 10,763.2 (2,430.1) (22.6%)
Class III 416.3 232.0 184.3 79.4%
Class IV 15.4 14.4 1.1 7%
Class V 55.7 48.2 7.5 15.6%
Gross "Life" premium revenue 8,820.5 11,057.8 (2,237.3) (20.2%)
Outward reinsurance premiums (6.7) (8.9) 2.2 (24.8%)
Net "Life" premium revenue 8,813.8 11,048.9 (2,235.1) (20.2%)
The following table shows a breakdown of gross premium revenue for the Life business:
(€m)
Breakdown of gross premium revenue for
the life business for the six months 2018 2017 Increase/(decrease)
ended 30 June
Regular premiums 1,039.7 1,042.5 (2.7) (0.3%)
- of which first year 182.40 273.6 (91.2) (33.3%)
- of which subsequent years 857.34 768.8 88.5 11.5%
Single premiums 7,780.8 10,015.3 (2,234.5) (22.3%)
Total 8,820.5 11,057.8 (2,237.3) (20.2%)
Sales of regular premium products also performed well (Multiutile Ricorrente, Long Term Care, Posta
Futuro Da Grande), with over 34 thousand policies sold during the period, as did sales of the
PostaPrevidenzaValore product which, with more than 29 thousand policies sold during the period
and a total number of members amounting to 966 thousand, has enabled the Company to
consolidate its leadership in the pensions market.
Sales of pure risk policies (term life insurance), sold in stand-alone versions1, recorded sales of over
93 thousand new policies during the period, whilst the number of new policies, again of a pure risk
nature, sold bundled together with financial obligations deriving from mortgages and loans sold
through Poste Italiane’s network totalled approximately 44.3 thousand.
Non-life business
During the period, the Non-life business continued with specific marketing and commercial initiatives
aimed at improving the health and protection product offering, including a review and expansion of
the cover provided and the launch of discounts on existing products.
The collective welfare products launched last year continued to record growth during the first half,
with revenue rising approximately €10.1 million.
Sales of goods and property protection policies also grew, rising 14% compared with the figure for
the first half of 2017. This reflects the launch of the new Posteprotezione Innova Casa Più product
(replaced, from 25 June 2018, by Poste Casa 360). As a result of the above, gross premium revenue
for the first half of 2018 totals approximately €96.4 million, up 32% on the same period of the previous
year.
1
not bundled together with products of a financial nature.
14
Consolidated Interim Report 2018Financial Office
(€m)
Gross premium revenue Increase/
for the six months ended 30 June 2018 % share 2017 % share % inc./(dec.)
(decrease)
Goods and property 18.3 19% 16.1 22% 2.2 14%
Personal insurance 40.5 42% 36.8 50% 3.7 10%
Credit protection 23.3 24% 16.2 22% 7.1 44%
Welfare and other management 14.3 15% 4.2 6% 10.1 239%
Total 96.4 100% 73.3 100% 23.1 32%
The following table shows the distribution of gross Non-life premium revenue by line of business,
showing: i) the pre-eminence of Accident insurance, accounting for 40%; ii) growth of approximately
70% in Medical insurance compared with the first half of 2017, after the above-mentioned increase
in revenue generated by the Employee Benefits business; and iii) growth in financial loss policies
due, as noted previously, to an increase in revenue from payment protection insurance.
(€m)
Gross premium revenue Increase/
2018 % share 2017 % share % inc./(dec.)
for the six months ended 30 June (decrease)
Accident 39.0 40% 33.2 45% 5.7 17%
Medical 23.1 24% 13.6 19% 9.5 70%
Fire and Natural Disaster 3.1 3% 2.8 4% 0.3 10%
Other Damage to Property 4.6 5% 3.9 5% 0.7 19%
General Liability 8.7 9% 7.7 10% 1.0 13%
Financial Loss 11.2 12% 5.8 8% 5.4 93%
Legal Expenses 1.5 2% 1.4 2% 0.0 3%
Assistance 5.3 6% 4.9 7% 0.5 9%
Total 96.4 100% 73.3 100% 23.1 32%
Payments and change in technical provisions
Claims paid during the first half of 2018 total €3,974.4 million, compared with €5,149.6 million in the
same period of the previous year, as shown below:
(€m)
Payments
2018 2017 Increase/(decrease)
in the six months ended 30 June
Non-life business
Claims paid 14.9 10.7 4.2 38.9%
Costs of settling claims 2.5 1.3 1.3 102.5%
Total Non-life claims paid 17.5 12.0 5.5 45.6%
Life business
Amounts paid 3,951.3 5,129.8 (1,178.5) (23.0%)
of which:
Surrenders 1,728.2 1,540.5 187.7 12.2%
Maturities 1,454.8 2,933.8 (1,479.0) (50.4%)
Claims 768.3 655.5 112.8 17.2%
Costs of settling claims 5.7 7.8 (2.1) (27.5%)
Total Life claims paid 3,956.9 5,137.6 (1,180.7) (23.0%)
Total 3,974.4 5,149.6 (1,175.2) (22.8%)
Total claims paid on Non-life policies amount to €17.5 million, including settlement and direct costs
of €2.2 million, up 45.6% on the figure for the first half of 2017 (€12 million). This reflects the growth
in premium revenue.
Total claims paid on Life policies amount to €3,956.9 million, down on the €5,137.6 million of the
same period of 2017. The reduction is primarily due to a decrease of approximately €1,479 million
in expirations during the first half of 2018.
15
Consolidated Interim Report 2018Financial Office
The change in technical provisions, totalling €5,123.9 million, is down on the €7.044.5 million
recorded at 30 June 2017. This primarily reflects a matching increase in insurance liabilities,
reflecting the above-mentioned operating performance. The decrease in mathematical provisions
for class I, IV and V products, compared with the figure for the first half of 2017, primarily reflects
the reduction in premium revenue. The figure also includes the reduction in Deferred Policyholder
Liability (DPL) provisions, amounting to €673.4 million (an increase of €240 million at 30 June 2017),
linked to the measurement of securities included in separately managed accounts and classified as
FVTPL. The decrease of €312.4 million in mathematical provisions for Class III policies during the
period primarily reflects financial market volatility.
(€m)
Change in technical provisions
2018 2017 Increase/(decrease)
in the six months ended 30 June
Non-life technical provisions 5.6 8.3 (2.7) (32.5%)
Mathematical provisions for Class I, IV and V 6,097.6 7,729.9 (1,632.3) (21.1%)
Mathematical provisions Class III (312.4) (939.4) 627.1 (66.7%)
DPL provisions (673.4) 240.0 (913.4) (380.6%)
Other technical provisions 6.5 5.8 0.7 12.3%
Total Life technical provisions 5,118.3 7,036.3 (1,917.9) (27.3%)
Total 5,123.9 7,044.5 (1,920.6) (27.3%)
With reference to policies ceded to reinsurers, claims paid in the period under review, inclusive of
the change in technical provisions, amount to €12.4 million, down on the €14.4 million of the same
period of 2017, as shown below:
(€m)
Claims expenses attributable to
reinsurers 2018 2017 Increase/(decrease)
in the six months ended 30 June
Non-life business
Claims paid 4.3 3.4 0.9 28.0%
Settlement costs 0.2 0.1 0.1 61.4%
Total Non-life insurance claims paid 4.5 3.5 1.0 29.0%
Change in technical provisions 4.1 2.6 1.5 57.4%
Total non-life insurance 8.6 6.1 2.5 41.1%
Life business
Claims paid 3.3 3.8 (0.5) (13.4%)
Settlement costs 0.0 0.0 0.0 0.0%
Total Life insurance claims paid 3.3 3.8 (0.5) (13.4%)
Change in technical provisions 0.5 4.5 (4.0) (88.3%)
Total life insurance 3.9 8.3 (4.5) (53.8%)
Total 12.4 14.4 (2.0) (13.8%)
Technical provisions
As a result of the above operating and financial performance, technical provisions amount to
€124,581 million, slightly up on the €123,650.6 million of the end of 2017. The provisions are
allocated as follows:
16
Consolidated Interim Report 2018Financial Office
(€m)
Technical provisions
2018 2017 Increase/(decrease)
at 30 June
Non-life classes:
Premium reserve 79.1 64.3 14.8 23.1%
Outstanding claims provisions 101.5 95.8 5.7 5.9%
Other technical provisions 0.1 0.2 (0.1) (56.7%)
Total non-life classes 180.6 160.2 20.4 12.7%
Life classes:
Mathematical provisions 117,105.1 111,013.1 6,092.0 5.5%
Technical provisions for class III products 3,217.7 3,530.1 (312.4) (8.8%)
Outstanding claims provisions 639.6 631.2 8.4 1.3%
DPL provisions 3,340.4 8,225.0 (4,884.6) (59.4%)
Other technical provisions 97.5 91.0 6.5 7.2%
Total life classes 124,400.4 123,490.4 910.0 0.7%
Total 124,581.0 123,650.6 930.4 0.8%
Provisions for the Life classes amount to €124,400.4 million (€123,490.4 million at the end of 2017).
These provisions are made to meet all of the Company’s obligations and include mathematical
provisions (€117,105.1 million), provisions for unit- and index-linked products (€3,217.7 million),
outstanding claims provisions (€639.6 million), deferred policyholder liability (DPL) provisions made
under the shadow accounting method, totalling €3,340.4 million, and other technical provisions
(€97.5 million). The latter includes provisions for future expenses, totalling €93.9 million, provisions
for supplementary insurance premiums, totalling €2.9 million, and provisions for with-profits policies,
amounting to €0.7 million.
Deferred Policyholder Liability (DPL) provisions, amounting to €3,340.4 million at 30 June 2018, are
down on the figure for the beginning of the year (€8,225.0 million). This reflects a reduction in the
fair value of the financial instruments covering the insurance liabilities linked to separately managed
accounts, as a result of the less positive performance of financial markets compared with the end of
the previous year.
In this regard, it should be noted that for products whose revaluation is linked to the returns on
separately managed accounts, the financial component of technical provisions is determined on the
basis of realised income and expenses, as established by the applicable Italian accounting
standards, without considering unrealised gains and losses. This generates a timing mismatch
between liabilities and the assets designed to back them, which are recognised at fair value, in
accordance with IFRS 9. In order, therefore, to report assets and liabilities intended to match each
other in a consistent manner, the Company has, as in previous years, adopted the “shadow
accounting” method introduced by IFRS 4. The criteria used for shadow accounting purposes are
described in the notes to the financial statements.
Contracts classified as “insurance contracts” and those classified as “financial instruments with a
discretionary participation feature”, for which use is made of the same recognition and measurement
criteria as in Italian GAAP, were subjected to the LAT - Liability Adequacy Test required by
paragraph 15 of IFRS 4. The test was conducted by taking into account the present value of future
cash flows, obtained by projecting the expected cash flows generated by the existing portfolio as of
period end, based on adequate assumptions underlying expiration causes (death, termination,
surrender, reduction) and expense trends.
17
Consolidated Interim Report 2018Financial Office
The outcome of this test revealed that the technical provisions recorded in the balance sheet at the
end of the period were fully adequate.
Non-life technical provisions, before provisions ceded to reinsurers, amount to €180.6 million at the
end of the period (€160.2 million at the end of 2017), and consist of: the premium reserve of €79.1
million, outstanding claims provisions of €101.5 million and other provisions of €0.1 million, relating
solely to the ageing reserve. Outstanding claims provisions for claims incurred but not reported
(IBNR) amount to €21 million. Changes in the premium reserve and outstanding claims provisions
reflect the growth in premium revenue.
Distribution
The Poste Vita Group distributes its products through the post offices of the parent, Poste Italiane
SpA – BancoPosta RFC, duly registered under letter D in the single register of insurance
intermediaries as per ISVAP Regulation 5 of October 16, 2006. The sales network consists of around
13,000 post offices throughout the country. Insurance contracts are signed in the post offices by
qualified and suitably trained personnel.
Training activity for personnel in charge of product sales is conducted according to regulatory
guidelines.
Professional training programmes focus both on new products and on general technical-insurance
aspects (classroom or eLearning). These courses are accompanied by training in asset management
(specific behavioural training), savings protection and training in provision of the guided consultancy
service.
Total commissions paid for distribution, collection and portfolio maintenance services – paid under
a specific agreement with the insurance broker, BancoPosta RFC – Poste Italiane SpA, expiring in
March 2019 – amount to approximately €237.2 million (€258.2 million in the first half of 2017). On
an accruals basis, the amount for the period totals €237.6 million, reflecting the amortisation of
prepaid commissions (€255.8 million at 30 June 2017). The Insurance Group sells its collective
policies through brokers, to which it paid commissions of €4 million during the period (€1.7 million in
the first half of 2017).
Reinsurance strategy
Life business
The effects of existing treaties entered into with leading reinsurers, relating to Term Life Insurance
policies and reinsurance coverage with regard to LTC (Long-Term Care) and CPI insurance,
continued during the period.
Premiums ceded to reinsurers amount to €6.7 million (€8.9 million at 30 June 2017) and include €4.4
million for Class I products and a remaining €2.3 million for Class IV products. The share of claims
expenses attributable to reinsurers, after technical provisions, amounts to €3.9 million (€8.3 million
in the same period of 2017). As a result of this, ceded policies, including commissions received
18
Consolidated Interim Report 2018Financial Office
from reinsurers amounting to €0.8 million (€1.1 million in the first half of 2017) resulted in a loss of
€2.0 million, compared with a positive result of €0.5 million for the same period of 2017).
Non-life business
The Board of Directors approved Guidelines applicable to passive reinsurance arrangements on 14
December 2016 (subsequently modified and approved by the Board of Directors on 7 December
2017) and, at its meeting of 13 February 2018, agreed the Reinsurance Plan for the current year,
prepared in accordance with existing regulations (IVASS Circular 574/D). Briefly, the reinsurance
structure applied in 2018, in accordance with the Guidelines and the Reinsurance Plan, is based on
the following:
• retention of 100% of gross premium revenue in the Accident class for retail products, with
reference to new business, in addition to the adoption of excess-of-loss treaties for personal
(Accident) insurance due to risk and/or event to hedge against large losses. Quota share
treaties continue to be valid in relation to the principal risks insured prior to 2013. These
arrangements provide risk attaching coverage, with 50% of any losses covered. In this latter
case, the excess-of-loss treaty for Accident policies covers the retained share;
• retention of 50% of the risk exposure for retail Medical products. The reinsurance strategy,
applicable to the risks underlying policies in run-off, continues in the form of a quota share
treaty with the ceded percentage based on pure premiums and providing risk attaching
coverage. The same quota share reinsurance structure applies to all the risks attaching to new
business and underlying the other products sold, but with retrocession of a flat commission
and on a loss occurring basis;
• confirmation of the preference given to “bouquet, multi-line” reinsurance for Property and
Liability products: proportional treaty bases on reinsurance cession in the Fire, Other Damage
to Property, General Liability and Financial Loss classes, maintaining the commissions paid
by reinsurers based on underwriting results, in addition to the adoption of excess-of-loss
treaties per risk and/or event to protect against large losses;
• a reduction of the proportion of risks ceded in the Fire and Other Damage to Property and
Financial Loss classes to 25%, in line with the approach for the General Liability class,
excluding professional liability, which has been held at 90%;
• a reduction of the proportion of risks ceded to 55% and a further increase in reinsurance
commissions (fixed commission + profit-sharing) for all Assistance policies written at 31
December 2017 and new policies in 2018;
• a reduction of the proportion of risks ceded to 50% and a further increase in reinsurance
commissions (fixed commission + profit-sharing) for all Legal Expenses policies written at 31
December 2017 and new policies in 2018;
• the termination of treaties covering CPI products with effect from 1 January 2018. For the risks
linked to the runoff credit protection policies, the reinsurance policy continues in the form of a
quota share treaty with a ceded percentage of 50%. The cession rate continues to be based
on pure premiums, providing risk attaching coverage;
19
Consolidated Interim Report 2018Financial Office
• adoption of a treaty covering the main standard collective, closed-group corporate accident
policies. This reinsurance structure has a loss occurring basis and is based on a quota share
treaty with commercial premiums, with a cession rate of 50% and sliding-scale reinsurance
commissions depending on the loss ratio, and an excess-of-loss treaty covering the retained
share, extended to cover all Class 1 corporate policies, including non-standard ones;
• confirmation of an 80% quota share treaty for corporate medical risks and regarding the Open
Medical Scheme, with a cession rate based on gross premium revenue, a flat reinsurance
commission and with coverage provided on a risk attaching basis. In addition, a Stop Loss
treaty has been introduced to cover Class 2 corporate policies, having a single layer providing
coverage of up to 150%;
• use of optional and/or special acceptance reinsurance treaties, primarily in cases where the
risk is not covered by the existing reinsurance treaty. This approach applies particularly to risks
that do not meet the qualitative and quantitative criteria provided for in existing reinsurance
treaties, but which Poste Assicura is normally willing to insure against, primarily corporate
accident or medical policies. The entity of the risk retained by Poste Assicura and the most
appropriate reinsurance structure are decided on, from time to time, based on the nature of
the risk involved.
In keeping with existing reinsurance guidelines, in the first half of 2018, a number of changes were
made with respect to the Reinsurance Plan agreed at the Board of Directors’ meeting of 13 February
2018, following the signature of new reinsurance treaties.
The changes regard the section relating to reinsurance by treaty and are as follows:
• adoption of a treaty covering the RSM risk associated with corporate medical policies for the
employees of associate companies forming part of the Poste Italiane Group. The reinsurance
structure has a loss occurring basis and is based on a quota share treaty with commercial
premiums, with a cession rate of 80% and a flat reinsurance commission for the first year and
sliding-scale reinsurance commissions depending on the loss ratio for the second year;
• an addition to the “bouquet multiline” reinsurance agreement for property and liability
insurance for new catastrophe policies: a proportionate treaty with a cession rate based on
pure premiums and excess-of-loss cover, with an additional top layer for catastrophe events.
In view of the above reinsurance strategy and the operating performance, the degree of retained
risk, in relation to the company’s remaining exposure to claims following cessions to reinsurers, is
equal to 63%, compared with 70% at the end of the first half of 2017.
The ratio of ceded premiums at the end of the period to gross premiums written is 21%, down
compared with the figure for 30 June 2017 (25%).
Given the more than proportionate increase in premium revenue with respect to claims during the
period, ceded policies report a loss of approximately €3.5 million, slightly worse (€0.4 million) than
the loss of €3.1 million recorded in the same period of 2017.
Complaints
20
Consolidated Interim Report 2018Financial Office
The Parent Company, Poste Vita, received 650 new complaints during the first half of 2018,
compared with 819 in the first half of 2017. The average time taken to respond to complaints in the
first six months of 2018 was around 13 days (15 days in the same period of 2017). The Company
received 184 complaints regarding its Personal Injury Protection (PIP) product in the first half of
2018, compared with 273 received in the first half of 2017. The average time taken to respond to
complaints during the period was around 14 days (15 days in the same period of 2017).
The subsidiary, Poste Assicura, received 570 new complaints in the same period (315 in the first half
of 2017). The average time taken to respond to complaints in the first six months of 2018 was around
17 days (16 days in the same period of 2017), well within the 45-day time limit set by IVASS.
21
Consolidated Interim Report 2018Financial Office
FINANCIAL POSITION
Financial investments
Financial investments amount to €126,422.7 million at 30 June 2018, broadly in line with the
€125,917 million of the end of 2017 and reflecting the operating performance and financial market
trends.
(€m)
At 30 June 2018
At 31 December 2017 Increase/(decrease)
Investments in associates 107.1 106.8 0.3 0.3%
1,418.0
Financial assets measured at amortised cost 1,418.0 n.s
Financial assets at fair value through OCI 94,801.9 96,078.9 (1,277.0) (1.3%)
Financial assets at fair value through profit or loss 30,095.8 29,731.3 364.4 1.2%
Total financial investments 126,422.7 125,917.0 505.7 0.4%
Investments of €107.1 million refer to the shareholding in the associate, EGI, which is accounted
for using the equity method. The company, which is owned by Poste Vita SpA and Poste Italiane
SpA with 45% and 55% equity interests, respectively, operates primarily in real estate and is tasked
with the management and development of the parent’s non-operating properties. The figures for the
first half of 2018 show that the company has equity of €237.9 million and made a net profit of
approximately €0.7 million, down on the €0.9 million reported for the first half of 2017.
Financial assets measured at amortised cost, bring financial assets held to collect the contractual
cash flows represented solely payments of principal and interest, amount to €1,418 million at the
end of the period (before IFRS 9 become effective, these assets were classified as available-for-
sale) and primarily regard the Company’s free capital.
Financial assets measured at FVTOCI amount to approximately €94.8 billion (€96.1 million at 31
December 2017) relate to securities allocated to separately managed accounts (approximately €92.7
billion) and a residual portion attributable to the Company’s free capital (approximately €2.1 billion).
(€m)
At 30 June 2018 At 31 December 2017 Increase/(decrease)
Equity instruments - 18.3 (18.3) (100.0%)
Debt securities 94,801.9 94,708.6 93.3 0.1%
of which: government bonds 78,100.1 81,313.7 (3,213.6) (4.0%)
corporate bonds 16,701.8 13,394.9 3,306.9 24.7%
UCITS units - 1,352.0 (1,352.0) (100.0%)
Total 94,801.9 96,078.9 (1,277.0) (1.3%)
22
Consolidated Interim Report 2018Financial Office
The less positive performance of the financial markets during the period is reflected in a reduction in
the fair value reserve for these instruments, which amounts to €3,811 million in potential gains
(€8,089.6 million at the end of 2017), including: i) €3,820.9 million attributable to policyholders
through the shadow accounting mechanism, as they relate to financial instruments included in
separately managed accounts, and ii) €9.9 million relating to net losses on FVOCI financial assets
included in the Company’s free capital and, therefore, attributable to a specific equity reserve (equal
to €6.9 million, net of the related taxation).
Financial assets at fair value through profit or loss (FVTPL) amount to approximately €30.1
billion (€29.7 billion at 31 December 2017) and regard:
• investments included in the Company’s separately managed accounts, amounting to €26.0
billion, of which: i) approximately €24.4 billion invested in multi-asset, harmonised open-end
funds of the UCITS (Undertakings for Collective Investment in Transferable Securities) type;
ii) approximately €1.7 billion in callable bonds; and iii) €0.6 billion in real estate funds;
• financial instruments backing unit- and index-linked policies, totalling €3.2 billion;
• financial receivables of €0.2 billion relating to amounts due from mutual investment funds
in the form of units subscribed for and yet to be called up at the end of the period.
The composition of the FVTPL portfolio is shown below, indicating, on the one hand, the increase in
investments in UCITS units as a result of new investments in multi-asset, harmonised open-end
funds of the UCITS type and, on the other, the reduction in the fair value of debt securities due to
negative market trends.
(€m)
At 30 June 2018 At 31 December 2017 Increase/(decrease)
Equity instruments 117.7 57.2 60.5 105.8%
Debt securities 2,202.9 6,767.3 (4,564.4) (67.4%)
of which: government bonds 1,525.3 2,152.0 (626.8) (29.1%)
corporate bonds 677.6 4,615.2 (3,937.6) (85.3%)
UCITS units 27,427.2 22,513.6 4,913.6 21.8%
Derivatives 135.1 183.7 (48.7) (26.5%)
Receivables 213.0 209.5 3.4 1.6%
Total 30,095.8 29,731.3 364.4 1.2%
As shown in the table below, the performance of the financial markets resulted in the recognition of
net unrealised losses of €684.1 million (relating almost entirely to multi-asset, harmonised open-end
funds of the UCITS type), compared with net gains of €314.9 million recognised in the same period
of 2017, including: i) €669.6 million in net losses on investments included in separately managed
accounts and therefore entirely attributable to policyholders through the shadow accounting
mechanism; ii) €14.3 million in net losses relating to assets backing unit and index-linked products,
which are therefore largely offset by the corresponding revaluation of provisions; and iii) net losses
of €0.1 million on securities included in the Company's free capital.
(€m)
At 30 June 2018 At 30 June 2017
Increase/
Net gains/losses Net gains/losses
Income/expenses on FVTPL (decrease)
Separately managed accounts (669.6) 250.5 (920.2)
Assets backing unit-/index-linked policies (14.3) 63.4 (77.8)
Free capital (0.1) 0.9 (1.1)
Total (684.1) 314.9 (999.0)
23
Consolidated Interim Report 2018Financial Office
Regarding derivative transactions, at 30 June 2018 the only derivative instruments held include the
warrants purchased to hedge the indexed component of certain Class III products. The following
table shows the nominal and fair values at 30 June 2018 and the first-half performance for each
product compared with the same period of 2017:
(€m)
Warrants At 30 June 2018 At 31 December 2017 At 30 June 2017
Realised Unrealised Realised Unrealised
Nominal value Fair value Nominal value Fair value
Policy gains/losses gains/losses gains/losses gains/losses
Alba - - - - - - 1.6 -
Terra - - - - - - 1.3 10.7
Quarzo - - - - - - 1.2 11.0
Titanium - - 8.0 - 621 45 0.9 8.4
Arco 165 33 - (0.6) 165 34 0.5 5.1
Prisma 166 30 - 0.2 166 29 0.4 3.8
6Speciale 200 0 - - 200 0 - -
6Aavanti 200 0 - - 200 0 - -
6Sereno 173 17 - (0.5) 173 18 0.2 2.4
Primula 176 16 - (0.7) 176 17 0.2 2.1
Top5 224 17 - (1.1) 224 18 0.2 2.6
Top5 edizione II 226 21 - (1.3) 226 23 0.3 3.4
Total 1,529 135 8.0 (4.0) 2,149 184 6.8 49.5
The composition of the portfolio according to issuing country is in line with the situation in 2017,
being marked by a strong prevalence of Italian government bonds, accounting for 67.1% of the total.
€m
Country FVTPL FVOCI Amortised cost TOTAL % weighting
AUSTRALIA 26 406 432 0.3%
AUSTRIA 54 54 0.0%
BELGIUM 10 368 - 378 0.3%
CANADA 72 72 0.1%
DENMARK 1 127 128 0.1%
FINLAND 87 87 0.1%
FRANCE 117 3,142 4 3,263 2.6%
GERMANY 25 594 618 0.5%
JAPAN 22 22 0.0%
IRELAND 213 274 487 0.4%
ITALY 4,382 78,951 1,404 84,737 67.1%
LUXEMBOURG 24,841 282 25,124 19.9%
MEXICO 56 56 0.0%
NORWAY 26 26 0.0%
NEW ZEALAND 3 3 0.0%
NETHERLANDS 55 2,009 2 2,067 1.6%
PORTUGAL 99 99 0.1%
UK 348 1,613 1,961 1.6%
SLOVENIA - - 0.0%
SPAIN 44 3,150 8 3,203 2.5%
SWEDEN 4 316 320 0.3%
SWITZERLAND - 233 233 0.2%
USA 30 2,916 2,946 2.3%
Total 30,096 94,802 1,418 126,316 100.0%
The distribution of the securities portfolio at 30 June 2018 by duration class is shown below:
24
Consolidated Interim Report 2018Financial Office
€m
Duration FVTPL FVOCI Amortised cost
up to 1 3,206 1,929 -
from 1 to 3 600 15,423 180
from 3 to 5 280 21,436 151
from 5 to 7 251 20,239 372
from 7 to 10 646 9,064 258
from 10 to 15 105 11,474 329
from 15 to 20 670 5,329 108
from 20 to 30 18 9,182 20
over 30 24,320 726 -
Total 30,096 94,802 1,418
Returns on Poste Vita’s separately managed accounts, in the specific period under review (from 1
January 2018 to 30 June 2018) are as follows:
Average
Separately managed accounts Gross return invested capital
% rate €m
Posta Valore Più 2.76% 107,948.7
Posta Pensione 3.25% 6,038.1
25
Consolidated Interim Report 2018Financial Office
EQUITY AND SOLVENCY MARGIN
Equity amounts to €3,194.3 million at 30 June 2018, a reduction of €175.1 million compared with the
end of 2017. In this respect, the adoption of IFRS 9 from 1 January 2018 has reduced equity overall
by €143 million. In particular, the reduction in equity primarily reflects (€139.7 million) the
reclassification of securities previously classified as “Available-for-sale” to “Financial assets at
amortised cost”. The reduction is thus due to the loss of unrealised gains on investments included
in the Company’s free capital and previously reflected in movements in the AFS reserves.
A comparison of equity at 30 June 2018 with the figure at 31 December 2017, after adjusting for
IFRS 9, shows a reduction of €32.1 million. This primarily reflects: i) net profit for the period of €251.9
million; ii) the reduction in the valuation reserve for assets classified as FVTOCI, totalling €46 million;
and iii) distribution of retained earnings of €237.8 million to the shareholder, Poste Italiane, in
implementation of the shareholder resolution of 22 June 2018. Changes in equity during the period
are shown below:
Patrimonio netto
Other gains
and losses Net profit
Effects of IFRS 9 Appropriation Distribution of
Equity at 1 FVTOCI recognised for first
(€m) At 31 December 2017 transition at 1 of net profit for retained ECL reserve At 30 June 2018
January 2018 reserve directly half of
January 2018 2017 earnings
through 2018
equity
1,216.6 1,216.6
Share capital 1,216.6
Revenue reserves and other equity
1,427.7 (3.3) 1,424.4
reserves: 1,732.8
Legal reserve 120.5 120.5 21.8 142.3
Extraordinary reserve 0.6 0.6 0.6
Organisation fund 2.6 2.6 2.6
Negative goodwill 0.4 0.4 0.4
Retained earnings 1,303.6 (3.3) 1,300.3 524.4 (237.8) 1,586.9
of which Retained earnings 1,303.6 1,303.6 (237.8) 1,065.8
of which FTA reserve (3.3) (3.3) (3.3)
Reserve for FVTOCI financial assets 178.9 (139.7) 39.2 (0.2) (46.0) (7.0)
of which AFS/FVTOCI reserve 178.9 (140.7) 38.2 (46.0) (7.7)
of which ECL reserve 1.0 1.0 (0.2) 0.8
Other gains and losses recognised directly
(0.1) (0.1) 0.0 (0.1)
through equity
Net profit 546.2 546.2 (546.2) 251.9 251.9
Total 3,369.4 (143.0) 3,226.4 (0.0) (237.8) (0.2) (46.0) 0.0 251.9 3,194.3
In addition, the subordinated debt issued at 30 June 2018 amounts to €1,000 million (€1,000 million
at 31 December 2017), including:
• €250 million in loan notes placed with the parent and having an undefined maturity;
• €750 million in subordinated bonds issued by the Parent Company, Poste Vita.
All the debt pays a market rate of return and is governed by article 45, section IV, sub-section III of
Legislative Decree 209 of 7 September 2005, as amended. The debt qualifies in full for inclusion in
the solvency margin.
With regard to the Poste Vita Insurance Group’s solvency margin at 30 June 2018, own funds
qualifying for inclusion total €7,306 million, down €1,216 million compared with €8,522 million at the
end of 2017.
In contrast, capital requirements rose significantly in the first half, increasing by approximately €896
million (from €3,050 million at the end of 2017 to €3,946 million at 30 June 2018).
The reduction in the solvency ratio primarily reflects financial market trends which, from May 2018,
have had a negative impact on the fair value of the financial assets held by the Company. In addition,
the increase in the spread, together with the increase in premium revenue, has caused a sharp rise
26
Consolidated Interim Report 2018Financial Office
in capital requirements compared with 31 December 2017, primarily reflecting technical and market
risks.
As a result of the above trends, the Group’s solvency ratio fell sharply in the second quarter 2018
(from 279% at 31 December 2017 to 185% in June 2018), whilst remaining above the regulatory
requirement.
27
Consolidated Interim Report 2018Financial Office
OPERATING RESULTS
The reclassified income statement by type of business for the six months ended 30 June 2018 is
shown below, compared with the same period of 2017:
Life business
RECLASSIFIED INCOME STATEMENT (€m)
for the six months ended 30 June Life business
2018 2017 Increase/(decrease)
Net premium revenue 8,813.8 11,048.9 (2,235.1) (20%)
Gross premium revenue 8,820.5 11,057.8 (2,237.3) (20%)
Outward reinsurance premiums (6.7) (8.9) 2.2 (25%)
Fee and commission income 8.7 4.6 4.1 89%
Net finance income from assets related to traditional products 901.6 1,715.5 (813.9) (47%)
Income 1,415.9 1,367.0 48.9 4%
Realised gains and losses 155.3 97.9 57.4 59%
Unrealised gains and losses (669.6) 250.6 (920.2) (367%)
Net finance income from assets related to index- and unit-linked
69.9 (88.3)
products (18.4) (126%)
Net change in technical provisions (9,071.4) (12,165.6) 3,094.2 (25%)
Claims paid (3,956.9) (5,137.7) 1,180.7 (23%)
Change in technical provisions (5,118.3) (7,036.3) 1,917.9 (27%)
Share attributable to reinsurers 3.9 8.3 (4.5) (54%)
Investment management expenses (22.3) (19.9) (2.4) 12%
Acquisition and administrative costs (265.5) (288.0) 22.5 (8%)
Net commissions and other acquisition costs (223.7) (243.5) 19.9 (8%)
Operating costs (41.8) (44.5) 2.7 (6%)
Other revenues/(costs), net (17.4) (32.3) 14.9 (46%)
GROSS OPERATING PROFIT 329.1 333.1 (3.9) (1%)
Interest expense on subordinated debt (15.1) (13.6) (1.5) 11%
PROFIT BEFORE TAX 357.4 350.0 7.5 2%
Income tax expense (128.8) (129.6) 0.8 (1%)
NET PROFIT 228.6 220.4 8.2 4%
Premium revenue for the first half of 2018, net of outward reinsurance premiums, amounts to
€8,813.8 million, down 20% on the €11,048.9 million of the same period of 2017.
In terms of income from investments, net finance income from securities related to traditional
products in the period totals €901.6 million, down €813.9 million compared with the figure for 2017.
The negative performance of financial markets, linked to the increase in the spread, resulted in net
unrealised losses in the first half of €669.6 million, compared with net unrealised gains of €250.6
million in the same period of 2017. These are, however, net losses on investments included in
separately managed accounts and therefore entirely attributable to policyholders through the
shadow accounting mechanism.
As a result of the impact of financial market volatility, investments linked to index- and unit-linked
products produced net finance costs of approximately €18.4 million in the first half of 2018,
compared with finance income of €69.9 million in the same period of 2017. This amount is almost
entirely matched by a corresponding change in technical provisions.
Fee and commission income from the management of internal funds linked to unit-linked products
amounts to €8.7 million, up €4.1 million compared with the figure for the first half of 2017 (€4.6
million) as a result of the increase in assets under management.
28
Consolidated Interim Report 2018You can also read