Boundary Air Quality Management Plan - October 2008 - City of Grand Forks
←
→
Page content transcription
If your browser does not render page correctly, please read the page content below

Boundary Air Quality Management
              Plan

          Prepared for the Boundary Air Quality Committee

                                          October 2008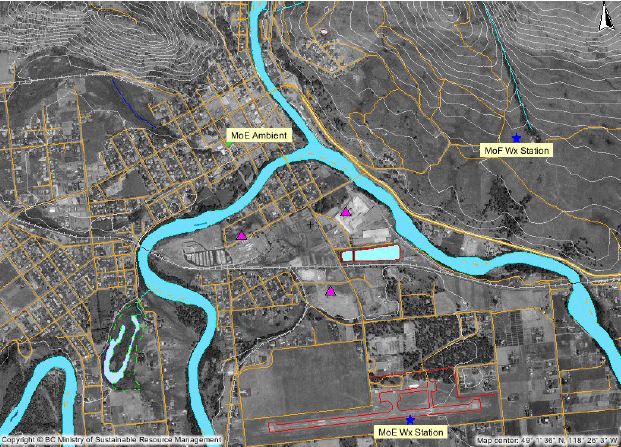
Boundary Air Quality Management Plan

Acknowledgments

The author would like to thank all members of the Boundary Air Quality
Committee for their time and support in developing this air quality management
plan, with special thanks to Paul Willis and Robert Newell of the Ministry of
Environment for pulling together much of the data and analysis, and Chris Moslin
for his tireless efforts in keeping this project on track.

                                                                               2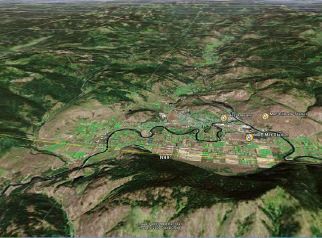
Boundary Air Quality Management Plan

Table of Contents

Acknowledgments ...........................................................................................................2
Table of Contents............................................................................................................3
1.0 Introduction ..............................................................................................................5
        Boundary Air Quality Committee (BAQC) ............................................................6
        Background and Characteristics of the Boundary Region Airshed .......................6
        Air Quality Monitoring ..........................................................................................8
        Sustainable Community Plan...............................................................................8
2.0 Sources of Air Pollutants in the Boundary Airshed....................................................9
3.0 Goals of the Air Quality Management Plan .............................................................12
4.0 A Plan for Action.....................................................................................................14
5.0 Monitoring and Reporting on Progress ...................................................................25
6.0 Review of Plan .......................................................................................................25
7.0 Signatories to Plan .................................................................................................26
Appendix 1: Additional Information on Air Quality in the Boundary Airshed ...................27
Appendix 2: BAQC Stakeholders...................................................................................33
Appendix 3: Summary of Main Pollutants and their Impacts ..........................................34
Appendix 4: Air Quality Standards and Objectives in BC...............................................35
Appendix 5: Glossary of Terms Related to Air Quality Management .............................38
Appendix 6: Glossary of Acronyms................................................................................47

Index of Figures and Tables
Figure 1: Location of the Boundary Airshed.....................................................................5
Figure 2: Boundary Airshed Milestones..............................................................................................6
Figure 3: Monitoring Stations in Grand Forks ..................................................................8
Figure 4: Primary TSP Emissions by Source Type (total = 1259 tonnes)* .....................10
Figure 5: Primary PM2.5 Emissions by Source Type (total = 301 tonnes)*......................11
Figure 6: Primary PM2.5 Emissions by Source Type in Winter (total = 88 tonnes)...........11
Figure 7: Annual 98th Percentile and Means for PM10 ....................................................30
Figure 8: Monthly 98th Percentile and Means for PM10 ...................................................30
Figure 9: Annual 98th Percentile and Means for PM2.5 ...................................................31
Figure 10: Monthly 98th Percentile and Means for PM2.5 ................................................31

Table 1: Main Categories of Emissions ...........................................................................9
Table 2: Goals of Management Plan .............................................................................12
Table 3: Air Quality Actions for the Boundary Region ....................................................14
Table 4: Key Progress Indicators...................................................................................25
Table 5: Grand Forks PM10 Readings 1993-2005 ........................................................27
Table 6: SENES Emissions Inventory – Major Sources.................................................29
Table 7: PM10 Airshed Comparison with Calibrated TEOM Data ...................................32
Table 8: PM2.5 Airshed Comparison with Calibrated TEOM Data...................................32
Table 9: Canada Wide Standards & Ambient Air Quality Objectives for PM ..................35
Table 10: Air Quality Index ............................................................................................37

                                                                                                                                  3
Boundary Air Quality Management Plan
4Boundary Air Quality Management Plan
1.0 Introduction
The Boundary Airshed covers an area within the Boundary Region of
approximately 240 square kilometers including the City of Grand Forks and rural
areas adjacent to the city within “Area D” of the Regional District of Kootenay
Boundary (RDKB). Although the population and activity levels within the airshed
are not particularly high when compared to other airsheds in B.C., the area can
experience relatively high concentrations of particulate matter, especially during
stagnant weather conditions. This creates a human health risk, can degrade
visibility and negatively impact tourism.
Air quality and human health are closely connected. Air pollution can lead to
people taking more medications, visiting their doctor more often, being admitted
to hospital more often, or even dying prematurely, and it has been estimated to
increase BC’s health care costs by $85 million per year.1 Taking action to reduce
particulate levels in the Boundary Airshed can meet multiple objectives around
health, quality of life, climate action and building a more sustainable community.
This plan provides an overview of the Boundary Airshed and summarizes the
goals and actions that support the desire of area residents for healthy air,
sustainability, and high quality of life. Further background information on the
BAQC, air quality monitoring data and trends, past studies, health impacts of
common air pollutants, and BC Air Quality Objectives can be found in the
Appendices to this plan.
Figure 1:
Location of
the
Boundary
Airshed
1
BC Air Action Plan, p.6
5Boundary Air Quality Management Plan
Boundary Air Quality Committee (BAQC)
The Boundary Air Quality Committee (BAQC) was established in February 2006
with the mandate of developing “an air quality management plan that improves
the quality of life and health in the
Boundary Region while sustaining a
viable economic base.”2 The BAQC is an Figure 2: Boundary Airshed
advisory committee to Grand Forks City Milestones
Council, and is made up of
representatives from the City, Regional 1992 PM10 monitoring starts atop City Hall
District, the B.C. Ministry of Environment, 1996 Grand Forks City Council and Area
local industry and community members D representative Basil Jmaiff form
(See Appendix 2 for a complete list of first Air Quality Committee
members). 1996 First public complaint about Cantex
Asphalt Plant Operation
Community engagement has been a 1997 Province’s portable air monitoring
priority for the BAQC, which set up a trailer installed at Councillor
Community Engagement Team (CET) in O’Doherty’s home for six months
its early stages. The CET has assisted 1998 The Reid Report – an intensive
the BAQC in conducting several public year-long air quality study of Grand
meetings in 2006 and 2007, a community Forks
survey on air quality (see Appendix 1), 1999 Creation of the “Pollution Hotline”
and providing ongoing outreach activities. 2002 Friends of the Granby appeal Roxul
All meetings of the BAQC have been permit and are denied
open to the public, and significant efforts 2002 The Adams Report – a foundation
have been made to ensure that the for air quality management
committee is inclusive and representative planning in Grand Forks
of the diversity of stakeholders in the 2005 PM2.5 monitor is installed
region. 2006 Willis Report – a study of fine and
coarse fraction PM in the Boundary
Region
Background and Characteristics of the 2006 Boundary Air Quality Committee is
Boundary Region Airshed formed in February 2006,
community air quality survey
The City of Grand Forks has a population conducted
of approximately 4,159, with an additional 2007 Emissions inventory completed for
3,213 individuals comprising the rural the Boundary Region; new Roxul
population outside of the City and within permit apportions the airshed so
the Boundary Airshed area (BC Statistics, that all industries combined can no
2006). The local economy is based on longer exceed 12 µg/m3 of PM2.5
forestry, agriculture, services, and 2008 TEOM data for PM2.5 available in
tourism. A significant industrial area is in real time; wood stove exchange
relatively close proximity to the downtown, program; idle free ambassador
program; Roxul’s new pollution
abatement system starts operation;
2
See BAQC mandate statement: Grand Forks receives Green City
http://www.city.grandforks.bc.ca/air/ Award at UBCM.
6Boundary Air Quality Management Plan
and a major highway runs through the City.
The predominant landscape of the Boundary Airshed is that of a mountain valley.
This creates a natural ´bowl´ that can limit the movement of air and pollutants
within its boundaries, especially during stagnant weather conditions.
Grand Forks was first identified by the Ministry of Environment as having
elevated particulate matter (PM) levels in the 1990s, and a PM10 monitor was
installed in 1992 to measure coarse fraction particulate levels. Since then,
considerable effort has gone into gaining a better understanding of specific
airshed issues and dynamics. Some key airshed milestones and actions are
outlined in Figure 2.
The Reid Report3, completed in 1998, found that the Grand Forks downtown
area is most affected by elevated levels of PM10. It also determined that wind
speeds in Grand Forks are generally low compared to other communities in BC’s
interior, accordingly pollutants that should dissipate do not, resulting in higher
ambient pollutant concentrations.
The Adams Report4, completed in 2002, found that the levels of inhalable
particulate matter (PM10) in the area are among the highest in the southern
interior and present a concern to public health. Further, the distribution of
particulate matter readings during the days of the week suggested that human
activities play a significant role in the higher readings. Various recommendations
were proposed, including the establishment of respirable particulate matter
(PM2.5) monitoring.
The Willis Report5, completed in 2006, observed a relatively high ratio of fine to
coarse fractions of PM, which led to a recommendation for continuous monitoring
of PM2.5 (fine fraction PM) as being most beneficial for the community. The
report also observed that seasonal wind speeds in the Boundary Airshed follow
the general pattern of the BC interior with higher averages in the summer and
lower averages in the winter (when more stagnant weather patterns preside).
Boundary Airshed has a large percentage (44%) of ‘calms’ (for this analysis,
defined as wind speeds less than 1 m/sec) in the winter season.
Appendix 1 provides a summary of PM10 and PM2.5 air quality monitoring data for
the Boundary Airshed.
3
Peter D. Reid & Steven C. Josefowich, Results of a Year-Long Intensive Air Quality Study in Grand
Forks, British Columbia, February 1998, BC Ministry of Environment.
4
Ralph Adams, Summary of Air Quality in Grand Forks prepared for Grand Forks City Council, 2002, BC
Ministry of Water, Land and Air Protection.
5
Paul Willis, Grand Forks Particulate Matter Analysis and Recommendations, 2006, BC Ministry of
Water, Land and Air Protection.
7Boundary Air Quality Management Plan
Air Quality Monitoring
Grand Forks has had PM10 monitoring since 1992 and PM2.5 monitoring since
2005. Locations of current air quality monitoring and weather stations are shown
in Figure 3 below. Current monitoring equipment is installed atop City Hall and
consists of a TEOM PM2.5 continuous monitor, plus Partisol PM2.5 and PM10
monitors that collect data every sixth day. The Ministry of Environment weather
station is located at the Grand Forks airport.
Figure 3: Monitoring Stations in Grand Forks
Sustainable Community Plan
The City of Grand Forks will be completing its Sustainable Community Plan
(SCP) in 2009, which will serve as its Official Community Plan (OCP). As OCP, it
provides goals, objectives and policies for the City of Grand Forks and sets out
land-use management strategies for the City’s growth. It also delineates policy
by which the City and the public can evaluate development proposals to ensure
manageable and economic growth. The OCP forms the basis for land use bylaws
and capital expenditures and is to be consistent with the City’s waste
management plans, domestic water supply improvement programs, public works
programs and other capital expenditures.
The goals of the SCP and of this AQMP are complementary, and it is fully
expected that implementation of the SCP will help support the goals of this plan.
8Boundary Air Quality Management Plan
2.0 Sources of Air Pollutants in the Boundary Airshed
As per the table below, the main pollutants of concern in the Boundary Airshed
are fine and coarse particulate matter (PM2.5 & PM10). To assist with the
development of appropriate strategies and actions, the following broad
categories of emissions have been identified: smoke, dust, engine emissions
and industrial emissions. Both smoke and dust emissions are made up of
several sub-categories based on source. These source-based sub-categories
are identified in the Action Plan, Table 3.
Table 1: Main Categories of Emissions
Category Main Sources
Dust Roads, construction, agriculture, fugitive dust from
industrial sites
Industrial Emissions Roxul, Interfor (formerly Pope & Talbot), Pacific
Abrasives, Selkirk Paving
Smoke Residential wood heating, backyard burning, open
burning/controlled burning, forest fires
Engine Emissions Vehicles, non-road engines
Depending on the size and nature of the source, air quality concerns can be
highly localized, such as a residence with a smoky woodstove that affects a small
cluster of neighbouring houses, or they can show up at a more general airshed
level - the cumulative impact of many small sources together with larger point
sources. Because of the complex dynamics of pollutants in the airshed,
determining the sources and causes of elevated pollutant levels with any level of
confidence requires considerable study and analysis.
To better understand the relative contributions of emissions from different
sources, SENES Consultants Ltd was commissioned to complete an emissions
inventory in 2006.6 The inventory provided an in-depth snapshot of both
individual and composite emissions for 135 sources in the Boundary Airshed for
six common air contaminants and three greenhouse gases.7
The inventory estimated that 586 tonnes of PM10 and 301 tonnes of PM2.5 were
emitted by Boundary Airshed sources in 2006, with a further 229 tonnes of
secondary PM2.5 formed in the atmosphere as a result of the primary emissions.
Approximately 50 percent of the total suspended particulate emissions (TSP)
came from area dust sources, and 46 percent from industrial sources. For PM2.5,
59 percent was emitted by industrial sources on an annual average basis,
6
Grand Forks Air Emission Inventory for 2006, SENES Consultants Limited, December 2007.
7
Common air contaminants estimated in the inventory: nitrogen oxides (NOx), sulphur dioxides (SOx),
Particulate Matter (as TSP, PM10 and PM2.5), carbon monoxide (CO), volatile organic compounds (VOCs)
and ammonia (NH3). Greenhouse gases were: carbon dioxide (CO2), methane (CH4), and nitrous oxide
N2O.
9Boundary Air Quality Management Plan
decreasing to 41 percent in winter months as area energy sources (primarily
residential wood heating) increased to 22 percent from an annual average of 9
percent. See Figures 4, 5 and 6 below for additional source overview for TSP and
PM2.5. Emissions from the major industrial sources in Grand Forks are
apportioned in such a manner that their combined emissions will not exceed an
ambient contribution of 12 µg/m3 PM2.5.
As an area that experiences elevated levels of both PM10 and PM2.5 within a
complex airshed, the Boundary Airshed will derive further insights on what is
occurring in the local airshed from its planned dispersion modeling study.
Figure 4: Primary TSP Emissions by Source Type (total = 1259 tonnes)8
Roxul Selkirk Paving
Pope & Talbot 0% Area_Agriculture
7% 1%
5%
Pacific Abrasives
1%
Area_Dust
50%
CanPar
33% MOBILE TOTAL
1% Area_Energy
2%
Area_Other
0%
8
Canpar permanently closed its doors in December 2007.
10Boundary Air Quality Management Plan
Figure 5: Primary PM2.5 Emissions by Source Type (total = 301 tonnes)9
Area_Agriculture
3%
Area_Dust
Roxul 24%
25%
Pope & Talbot
11%
Area_Energy
Pacific Abrasives 9%
1% CanPar Area_Other
22% 2%
MOBILE TOTAL
3%
Figure 6: Primary PM2.5 Emissions by Source Type in Winter (total = 88
tonnes)10
Area_Agriculture
0%
Roxul Area_Dust
21% 23%
Pope and Talbot
10%
Pacific Abrasives
1% Area_Energy
Area_Other 22%
Canpar
19% 2%
MOBILE TOTAL
2%
9
See note 8.
10
See Note 8.
11Boundary Air Quality Management Plan
3.0 Goals of the Boundary Air Quality Management Plan
Five overarching goals have been identified to guide the overall framework for
Boundary’s air quality management plan. The goals have been selected to
reflect and communicate key values for air quality management that encompass
the needs and desires of Boundary area stakeholders. The goals are
interconnected and complementary, providing a holistic, community based
approach to air quality management.
Table 2: Goals of Management Plan
Value Goal Statement Description
AIR QUALITY Prevent future The Boundary Airshed has been
deterioration of the identified by the Ministry of the
Boundary Airshed by Environment as a degraded airshed
meeting and due to exceedances of BC Air Quality
exceeding Canada Objectives for particulate matter. The
concept of continuous improvement
Wide Standards and
recognizes that standards and
Provincial air quality objectives are not “pollute up to” limits,
objectives for and further recognizes that where
particulate matter, pollutant concentrations are near
and striving for those limits that efforts to take
continuous remedial and preventative actions to
improvement of air reduce emissions from anthropogenic
quality. sources should be encouraged to the
extent practicable. The Boundary
Airshed may wish to consider adopting
the province’s proposed 8 µg/m3
annual average for PM2.5 as a strategic
goal for air quality in 2009 and beyond.
HUMAN Ensure that citizens Protecting human health is a key
HEALTH and visitors in the driver for improving air quality, as
Boundary Airshed adverse health impacts can be
have healthy air to experienced even when levels of air
pollution are below provincial and
breathe.
national standards. Health effects can
include eye and throat irritation,
breathing difficulties, aggravation of
existing heart and lung conditions,
and, in some cases, premature death.
The elderly, children and those with
existing conditions are at highest risk.
EDUCATION Educate and inform As communities and individuals
AND the community and become more aware of the connection
AWARENESS surrounding areas between air quality and health, positive
on air quality issues, actions to reduce harmful air
especially the emissions follow. The choices people
make can have a significant impact on
12Boundary Air Quality Management Plan
Value Goal Statement Description
connection between local air quality, whether they are daily
air quality and choices around local modes of
health. transportation, more significant
choices like purchasing a new wood
stove, or getting involved in local air
quality management planning.
POLICY Integrate the Air quality can be influenced
INTEGRATION Boundary Airshed’s significantly by local & regional
air quality goals into planning and decision making in
local and regional several key areas, including land use
policies and planning, transportation planning,
waste management, greenhouse gas
planning
management and energy
mechanisms. management. Factoring air quality
needs and impacts into decision
making in these areas will help ensure
protection of the Boundary Airshed
and reduce the likelihood of
unintended consequences. In turn, air
quality actions should not result in
adverse consequences to other parts
of the environment, e.g. land, water,
vegetation or wildlife. Policy integration
supports the principles of Smart
Growth and community sustainability.
SUSTAINABLE Ensure a strong and The mandate of the BAQC is
DEVELOPMENT sustainable local developing an air quality management
economy that has a plan that improves the quality of life
positive impact on and health in the Boundary Airshed
while sustaining a viable economic
air quality.
base. This extends to attracting
businesses and industry that have
minimal impacts on the local airshed,
while balancing the needs of existing
industry. Adoption of a Sustainable
Community Plan by the City of Grand
Forks provides significant support for
this goal.
134.0 A Plan for Action
The following table sets out the main emission categories and categories of actions to improve air quality in the Boundary
Airshed. To provide this composite overview, each BAQC stakeholder was asked to identify air quality actions they are
taking, have recently taken, or are planning to take in the near future. To ensure some consistency in estimates around
potential to improve air quality, stakeholders were given the following guideline:
Low encompasses actions that will not create any noticeable numerical change in monitored air quality, although
may result in local, neighbourhood level improvements (ie. creating a no-idling zone),
Medium encompasses actions that may show some minor improvement in monitored air quality and potentially
significant improvement at a local/neighbourhood level, and
High means that significant volumes of smoke/dust/emissions are being reduced and is strongly expected to result
in statistically significant improvement of monitored air quality for the area.
Table 3: Air Quality Actions for Boundary Region
CATEGORY ACTION COST POTENTIAL YEAR OF CHAMPION(S)/
TO IMPLEMEN- COMMENTS
IMPROVE TATION
AIR
QUALITY
(LOW/MED
/ HIGH)
1. New Works Industry High 2008 Roxul Inc.
Industrial Funding
$13million
Emissions
2. PM emissions assessment Industry No impact 2009 Interfor
Funding
3. Stack emissions regulated Industry High 2009 Ministry of Environment (MoE) and
through Permitting Process by Funding Company with input from City of
MoE Grand ForksBoundary Air Quality Management Plan
CATEGORY ACTION COST POTENTIAL YEAR OF CHAMPION(S)/
TO IMPLEMEN- COMMENTS
IMPROVE TATION
AIR
QUALITY
(LOW/MED
/ HIGH)
4. Install an afterburner on the Industry Medium 2008 Roxul Inc.
melting furnace discharge to Funding
reduce organic odours from
that source
Smoke from 1. Wood stove exchange $45,000 Medium 2008/09 City of Grand Forks, RDKB Area
Residential “D”, Ministry of Environment
Sources 2. Implement Open Burning $1,000 Medium 2009 City of Grand Forks to urge adoption
Bylaw of a bylaw by RDKB. Requires
consultation with MoE & Ministry of
Forests and Range (MoF) to ensure
conformity with Wildfire Regulation
3.Enforcement of bylaw to $10,000 Low 2009 City of Grand Forks
reduce domestic smoke
4. Ban backyard burning in $1,000 Low 2009 City of Grand Forks to urge adoption
residential areas of a bylaw by RDKB.
5. Education and awareness on $5,000 & Medium 2008-2010 City of Grand Forks, BAQC, BC
proper burning and use of In-Kind Lung Association, Local Physicians,
wood stoves RDKB Area “D”
6. Implement Wood Stove $1,000 Low- 2009 City of Grand Forks to adopt a bylaw
Bylaw requiring US EPA or Medium and urge RDKB to adopt a similar
CSA approved stoves to be bylaw.
installed
7. Implement Outdoor Wood- $2,000 Low- 2009 City of Grand Forks to adopt a bylaw
Fired Hydronic Boiler Bylaw Medium and urge RDKB to adopt a similar
bylaw.
15Boundary Air Quality Management Plan
CATEGORY ACTION COST POTENTIAL YEAR OF CHAMPION(S)/
TO IMPLEMEN- COMMENTS
IMPROVE TATION
AIR
QUALITY
(LOW/MED
/ HIGH)
Smoke from 1. Education of farmers to burn $1,000 Low 2009 City of Grand Forks and RDKB Area
Controlled & only when air quality and wind “D” to seek collaboration and support
direction is favourable. of Ministry of Agriculture and Foods
Open burning (MoA) to address agricultural
burning.
2. Implement bylaw for $2,000 Medium 2010 City of Grand Forks to seek support
controlled burning with fines of RDKB Area “D” in favour of bylaw,
and penalties for non- and MoA to help address agricultural
compliance. burning.
3. US and Canada Cooperation $5,000 Medium 2011 City of Grand Forks to seek support
- counties of Washington State and collaboration of Ministry of
and RDKB collaborate on Forests and Lands to address this
education on burning - focus issue.
Forestry and Farming
4. Roll-out new Open Burning 0 High 2009 Ministry of Environment
Smoke Control Regulation
Vehicle & Engine 1. Idle Free Ambassador $40,000 Low-Med 2008 City of Grand Forks and BC Youth
emissions Climate Leadership Alliance
2.Anti – Idling policy for Industry Low 2008-09 Roxul Inc., EmCon, Pacific
company, employee and visitor Funding Abrasives
vehicles
3. Municipal Bylaw on Idling $2,000 Low-Med 2007 City of Grand Forks
4. Upgrade fleet to more fuel Industry Low On-going EmCon
efficient vehicles Funding
16Boundary Air Quality Management Plan
CATEGORY ACTION COST POTENTIAL YEAR OF CHAMPION(S)/
TO IMPLEMEN- COMMENTS
IMPROVE TATION
AIR
QUALITY
(LOW/MED
/ HIGH)
5. “Smart Vehicles” pilot Industry Low 2008 EmCon
Funding
6. Education and awareness on $2,000 Low-Med On-going City of Grand Forks, BAQC, Local
idling and vehicle emissions for Physicians, Ministry of Environment,
general public and truckers Trucking Fleet managers, Ministry of
Transportation and Infrastructure
(MoT), YCLA Climate Action
Facilitator
7. Signage for idle-free zones $1,500 Low 2008 City of Grand Forks, Interior Health
8. Create electrified truck stops Unknown Low 2009-2010 Ministry of Environment
to reduce idling by tractor-
trailers
9. Retrofits for all commercial Unknown Low- 2009 BC Government (see BC Air Action
on-road heavy-duty diesel Medium Plan, Actions #5, 6 & 7)
vehicles, transit buses and
school buses
10. Assess feasibility of Unknown Low-Med if 2010 City of Grand Forks
establishing a truck by-pass by-pass
route using existing roads created
11. Increase use of Industry Low 2008 EmCon
videoconferencing to reduce Funding
vehicle travel
12.Implement a public $150,000 Medium 2009 BC Transit, City of Grand Forks, and
transportation system RDKB
17Boundary Air Quality Management Plan
CATEGORY ACTION COST POTENTIAL YEAR OF CHAMPION(S)/
TO IMPLEMEN- COMMENTS
IMPROVE TATION
AIR
QUALITY
(LOW/MED
/ HIGH)
13. Develop trails and $500,000 Medium 2009-2012 City of Grand Forks. Seek support
walkways from Ministry of Transportation and
Infrastructure.
14. Provide cycle network $500,000 Medium 2009-2012 City of Grand Forks. Seek support
from Ministry of Transportation and
Infrastructure.
15. Conduct assessment of Unknown N/a 2009/10 BAQC
traffic volumes/trends on
Highway 3
Road Dust 1.Removal of sand early in the $15,000 Low- 2008 City of Grand Forks and EmCon
spring using pickup sweeper in (City) Medium
local municipalities
2. Reduce amount of sand on Cost Low- 2008 City of Grand Forks
roads saving Medium
3. Educate public on winter $1,000 Low
driving and alternate 2008 City of Grand Forks
transportation
4. Where feasible and $500,000 Medium 2009-15 City of Grand Forks and Residents
appropriate, reduce dust on
selected road shoulders by
planting grass to the edge of
pavement
5. Install a storm drainage $2 million Medium 2009-20 City of Grand Forks
system and pave
6. Flushing and wetting areas, $52,000 Medium 2009 City of Grand Forks
18Boundary Air Quality Management Plan
CATEGORY ACTION COST POTENTIAL YEAR OF CHAMPION(S)/
TO IMPLEMEN- COMMENTS
IMPROVE TATION
AIR
QUALITY
(LOW/MED
/ HIGH)
application of dust
suppressants in lanes in
residential areas
7. Pave downtown lanes and $500,000 Medium 2009-15 City of Grand Forks
parking lots
8. Sweep and flush parking lots $20,000 Low- 2009 City of Grand Forks
and downtown streets on a Medium
regular schedule
Dust from 1. Establish Development Industry Low- 2009 City of Grand Forks
industrial sites Permit Area regulating Funding Medium
separation barriers to contain
dust within the industrial
operating area and require a
dust management plan.
2. Regular sweeping of the Property Low-
industrial area streets and the Tax-City Medium 2009 City of Grand Forks
surrounding neighbourhood $5,000
3. Reduction of dust from the Industry Low- 2008 Interfor
unpaved areas in the industrial Medium
plant via berming and
regravelling of the log yard
4. Wet down unpaved areas on Industry Low- 2008 Interfor and the City
a sustainable basis and on Medium
schedule
5. Hire city sweeper to pick up Industry Low- 2008 Pacific Abrasives, Interfor, City of
dust and flush paved areas Medium Grand Forks
19Boundary Air Quality Management Plan
CATEGORY ACTION COST POTENTIAL YEAR OF CHAMPION(S)/
TO IMPLEMEN- COMMENTS
IMPROVE TATION
AIR
QUALITY
(LOW/MED
/ HIGH)
6. Require trucks to do regular Industry Low- 2009 Truck Owners, Roxul Inc., Pacific
wash to remove muds, dirt and Medium Abrasives, EmCon and City of Grand
dust Forks
7. Pave industrial yard on a Industry Low- 2009 Interfor
sustainable basis Medium
8. Install cattle guard grate at Industry Low 2009 Pacific Abrasives
the entry and exit gate of plant
to help prevent truck traffic
from dragging slag onto the
street
9. Purchase and use a wet Industry Low- 2008 Roxul Inc.
brush attachment for the Medium
company front end loader to
reduce fugitive dust generated
by vehicle traffic on company
property
10. Fabricate a road watering Industry Low 2008 Roxul Inc.
device to reduce dust
generated by vehicular traffic
on unpaved segments of the
Roxul industrial site.
11. Install a filter system on the Industry Medium 2008 Roxul Inc.
product cooling equipment to
reduce particulate matter
released to atmosphere
20Boundary Air Quality Management Plan
CATEGORY ACTION COST POTENTIAL YEAR OF CHAMPION(S)/
TO IMPLEMEN- COMMENTS
IMPROVE TATION
AIR
QUALITY
(LOW/MED
/ HIGH)
Area Sources of 1.Encourage farmers to wet Farmers Medium 2009-15 City of Grand Forks to seek support
Dust soil or plant as soon as and collaboration of Ministry of
possible to reduce dust from Agriculture and Lands and RDKB to
drying fields address this issue.
2. Plant grass and trees in Property Medium 2009-2020 City of Grand Forks to work with
open areas with moisture owners MoE and RDKB Area “D” to provide
sustaining plants and grass outreach to property owners.
3. Require that construction Property Medium 2009- City of Grand Forks
sites be watered down and owners
streets cleaned at construction
sites.
4. Wet down or apply dust $5,000 Medium 2008 Property owners and City of Grand
suppressants to public and Forks.
gathering areas and have large Property
parking lots of shopping owners
centres flushed on a regular
basis.
5 .Farm lands to plant tree wind Property Medium 2009-2020 City of Grand Forks to seek
barriers to reduce blowing soil owners collaboration with Ministry of
Agriculture, MoE and RDKB to
conduct outreach to farmers.
6. Plant grass and trees and Property Medium 2009-2020 City of Grand Forks to seek
use rock, gravels to reduce and owners collaboration with Ministry of
eliminate erosion and dust. Environment, RDKB, Ministry of
Transportation and Infrastructure to
conduct outreach to property owners
21Boundary Air Quality Management Plan
CATEGORY ACTION COST POTENTIAL YEAR OF CHAMPION(S)/
TO IMPLEMEN- COMMENTS
IMPROVE TATION
AIR
QUALITY
(LOW/MED
/ HIGH)
7. Educate residents and $5,000 High 2009-2010 City of Grand Forks to seek
farmers on the adverse effects collaboration with Ministry of
of erosion and dust and how to Agriculture, MoE and RDKB to
prevent both conduct outreach to farmers.
Air quality 1. Dispersion modeling $50,000 No impact 2009 BAQC and Ministry of Environment
monitoring & 2. Implementation of modeling $50,000 Medium 2010 BAQC and Ministry of Environment
modeling at the field level
3. Installation of 2 cameras to $20,000 No impact 2009 Ministry of Environment, City of
provide time lapsed Grand Forks
photography of the City
4. Remote access capability of $1,200/p/ No impact 2009 City of Grand Forks and Ministry of
photography and data yr Environment
accessibility by MoE
5. PM Data Trends and In-kind No impact 2008 Ministry of Environment
Analysis
6. Fundraising for additional air To be No impact 2008-2012 BAQC to lead fundraising efforts,
quality monitoring stations and deter- with some support from MoE. Goal
modeling with the goal of mined is for PM2.5 Partisol monitor in place
installing a PM2.5 Partisol for 2009/10 and a PM10 TEOM
monitor and PM10 TEOM monitor for 2012.
monitor.
7. Develop strategy and To be No impact 2008-2012 BAQC. Goal is to add up to 3 more
fundraising for installation of deter- stations in the area.
additional meteorological mined
stations
22Boundary Air Quality Management Plan
CATEGORY ACTION COST POTENTIAL YEAR OF CHAMPION(S)/
TO IMPLEMEN- COMMENTS
IMPROVE TATION
AIR
QUALITY
(LOW/MED
/ HIGH)
Education and 1. Ongoing public education in In-kind Low- On-going BAQC, BC Lung Association, Local
Awareness a variety of media/formats Medium Physicians, City of Grand Forks,
about key air quality issues in YCLA Climate Action Facilitator
Grand Forks, including keeping
the BAQC website current
2. Clean Air Day $2,000 Low On-going City of Grand Forks, BC Lung
Association
3. Promote Healthy Built IHA Low 2008 - Interior Health Authority
Environment and Active Living
4. Community air quality survey City of No Impact 2010 City of Grand Forks, RDKB Area “D”
Grand
Forks
Energy Efficiency 1. Energy Assessment of Local Industry Low 2008 EmCon
Yards – improved Funding
weatherization of buildings
2. Use geothermal heating in Industry Low 2008 - Emcon
new construction where Funding
feasible
Coordination 1. Explore feasibility of creating None No impact 2008 City of Grand Forks
part-time air quality
coordination role for City of
Grand Forks
Policy Integration 1. Identify opportunities for City of No Impact 2008 City of Grand Forks, RDKB
integration of air quality Grand
management goals and actions Forks
with land use planning, climate
23Boundary Air Quality Management Plan
CATEGORY ACTION COST POTENTIAL YEAR OF CHAMPION(S)/
TO IMPLEMEN- COMMENTS
IMPROVE TATION
AIR
QUALITY
(LOW/MED
/ HIGH)
action, transportation planning,
and waste management at the
local and regional level
2. Review proposed air quality City of No impact 2008 City of Grand Forks, BAQC
actions, especially those Grand
related to dust control, to Forks
ensure that they do not create
unreasonable adverse impacts
on area water quality.
3. Prepare a Memorandum of In Kind No Impact 2009 City of Grand Forks, RDKB, Ministry
Understanding that outlines of Environment, Interior Health
goals and processes for Authority, Ministry of Forests and
interagency consultation on BAQC.
significant permits, research
projects, etc.
24Boundary Air Quality Management Plan
5.0 Monitoring and Reporting on Progress
The BAQC (or its successor) will review and communicate progress on air quality
actions and activities on an annual basis to Grand Forks City Council, updating
the Action Plan as needed with any new actions or modifications to existing
actions, and providing a report on progress indicators in Table 4. The BAQC will
keep its website up to date and use opportunities such as city newsletters to
report on progress to residents in the airshed. At the same time, citizens with air
quality complaints, concerns or wishing to participate in the plan may continue to
address those concerns to City Council, the BAQC or its successor.
The vision of the BAQC is that this is a “living” plan that gets updated annually at
minimum, with the BAQC as caretaker of the plan. Key information on the plan
and achievement of its milestones will be provided and updated on the City’s
website.
Table 4: Key Progress Indicators
Indicator Frequency of
Measurement
Air quality data and trends in PM10 and PM2.5 as measured by Annual
local monitoring station
Number of air quality complaints/concerns received by City of Annual
Grand Forks
Analysis of air quality-based timelapse photography of Grand Annual
Forks
Number of air quality days that are “Fair” or “Poor” Annual
Number of air quality days that meet proposed BC 24-hour air Annual
quality objective for PM2.5 (8 µg/m3)
Number of actions in AQMP that are “complete” Annual
Number of actions in AQMP that are “In progress” Annual
Number of actions in AQMP that have been “tabled” Annual
Number of new actions initiated not previously listed in AQMP Annual
Number of wood stoves exchanged Annual
Number of hits to BAQC website Annual
Number of media spots on local air quality (print, radio, TV) Annual
Changes in responses to community survey Every 4 years
6.0 Review of Plan
This plan has been prepared as a five year plan, and shall be substantively
reviewed for progress and continued applicability after two years.Boundary Air Quality Management Plan
7.0 Signatories to Plan
We, the undersigned, agree to work together in good faith to achieve the goals
and actions of the Boundary Air Quality Management Plan to the fullest extent
possible.
Signed: Per:
1. ________________________________________ City of Grand Forks
2. ________________________________________ Area “C”, RDKB**
3. ________________________________________ Area “D”, RDKB
4. ________________________________________ Roxul
5. ________________________________________ Interfor
6. ________________________________________ Selkirk Paving**
7. ________________________________________ Pacific Abrasives**
8. ________________________________________ EmCon
9. _______________________________________ Ministry of Environment
10._______________________________________ Ministry of Forests
and Lands**
11. ______________________________________ Interior Health Authority
12. ______________________________________ Ministry of Transportation
and Infrastructure**
13. ______________________________________ Ministry of Agriculture
and Lands**
14. ______________________________________ BC Lung Association
15. ______________________________________ Chamber of Commerce**
16. ______________________________________ Rob Chornenki,
BAQC Member
This plan will be signed and becomes effective on adoption by resolution of the
City Council of Grand Forks.
Note: ** denotes that the signatory has not been confirmed as of 20/10/08.
26Boundary Air Quality Management Plan
Appendix 1: Additional Information on Air Quality in the
Boundary Airshed
According to the Willis Report, PM10 levels have been relatively consistent since
measurement commenced in 1993, showing neither significant degradation nor
improvement. There is some indication that PM10 levels may be trending
downward since 2006, however, it is premature to state this with any statistical
certainty.
Table 5: Grand Forks PM10 Readings 1993-2005
Grand Forks PM10 Readings – 1993 to 2005
Frequency of GOOD
Frequency of POOR
Frequency of VERY
Number of samples
Frequency of FAIR
(µg m day year )
Standard deviation
Data Capture Rate
Health Increments
-1
POOR AQ (%)
25 Percentile
98 Percentile
(µg m )
(µg m )
(µg m )
(µg m )
Median
AQ (%)
AQ (%)
AQ (%)
-3
-3
-3
-3
-3
Year
th
th
(%)
1993 19 26 55 13.6 41 68 49 44 7 0 267
1994 14 18 70 15.0 44 72 64 30 7 0 199
1995 14 22 59 11.4 52 85 60 37 4 0 140
1996 14 19 51 10.3 68 93 72 25 3 0 108
1997 15 23 67 14.2 91 77 57 39 4 0 205
1998 18 25 60 13.6 45 72 51 44 4 0 260
1999 13 22 64 14.7 57 92 60 33 7 0 218
2000 15 23 60 13.3 58 95 62 33 5 0 170
2001 14 21 62 12.8 61 100 62 34 3 0 156
2002 15 22 60 13.1 57 90 63 32 5 0 166
2003 15 24 66 16.0 30 49 53 40 7 0 256
2004 12 21 50 11.1 58 95 67 31 2 0 126
2005 13 22 75 19.1 45 92 57 37 4 2 237
Seasonal biases are evident in Boundary air quality. With the exception of major
‘wildfire years’, the season that sees the highest PM10 loading is winter. This is in
keeping with a fairly typical interior BC pattern which suggests the higher winter
PM levels are a combination of increased emissions from various sectors (e.g.,
road dust, woodstoves, slash burning) coupled with stagnant dispersion
conditions. February and March experience particularly high PM levels because
roads begin to thaw in February/March and large amounts of road dust are
released in these months through vehicular action.
June is a month of relatively low PM. At this time of year the temperature is
warm enough that temperature inversions are broken up during the days,
allowing PM to disperse. In addition, June occurs prior to the summer wildfire
season and before the summer tourism season.
27Boundary Air Quality Management Plan
Sunday PM levels are statistically different and lower than most weekdays, which
may be explained by lower commuter and local traffic levels on that day.
2006 Air Quality Community Survey
As part of the BAQC’s community engagement program, an air quality survey
was mailed to 3100 households in the Boundary airshed area in late 2006. With
a view to creating a baseline assessment on public attitudes and behaviour
around air quality, the survey presented 13 agreement statements to which
respondents were asked to rate their support on a scale of 1 (strong
disagreement) through 4 (strong agreement).
More than 360 surveys were returned and tabulated, identifying five areas of
strong agreement among airshed residents:
• Air quality is a very important issue to me (3.74/4)
• I feel that poor air quality affects the health of my family as well as myself
(3.51/4)
• Industry is responsible for poor air quality (3.45/4)
• Burning clippings and other yard wastes can badly affect local air quality
(3.11/4)
• Municipal bylaws restricting outside burning can help improve air quality
(3.05/4)
Additional information on the survey can be obtained at
www.city.grandforks.bc.ca/air.
Emissions Inventory
To help understand emissions by source and source category, SENES
Consultants Limited (SENES) was commissioned by the City of Grand Forks to
complete a comprehensive emissions inventory of all significant emission
sources in and surrounding the City in 2006. The inventory tracked both
Common Air Contaminants (CACs) and Greenhouse Gases (GHGs) for 135
individual sources.
The inventory is organized into three main source groups:
1. Point sources refer to fixed location large industrial sources that operate
under a discharge permit from the Province. There are five point sources in the
inventory.
2. Mobile sources include all modes of motorized transportation, including motor
vehicles, aircraft, rail, and non-road engines (lawnmowers, chainsaws, tractors,
etc)
3. Area sources include all remaining emission sources which, in many cases,
tend to be widely distributed throughout a community. An example of an area
source is space heating due to combustion of wood.
28Boundary Air Quality Management Plan
Particulate matter from area dust and industry sources comprise the most
significant volume of air emissions for Grand Forks, with winter-time emissions
from woodstoves also contributing significantly to particulate emissions in the
winter months only. An overview of major sources and emissions can be found
in Table 6.
Table 6: SENES Emissions Inventory – Major Sources11
Source CACs (tonnes) GHGs (tonnes)
Category
Type CO NOx SOx VOC NH3 TSP PM10 PM25 CO2 CH4 N2O
Area_Agriculture 39.79 1.37 0.00 16.51 8.22 17.94 13.52 8.50 0.00 53.11 0.99
Area_Dust 0.00 0.00 0.00 0.00 0.00 615.10 309.24 74.94 0.00 0.00 0.00
AREA
Area_Energy 179.47 12.66 0.61 39.51 0.70 28.03 26.46 26.46 34,092.93 28.39 1.01
Area_Other 32.91 31.39 0.24 1,973.70 0.19 5.38 5.04 4.94 1,214.10 446.34 7.78
AREA TOTAL 252.2 45.4 0.9 2,029.7 9.1 666.5 354.3 114.8 35,307.0 527.8 9.8
Mobile_Highway 1,031.96 98.71 0.88 90.10 3.24 2.48 2.48 1.74 20,586.35 4.47 5.42
Mobile_Local 614.64 49.95 0.38 52.74 2.07 1.28 1.28 0.89 10,591.60 2.75 2.83
NonRoad_Agriculture 68.55 12.98 1.04 4.84 0.05 0.84 0.84 0.81 1,261.49 0.41 0.40
MOBILE
NonRoad_Commercial 156.95 13.43 0.40 19.77 0.01 1.29 1.29 1.21 1,041.43 0.57 0.24
NonRoad_Construction 25.85 4.49 0.46 1.66 0.01 0.38 0.38 0.37 445.75 0.11 0.15
NonRoad_Industry 43.44 18.43 1.75 3.13 0.03 0.98 0.98 0.95 1,786.97 0.29 0.56
NonRoad_Recreational 67.92 0.27 0.01 31.63 0.01 0.87 0.87 0.80 380.73 0.44 0.01
NonRoad_Residential 412.67 2.51 0.02 41.90 0.01 1.18 1.18 1.09 770.12 0.88 0.02
MOBILE TOTAL 2,422.0 200.8 4.9 245.8 5.4 9.3 9.3 7.8 36,864.5 9.9 9.6
CanPar 116.40 81.66 1.14 269.13 0.50 420.00 87.00 66.00 0.00 0.00 0.00
Pacific Abrasives 0.00 0.00 0.00 0.00 0.00 17.00 3.60 3.60 0.00 0.00 0.00
POINT
Pope & Talbot 14.50 72.70 0.43 50.00 0.00 62.00 54.00 34.00 0.00 0.00 0.00
Roxul 1.31 2.18 0.03 26.04 3.31 84.20 78.20 74.20 0.00 0.00 0.00
Selkirk Paving 1.00 0.20 0.03 0.25 0.00 0.25 0.18 0.17 0.00 0.00 0.00
POINT TOTAL 133.2 156.7 1.6 345.4 3.8 583.5 223.0 178.0 0.0 0.0 0.0
Grand Total 2,807.4 402.9 7.4 2,620.9 18.4 1,259.2 586.6 300.7 72,171.5 537.7 19.4
11
Canpar permanently closed its doors in December 2007.
29Boundary Air Quality Management Plan
Historic trends for PM10 and PM2.5 in Boundary Airshed12
Figure 7: Annual 98th Percentile and Means for PM10
Figure 8: Monthly 98th Percentile and Means for PM10
12
The figures in this section have been provided by Ministry of the Environment.
30Boundary Air Quality Management Plan
Figure 9: Annual 98th Percentile and Means for PM2.5
Figure 10: Monthly 98th Percentile and Means for PM2.5
31Station Station
Forks
Forks
Grand
Grand
Vernon
Golden
Vernon
Golden
th th
25 Percentile 25 Percentile
-3 -3
(µg m ) (µg m )
5
4
5
13
15
18
Median Median
-3
-3
10
7
8
(µg m ) (µg m )
22
23
25
th
98 Percentile th
-3 98 Percentile
(µg m )
34
22
29
-3
(µg m )
75
98
104
Standard deviation
-3 Standard deviation
(µg m ) -3
9.1
5.3
7.2
(µg m )
19.1
21.5
21.3
Number of samples Number of samples
45
365
304
40
365
304
Data Capture Rate Data Capture Rate (%)
(%)
93
100
97
86
100
97
Frequency of GOOD Frequency of GOOD
AQ (%) AQ (%)
80
89
78
57
55
49
Frequency of FAIR Frequency of FAIR AQ
AQ (%) PM2.5 Readings in three locations in 2005
PM10 Readings in three locations in 2005
(%)
15
11
17
37
33
37
Frequency of POOR Frequency of POOR
AQ (%) AQ (%)
4
1
5
4
10
11
Table 7: PM10 Airshed Comparison with Calibrated TEOM Data
Table 8: PM2.5 Airshed Comparison with Calibrated TEOM Data
Frequency of VERY Frequency of VERY
Comparison of Boundary Airshed Data with Vernon & Golden
POOR AQ (%) POOR AQ (%)
2
0
0
2
2
2
Health Increments Health Increments
-3 -1
N/A
N/A
N/A
(µg m day year ) -3 -1
32
Boundary Air Quality Management Plan
(µg m day year )
237
338
375Boundary Air Quality Management Plan
Appendix 2: BAQC Stakeholders
Michele Caskey, BC Lung Association
Ingo Frankfurt, Interior Health
Dale Bonke, Ministry of the Environment
Paul Willis, Ministry of the Environment
Mike Reiner, Ministry of the Environment
Julia Beatty, Ministry of the Environment
Grace McGregor, Director Area C, Regional District of Kootenay Boundary
Tony Lodder, Director Area D, Regional District of Kootenay Boundary
Peter Regenberg, Roxul
Mike Van Ek, Interfor
Mr. Bent Jorgensen, Roxul
John Ketrenos, Pacific Abrasives
Cher Wyers, Chamber of Commerce
Joe Mottishaw, Emcon Services
Alvin Boyer, Ministry of Forests
Gary Smith, Gaia Principles
Karin Kilpatrick, Medical Staff
Lyle Olsen, Selkirk College
Rob Chornenki, resident
Victor Kumar, CAO, City of Grand Forks
Chris Moslin, Councillor City of Grand Forks
33Boundary Air Quality Management Plan
Appendix 3: Summary of Main Pollutants and their Impacts
Pollutant Description Sources Health Effects Environmental
Road dust, road and other
construction dust PM is the main source of haze that
PM10: Particles smaller than Mixing and applying reduces visibility.
10µm in diameter, also known fertilizers/pesticides Coarse particles irritate the nose and throat, but do
as “coarse particulates” not normally penetrate deep into the lungs.
and/or “inhalable particulates” Wind and other natural It takes hours to days for PM10 to settle out
sources of the air.
See also sources of PM2.5
PM contributes to smog
below
Particulate Matter
(PM): Dust, soot, and Combustion (motor vehicles, Fine particles enter the lungs, making it difficult to
tiny bits of solid woodstoves, yard waste and breathe, and lead to diseases such as bronchitis.
material. fireplaces) Depending on the source and chemical composition
Produced in reactions of of the fine particles, effects can be severe enough to
PM2.5: Particles smaller than
gaseous pollutants cause cancer and premature death.
2.5µm in diameter, also Because they are so small, PM2.5 stay in
known as “fine particulates” the air much longer than PM10, taking days
and/or “respriable Industrial Activity to weeks to be removed.
particulates” PM2.5 is the worst public health problem from air
Garbage Incineration pollution in BC (Research indicates the number of
hospital visits increases on days with increased PM
Agricultural, forestry, and
levels).
back yard burning, forest
fires
Exposure for 6-7 hours, even at low concentrations, Ozone occurs naturally high above the
significantly reduces lung function and causes Earth (in the stratosphere) where it
• At ground level, ozone is VOCs and NOx are released respiratory inflammation in healthy people during protects us from harmful ultraviolet rays.
formed by chemical reactions by burning coal, gasoline, periods of moderate exercise. Can be accompanied
Ground-Level Ozone by symptoms such as chest pain, coughing, nausea, Ground level ozone contributes to smog
between volatile organic and other fuels; VOCs are
(O3): Bluish gas with a and pulmonary congestion. Impacts on individuals
compounds (VOCs) and also released naturally by
pungent odour with pre-existing heart or respiratory conditions can At ground level, ozone can damage plants
nitrogen oxides (NOx) in the vegetation (e.g., the smell
be very serious. and trees, leading to reduced yields.
presence of sunlight. from evergreen sap/needles).
Ozone exposure can contribute to asthma, and At ground level, ozone leads to lung and
reduced resistance to colds and other infections. respiratory damage in animals.
• SOx: sulphur oxides
• CO: carbon monoxide
• NOx: nitrogen oxides While some of these pollutants have a
Most of these come from local impact on the environment (e.g.,
• TRS: total reduced sulphur combustion, particularly from heavy metals such as lead) or are
• VOCs: volatile organic vehicles, and industrial relatively short-lived (NO2), some are
Other Pollutants The health impacts of these pollutants are varied.
compounds processes or the evaporation long-lived (POPs), and can travel the
of paints and common world on wind currents in the upper
• POPs: persistent organic chemical products. atmosphere. NOX and SO2 contribute to
pollutants PM2.5 formation.
• Pb: lead
• HydrocarbonsBoundary Air Quality Management Plan
Appendix 4: Air Quality Standards and Objectives in BC
The Ambient Air Quality Objectives (AAQOs) in Table 6 reflect current knowledge
about air quality and health science. AAQOs can be used to formulate air quality
management programs comprised of, but not limited to, the following
components:
• Long-term surveillance monitoring
• Reporting on the quality of the air
• One of several decision factors in permit evaluation and regulation
development
• One of several decision factors in determining the need for and developing
air quality management programs for area and mobile sources.
In accordance with the continuous improvement provision of the Canada-wide
Standards, the AAQOs are medium-term, health-based objectives and a step
towards achievement of the lowest observable effects levels.
Table 9: Canada Wide Standards & Ambient Air Quality Objectives for PM
Ambient Air Quality
Air Objectives
Averaging Time Standard 3
Contaminant [micrograms/m
3
(µg/m )]
*24 hour Canada Wide Standards 30
24 hour
Ambient Air Quality Objectives 25
(proposed)
PM2.5
Annual (proposed) Ambient Air Quality Objectives 8
Planning Goal
Ambient Air Quality Objectives 6
(proposed)
PM10 24 hour Ambient Air Quality Objectives 50
*based on annual 98th percentile value, averaged over 3 consecutive years;
Canada Wide Standards (CWS) for PM2.5 and Ozone
The Canada Wide Standards (CWS) for Particulate Matter (PM2.5) and Ground
Level Ozone were endorsed by the Canadian Council of Ministers for the
Environment (CCME) (including the BC Ministry of Environment, federal,
provincial and territorial governments) in June 2000. In recognition of the lack of
health threshold levels for both PM and Ozone, the CWS contained a stipulation
for “keeping clean areas clean” and “continuous improvements” in areas that are
already meeting the standards.Boundary Air Quality Management Plan
BC Objectives for PM10
Recognizing the threat that PM10 poses to human health, the Ministry of
Environment has established an air quality objective of 50 micrograms/m3 (24-
hour average). The selection of this number was based on the findings by Vedal
(1993) on the effects of wood smoke in B.C. Vedal found that each 50
micrograms/m3 increment in PM10 was associated with an increase in health
effects ranging from respiratory symptoms to death. Exceedances of the air
quality objective indicate reduced protection against associated health effects.
Hence, one measure of PM10 air quality is the number or frequency of
exceedances of the air quality objective.
BC Objectives for PM2.5
In January 2008, BC Ministry of Environment announced its intention to establish
provincial ambient air quality criteria for particulate matter 2.5 micrometres (µm)
or smaller (PM2.5) – addressing objectives for 24-hour and annual averages, and
longer-term planning goals. It is expected that the new objectives will be in place
by 2009. The proposed levels are as follows:
• 24-hour AQO 25 ug/m3
• Annual AQO 8 ug/m3
• Planning Goal 6 ug/m3
Air Quality Index (AQI)
Air quality objectives for PM10 and other common contaminants form the basis of
the Air Quality Index (AQI). The AQI is a scale used in parts of the province and
elsewhere to determine if air quality is "good", "fair", "poor" or "very poor". At
sites where numerous contaminants are monitored, the AQI reflects the
concentration of the contaminant that is highest compared to its respective air
quality objective. Where PM10 is the contaminant of concern, air quality can be
described as shown in Table 7. Exceedances of the air quality objective for PM10
indicate that air quality may be poor or very poor.
Because Grand Forks does not have a PM10 monitor, it is likely that its actual AQI
may be higher than what is reported. For example, Grand Forks often has the
lowest AQI reading while other interior communities with the exact same PM2.5
reading (Golden, for example) will have a higher AQI because they also have a
PM10 monitor in place.
36You can also read