Quantitative analysis of population-scale family trees with millions of relatives - Gwern.net
←
→
Page content transcription
If your browser does not render page correctly, please read the page content below
RESEARCH ARTICLES

                                                                                                                             Cite as: J. Kaplanis et al., Science
                                                                                                                             10.1126/science.aam9309 (2018).

Quantitative analysis of population-scale family trees with
millions of relatives
Joanna Kaplanis,1,2* Assaf Gordon,1,2* Tal Shor,3,4 Omer Weissbrod,5 Dan Geiger,4 Mary Wahl,1,2,6
Michael Gershovits,2 Barak Markus,2 Mona Sheikh,2 Melissa Gymrek,1,2,7,8,9 Gaurav Bhatia,10,11
Daniel G. MacArthur,7,9,10 Alkes L. Price,10,11,12 Yaniv Erlich1,2,3,13,14†
1
 New York Genome Center, New York, NY 10013, USA. 2Whitehead Institute for Biomedical Research, Cambridge, MA 02142, USA. 3MyHeritage, Or Yehuda 6037606, Israel.
4
  Computer Science Department, Technion–Israel Institute of Technology, Haifa 3200003, Israel. 5Computer Science Department, Weizmann Institute of Science, Rehovot
7610001, Israel. 6Department of Molecular and Cellular Biology, Harvard University, Cambridge, MA 02138, USA. 7Harvard Medical School, Boston, MA 02115, USA.
8
  Harvard-MIT Program in Health Sciences and Technology, Cambridge, MA 02142, USA. 9Analytic and Translational Genetics Unit, Massachusetts General Hospital, Boston,
MA 02114, USA. 10Program in Medical and Population Genetics, Broad Institute of MIT and Harvard, Cambridge, MA 02142, USA. 11Department of Biostatistics, Harvard
School of Public Health, Boston, MA 02115, USA. 12Department of Epidemiology, Harvard School of Public Health, Boston, MA 02115, USA. 13Department of Computer
Science, Fu Foundation School of Engineering, Columbia University, New York, NY, USA. 14Center for Computational Biology and Bioinformatics, Department of Systems

                                                                                                                                                                        Downloaded from http://science.sciencemag.org/ on March 1, 2018
Biology, Columbia University, New York, NY, USA.
*These authors contributed equally to this work.
†Corresponding author. Email: erlichya@gmail.com

Family trees have vast applications in multiple fields from genetics to anthropology and economics.
However, the collection of extended family trees is tedious and usually relies on resources with limited
geographical scope and complex data usage restrictions. Here, we collected 86 million profiles from
publicly-available online data shared by genealogy enthusiasts. After extensive cleaning and validation, we
obtained population-scale family trees, including a single pedigree of 13 million individuals. We leveraged
the data to partition the genetic architecture of longevity by inspecting millions of relative pairs and to
provide insights into the geographical dispersion of families. We also report a simple digital procedure to
overlay other datasets with our resource in order to empower studies with population-scale genealogical
data.

Family trees are mathematical graph structures that can                              ta, the resulting trees are usually limited in geographical
capture mating and parenthood among humans. As such,                                 scope, and the data may be subject to strict usage protec-
the edges of the trees represent potential transmission lines                        tions. These challenges reduce demographic accessibility
for a wide variety of genetic, cultural, socio-demographic,                          and complicates fusion with information such as genomic or
and economic factors. Quantitative genetics is built on dis-                         health data.
secting the interplay of these factors by overlaying data on
family trees and analyzing the correlation of various classes                        Constructing and validating population scale family
of relatives (1–3). In addition, family trees can serve as a                         trees
multiplier for genetic information through study designs                             Here, we leveraged genealogy-driven social media data to
that leverage genotype or phenotype data from relatives (4–                          construct population-scale family trees. To this end, we fo-
7), analyzing parent-of-origin effects (8), refining heritability                    cused on Geni.com, a crowd-sourcing website in the geneal-
measures (9, 10), or improving individual risk assessment                            ogy domain. Users can create individual profiles and upload
(11, 12). Beyond classical genetic applications, large-scale                         family trees. The website automatically scans profiles to de-
family trees have played an important role across disci-                             tect similarities and offers the option to merge the profiles
plines, including human evolution (13, 14), anthropology                             when a match is detected. By merging, larger family trees
(15), and economics (16).                                                            are created that can be collaboratively co-managed to im-
     Despite the range of applications, constructing popula-                         prove their accuracy. After obtaining relevant permissions,
tion-scale family trees has been a labor-intensive process.                          we downloaded over 86 million publicly available profiles
Previous approaches mainly relied on local data repositories                         (21). The input data consists of millions of individual pro-
such as churches or vital record offices (14, 17, 18). But these                     files, each of which describes a person and any putative
approaches have limitations (19, 20): they require non-                              connections to other individuals in the dataset, along with
trivial resources to digitize the records and organize the da-                       any auxiliary data about the creator of the profile. Similar to

First release: 1 March 2018           www.sciencemag.org (Page numbers not final at time of first release)                                                       1
other crowdsourcing projects (22), a small group of partici-      the years 1840-2000 (27). We found an R2 = 0.95 between
pants contributed the majority of genealogy profiles (fig. S1).   the expected lifespan from historical data and the Geni da-
     We organized the profiles into graph topologies that         taset (Fig. 2B) and a 98% concordance with historical distri-
preserve the genealogical relationships between individuals       butions reported by the Human Mortality Database (HMD)
(Fig. 1A). Biology dictates that a family tree should form a      (Fig. 2C and fig. S5).
directed acyclic graph (DAG) where each individual has an              Next, we extracted the geographic locations of life
in-degree that is less than or equal to two. However, 0.3% of     events using a combination of an automated geo-parsing
the profiles resided in invalid biological topologies that in-    pipeline and structured text manually curated and approved
cluded cycles (e.g., a person that is both the parent and         by genealogists (21) (fig. S6A). Overall, we were able to place
child of another person) or an individual with more than          about 16 million profiles into longitude/latitude coordinates,
two parents. We developed an automated pipeline to resolve        typically at fine-scale geographic resolution, without major
local conflicts and prune invalid topologies (fig. S2) and        differences in quality between the automated geo-parsing
benchmarked the performance of the pipeline against hu-           and manual curations for subsequent analyses (fig. S6B)
man genealogists (21). This resulted in >90% concordance          (21). The profiles were distributed across a wide range of
between the pipeline and human decisions to resolve con-          locations in the Western World (Fig. 2D and fig. S7) with

                                                                                                                                       Downloaded from http://science.sciencemag.org/ on March 1, 2018
flicts, generating 5.3 million disjoint family trees.             55% from Europe and 30% from North America. We ana-
     The largest family tree in the processed data spanned 13     lyzed profiles in ten cities across the globe and found that
million individuals who were connected by shared ancestry         the first appearance of profiles was only after the known
and marriage (Fig. 1B). On average, the tree spanned 11 gen-      first settlement date for nearly all of the cities, suggesting
erations between each terminal descendant and their               good spatiotemporal assignment of profiles (Fig. 2E). Movie
founders (fig. S3). The size of this pedigree fits what is ex-    S1 presents the place of birth of individuals in the Geni da-
pected as familial genealogies coalesce at a logarithmic rate     taset in 5 year intervals from 1400 to 1900 along with
compared to the size of the population (23).                      known migration events.
     We evaluated the structure of the tree by inspecting the          We were concerned that the Geni.com profiles might
genetic segregation of unilineal markers. We obtained mito-       suffer from certain socio-economic ascertainment biases
chondria (mtDNA) and Y-STR haplotypes to compare multi-           and therefore would not reflect the local population. To
ple pairs of relatives in our graph (21). The mtDNA data was      evaluate this concern, we collected ~80,000 publicly availa-
available for 211 lineages and spanned a total of 1768 trans-     ble death certificates from the Vermont Department of
mission events (i.e., graph edges), whereas the Y-STR data        Health for every death in this state between 1985 and 2010.
was available for 27 lineages that spanned 324 total trans-       These records have extensive information for each individu-
mission events. Using a prior of no more than a single non-       al, including education level, place of birth, and a cause of
paternity event per lineage, we estimated a non-maternity         death in an ICD-9 code. Approximately one thousand indi-
rate of 0.3% per meiosis and non-paternity rate of 1.9% per       viduals in Geni overlapped this death certificate collection.
meiosis. This rate of non-paternity matched previous rates        We compared the education level, birth state, and ICD-9
of Y-chromosome studies (24, 25) and the non-maternity            code between these ~1000 Geni profiles and the entire Ver-
rate was close to historical rates of adoption of an unrelated    mont collection. For all three parameters, we found >98%
member in the US (26). Taken together, these results              concordance between the distribution of these key socio-
demonstrate that millions of genealogists can collaborate in      demographic attributes in the Geni profiles in Vermont and
order to produce high quality population-scale family trees.      the entire state of Vermont (tables S1 to S3). Overall, this
                                                                  high level of consistency argues against severe socioeconom-
Extracting demographic data                                       ic ascertainment. Table S4 reports key demographic and
We found that lifespan in the Geni.com profiles was largely       genetic attributes for various familial relationships from
concordant with reports generated by traditional demo-            parent-child via great-great-grandparents to fourth cousins.
graphic approaches. First, we extracted demographic infor-
mation from the collected profiles with exact birth and           Characterizing the genetic architecture of longevity
death dates, which show higher quality compared to profiles       We leveraged the Geni dataset to characterize the genetic
with only year resolution for these events (fig. S4). The data    architecture of human longevity, which exhibits complex
reflected historical events and trends such as elevated death     genetics likely to involve a range of physiological and behav-
rates at military age during the American Civil War, WWI,         ioral endophenotypes (28, 29). Narrow-sense heritability (h2)
and WWII, and a reduction in child mortality during the           of longevity has been estimated to be around 15%-30% (ta-
20th century (Fig. 2A). We compared the average lifespan in       ble S5) (30–35). Genome-wide association studies have had
our collection to a worldwide historical analysis covering        limited success in identifying genetic variants associated

First release: 1 March 2018                           www.sciencemag.org       (Page numbers not final at time of first release)   2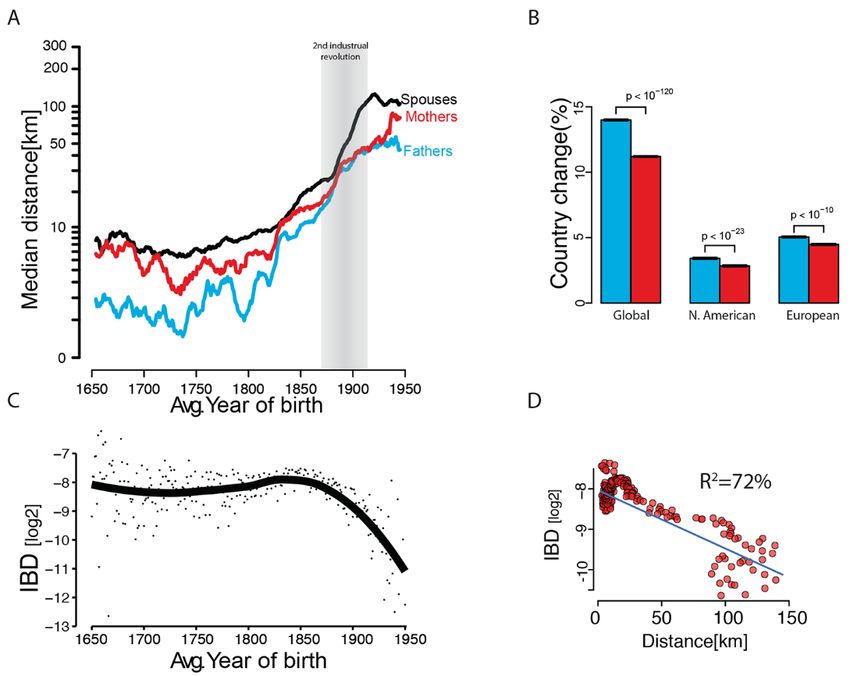
with longevity (36–38). This relatively large proportion of                  (MZ) twin pairs collected by the Danish Twin Registry (Fig.
missing heritability can be explained by the following: (A)                  3D) (42). Our inferred model for longevity accurately pre-
longevity has non-additive components that create upward                     dicted the observed correlation of this twin cohort with 1%
bias in estimates of heritability (39), (B) estimators of herit-             difference, well within the sampling error for the mean twin
ability are biased due to unaccounted environmental effects                  correlation (s.e. = 3.2%). We also evaluated an extensive ar-
(10), (C) the trait is highly polygenic and requires larger co-              ray of additional analyses that included various adjustments
horts to identify the underlying variants (40). We thus                      for environmental components and other confounders (figs.
sought to harness our resource and build a model for the                     S14 and 15) (21). In all cases, additivity explained 15.8%-
sources of genetic variance in longevity that jointly evalu-                 16.9% of the longevity estimates, dominance explained 2%-
ates additivity, dominance, epistasis, shared household ef-                  4%, and no evidence for epistatic interactions could be de-
fects, spatiotemporal trends, and random noise.                              tected using our procedure.
      We adjusted longevity to be the difference between the                      We also estimated the additive and epistatic compo-
age of death from the expected lifespan using a model that                   nents using a method that allows rapid estimation of vari-
we trained with 3 million individuals. Our model includes                    ance components of extremely large relationship matrices,
spatiotemporal and sex effects and was the best among 10                     called sparse Cholesky factorization linear mixed models

                                                                                                                                                  Downloaded from http://science.sciencemag.org/ on March 1, 2018
different models that adjusted various spatio-temporal at-                   (Sci-LMM) (43). This method takes into account a kinship
tributes (fig. S8). We also validated this model by estimating               coefficient matrix of 250 million pairs of related individuals
the narrow-sense heritability of longevity (h2) according to                 in the Geni dataset and includes adjustment for population
the mid-parent design (41) with nearly 130,000 parent-child                  structure, sex, and year of birth. We observed an additivity
trios. This process yielded h2mid-parent = 12.2% (s.e. = 0.4%)               of 17.8% (s.e = 0.84%) and a pairwise epistatic component
(Fig. 3A), which is on the lower end but in the range of pre-                that was not significantly different from zero (21).
vious heritability estimates (table S5). Consistent with pre-                     Taken together, our results across multiple study de-
vious studies, we did not observe any temporal trend in                      signs (fig. S16) indicated that the limited ability of GWA
mid-parent heritability (Fig. 3B).                                           studies so far to associate variants with longevity cannot be
      We partitioned the source of genetic variance of longev-               attributed to statistical epistasis. Importantly, this does not
ity using more than three million pairs of relatives from full               rule out the existence of molecular interactions between
sibling to 4th cousin (21). We measured the variance ex-                     genes contributing to this trait (44–47). Based on a large
plained by an additive component, pairwise epistatic model,                  number of data points and study designs, we measured an
3-way epistasis, and dominancy (Fig. 3C). To mitigate corre-                 additive component (h2 ≈ 16%) that is considerably smaller
lations due to non-genetic factors, these three million pairs                than the value generally cited in the literature of 25%. These
were all sex-concordant to address residual sex differences                  results indicate that previous studies are likely to have over-
not accounted for by our longevity adjustments (fig. S9) and                 estimated the heritability of longevity. As such, we should
do not include relatives who are likely to have died due to                  lower our expectations about our ability to predict longevity
environmental catastrophes or in major wars (fig. S10). We                   from genomic data and presumably to identify causal genet-
also refined the genetic correlation of the relatives by con-                ic variants.
sidering multiple genealogical paths (figs. S11 to S13).
      The analysis of longevity in these 3 million of pairs of               Assessment of theories of familial dispersion
relatives showed a robust additive genetic component, a                      Familial dispersion is a major driving force of various genet-
small impact of dominance, and no detectable epistasis (Fig.                 ic, economical, and demographic processes (48). Previous
3D and table S6) (21). Additivity was highly significant (paddi-             work has primarily relied on vital records from a limited
tive < 10     ) with an estimated h2sex-concordant/relatives = 16.1% (s.e.
          −318
                                                                             geographical scope (49, 50) or used indirect inference from
= 0.4%), similar to the heritability estimated from sex-                     genetic datasets that mainly illuminate distant historical
concordant parent-child pairs h2concordant/parent-child = 15.0% (s.e.        events (51).
= 0.4%). The maximum-likelihood estimate for dominance                            We harnessed our resource to evaluate patterns of hu-
was around 4% but the epistatic terms converged to zero                      man migration. First, we analyzed sex-specific migration
despite the substantial amount of data. Other model selec-                   patterns (21) to resolve conflicting results regarding sex bias
tion procedures such as Mean Squared Error (MSE) analysis                    in human migration (52). Our results indicate that females
and Bayesian Information Criterion (BIC) argued against                      migrate more than males in Western societies but over
pervasive epistatic contribution to longevity variance in the                shorter distances. The median mother-child distances were
population (21).                                                             significantly larger (Wilcox, one-tailed, p < 10−90) by a factor
      We tested the ability of our model to predict the longev-              of 1.6x than father-child distances (Fig. 4A). This trend ap-
ity correlation of an orthogonal dataset of 810 monozygotic                  peared throughout the 300 years of our analysis window,

First release: 1 March 2018                                    www.sciencemag.org         (Page numbers not final at time of first release)   3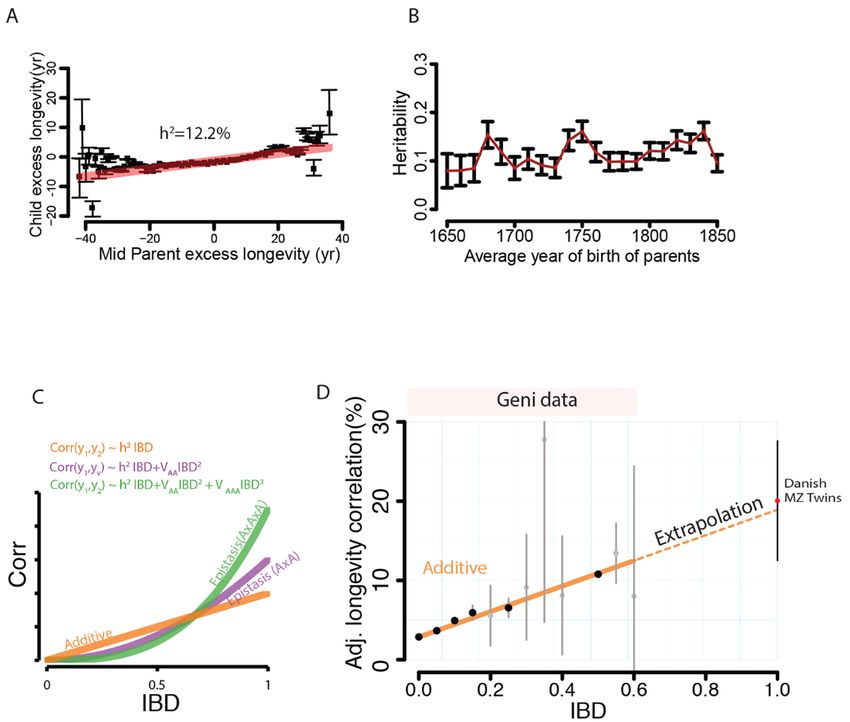
including in the most recent birth cohort, and was observed       advent of railroad travel in most of Europe and the United
both in North American (Wilcox, one-tailed, p < 10−23) and        States. However, the increase in marital distance was signif-
European duos (Wilcox, one-tailed, p < 10−87). On the other       icantly (p < 10−13) coupled with an increase in genetic relat-
hand, we found that the average mother-child distances (fig.      edness, contrary to the isolation by distance theory (fig.
S17) were significantly shorter than the father-child distanc-    S20B). Only for the cohorts born after 1850, did the data
es (t-test, p < 10−90), suggesting that long-range migration      match (R2 = 80%) the theoretical model of isolation by dis-
events are biased toward males. Consistent with this pat-         tance (fig. S20C).
tern, fathers displayed a significantly (p < 10−83) higher fre-       Taken together, the data shows a 50-year lag between
quency than mothers to be born in a different country than        the advent of increased familial dispersion and the decline
their offspring (Fig. 4B). Again, this pattern was evident        of genetic relatedness between couples. During this time,
when restricting the data to North American or European           individuals continued to marry relatives despite the in-
duos. Taken together, males and females in Western socie-         creased distance. From these results, we hypothesize that
ties show different migration distributions in which patrilo-     changes in 19th century transportation were not the primary
cality occurs only in relatively local migration events and       cause for decreased consanguinity. Rather, our results sug-
large-scale events that usually involve a change of country       gest that shifting cultural factors played a more important

                                                                                                                                                     Downloaded from http://science.sciencemag.org/ on March 1, 2018
are more common in males than females.                            role in the recent reduction of genetic relatedness of couples
     Next, we inspected the marital radius (the distance be-      in Western societies.
tween mates’ places of birth) and its effect on the genetic
relatedness of couples (21). The isolation by distance theory     Discussion
of Malécot predicts that increases in the marital radius          In this work, we leveraged genealogy-driven media to build
should exponentially decrease the genetic relatedness of          a dataset of human pedigrees of massive scale that covers
individuals (53). But the magnitude of these forces is also a     nearly every country in the Western world. Multiple valida-
function of factors such as taboos against cousin marriages       tion procedures indicated that it is possible to obtain a da-
(54).                                                             taset that has similar quality to traditionally collected
     We started by analyzing temporal changes in the birth        studies, but at much greater scale and lower cost.
locations of couples in our cohort. Prior to the Industrial            We envision that this and similar large datasets can ad-
Revolution ( 0.2) and          REFERENCES AND NOTES
weak (R2 = 0.7%) (fig. S20A). Couples born around 1800-
1850 showed a two-fold increase in their marital distance         1. R. A. Fisher, XV.—The correlation between relatives on the supposition of
                                                                       mendelian inheritance. Trans. R. Soc. Edinb. 52, 399–433 (1919).
from 8km in 1800 to 19km in 1850. Marriages are usually                doi:10.1017/S0080456800012163
about 20-25 years after birth and around this time (1820-
                                                                  2. S. Wright, Correlation and causation. J. Agric. Res. 20, 557–585 (1921).
1875) rapid transportation changes took place, such as the

First release: 1 March 2018                           www.sciencemag.org            (Page numbers not final at time of first release)            4
3. A. Tenesa, C. S. Haley, The heritability of human disease: Estimation, uses and association between the kinship and fertility of human couples. Science 319,
abuses. Nat. Rev. Genet. 14, 139–149 (2013). doi:10.1038/nrg3377 Medline 813–816 (2008). doi:10.1126/science.1150232 Medline
4. A. Kong, G. Masson, M. L. Frigge, A. Gylfason, P. Zusmanovich, G. Thorleifsson, P. 16. J. Modalsli, “Multigenerational persistence: Evidence from 146 years of
I. Olason, A. Ingason, S. Steinberg, T. Rafnar, P. Sulem, M. Mouy, F. Jonsson, U. administrative data” (Statistics Norway, 2016);
Thorsteinsdottir, D. F. Gudbjartsson, H. Stefansson, K. Stefansson, Detection of https://EconPapers.repec.org/RePEc:ssb:dispap:850.
sharing by descent, long-range phasing and haplotype imputation. Nat. Genet.
40, 1068–1075 (2008). doi:10.1038/ng.216 Medline 17. J. R. Gulcher, K. Stefansson, in Encyclopedia of Life Sciences (Wiley, 2001).
doi:10.1002/9780470015902.a0006270
5. J. K. Lowe, J. B. Maller, I. Pe’er, B. M. Neale, J. Salit, E. E. Kenny, J. L. Shea, R.
Burkhardt, J. G. Smith, W. Ji, M. Noel, J. N. Foo, M. L. Blundell, V. Skilling, L. 18. L. A. Cannon Albright, Utah family-based analysis: Past, present and future. Hum.
Garcia, M. L. Sullivan, H. E. Lee, A. Labek, H. Ferdowsian, S. B. Auerbach, R. P. Hered. 65, 209–220 (2008). doi:10.1159/000112368 Medline
Lifton, C. Newton-Cheh, J. L. Breslow, M. Stoffel, M. J. Daly, D. M. Altshuler, J. M. 19. L. A. C. Albright, in AMIA Annual Symposium Proceedings (American Medical
Friedman, Genome-wide association studies in an isolated founder population Informatics Association, 2006), p. 1161.
from the Pacific Island of Kosrae. PLOS Genet. 5, e1000365 (2009).
doi:10.1371/journal.pgen.1000365 Medline 20. V. Stefansdottir, O. T. Johannsson, H. Skirton, L. Tryggvadottir, H. Tulinius, J. J.
Jonsson, The use of genealogy databases for risk assessment in genetic health
6. D. F. Gudbjartsson, H. Helgason, S. A. Gudjonsson, F. Zink, A. Oddson, A. Gylfason, service: A systematic review. J. Community Genet. 4, 1–7 (2013).
S. Besenbacher, G. Magnusson, B. V. Halldorsson, E. Hjartarson, G. T. doi:10.1007/s12687-012-0103-3 Medline
Sigurdsson, S. N. Stacey, M. L. Frigge, H. Holm, J. Saemundsdottir, H. T.
Downloaded from http://science.sciencemag.org/ on March 1, 2018
Helgadottir, H. Johannsdottir, G. Sigfusson, G. Thorgeirsson, J. T. Sverrisson, S. 21. See supplementary materials.
Gretarsdottir, G. B. Walters, T. Rafnar, B. Thjodleifsson, E. S. Bjornsson, S.
22. A. Kittur, E. Chi, B. A. Pendleton, B. Suh, T. Mytkowicz, Power of the few vs.
Olafsson, H. Thorarinsdottir, T. Steingrimsdottir, T. S. Gudmundsdottir, A.
wisdom of the crowd: Wikipedia and the rise of the bourgeoisie. World Wide Web
Theodors, J. G. Jonasson, A. Sigurdsson, G. Bjornsdottir, J. J. Jonsson, O.
1, 19 (2007).
Thorarensen, P. Ludvigsson, H. Gudbjartsson, G. I. Eyjolfsson, O. Sigurdardottir,
I. Olafsson, D. O. Arnar, O. T. Magnusson, A. Kong, G. Masson, U. 23. J. T. Chang, Recent common ancestors of all present-day individuals. Adv. Appl.
Thorsteinsdottir, A. Helgason, P. Sulem, K. Stefansson, Large-scale whole- Probab. 31, 1002–1026 (1999). doi:10.1017/S0001867800009587
genome sequencing of the Icelandic population. Nat. Genet. 47, 435–444 (2015).
doi:10.1038/ng.3247 Medline 24. K. Anderson, How well does paternity confidence match actual paternity? Curr.
Anthropol. 47, 513–520 (2006). doi:10.1086/504167
7. J. Z. Liu, Y. Erlich, J. K. Pickrell, Case-control association mapping by proxy using
family history of disease. Nat. Genet. 49, 325–331 (2017). doi:10.1038/ng.3766 25. T. E. King, M. A. Jobling, Founders, drift, and infidelity: The relationship between
Medline Y chromosome diversity and patrilineal surnames. Mol. Biol. Evol. 26, 1093–1102
(2009). doi:10.1093/molbev/msp022 Medline
8. A. Kong, V. Steinthorsdottir, G. Masson, G. Thorleifsson, P. Sulem, S.
Besenbacher, A. Jonasdottir, A. Sigurdsson, K. T. Kristinsson, A. Jonasdottir, M. 26. P. Maza, Adoption trends: 1944–1975. Child Welf. Res. Notes 9, 1–11 (1984).
L. Frigge, A. Gylfason, P. I. Olason, S. A. Gudjonsson, S. Sverrisson, S. N. Stacey, 27. J. Oeppen, J. W. Vaupel, Broken limits to life expectancy. Science 296, 1029–
B. Sigurgeirsson, K. R. Benediktsdottir, H. Sigurdsson, T. Jonsson, R. 1031 (2002). doi:10.1126/science.1069675 Medline
Benediktsson, J. H. Olafsson, O. T. Johannsson, A. B. Hreidarsson, G.
Sigurdsson, A. C. Ferguson-Smith, D. F. Gudbjartsson, U. Thorsteinsdottir, K. 28. P. Sebastiani, T. T. Perls, The genetics of extreme longevity: Lessons from the
Stefansson, Parental origin of sequence variants associated with complex new England centenarian study. Front. Genet. 3, 277 (2012). Medline
diseases. Nature 462, 868–874 (2009). doi:10.1038/nature08625 Medline
29. R. E. Marioni, S. J. Ritchie, P. K. Joshi, S. P. Hagenaars, A. Okbay, K. Fischer, M. J.
9. C. Ober, M. Abney, M. S. McPeek, The genetic dissection of complex traits in a Adams, W. D. Hill, G. Davies, R. Nagy, C. Amador, K. Läll, A. Metspalu, D. C.
founder population. Am. J. Hum. Genet. 69, 1068–1079 (2001). Liewald, A. Campbell, J. F. Wilson, C. Hayward, T. Esko, D. J. Porteous, C. R. Gale,
doi:10.1086/324025 Medline I. J. Deary, Genetic variants linked to education predict longevity. Proc. Natl.
Acad. Sci. U.S.A. 113, 13366–13371 (2016). doi:10.1073/pnas.1605334113
10. N. Zaitlen, P. Kraft, N. Patterson, B. Pasaniuc, G. Bhatia, S. Pollack, A. L. Price, Medline
Using extended genealogy to estimate components of heritability for 23
quantitative and dichotomous traits. PLOS Genet. 9, e1003520 (2013). 30. P. Philippe, J. M. Opitz, Familial correlations of longevity: An isolate-based study.
doi:10.1371/journal.pgen.1003520 Medline Am. J. Med. Genet. 2, 121–129 (1978). doi:10.1002/ajmg.1320020203 Medline
11. R. Valdez, P. W. Yoon, N. Qureshi, R. F. Green, M. J. Khoury, Family history in 31. P. J. Mayer, Inheritance of longevity evinces no secular trend among members of
public health practice: A genomic tool for disease prevention and health six New England families born 1650-1874. Am. J. Hum. Biol. 3, 49–58 (1991).
promotion. Annu. Rev. Public Health 31, 69–87 (2010). doi:10.1002/ajhb.1310030109 Medline
doi:10.1146/annurev.publhealth.012809.103621 Medline
32. B. Ljungquist, S. Berg, J. Lanke, G. E. McClearn, N. L. Pedersen, The effect of
12. C. B. Do, D. A. Hinds, U. Francke, N. Eriksson, Comparison of family history and genetic factors for longevity: A comparison of identical and fraternal twins in the
SNPs for predicting risk of complex disease. PLOS Genet. 8, e1002973 (2012). Swedish Twin Registry. J. Gerontol. A 53, M441–M446 (1998).
doi:10.1371/journal.pgen.1002973 Medline doi:10.1093/gerona/53A.6.M441 Medline
13. M. Lahdenperä, V. Lummaa, S. Helle, M. Tremblay, A. F. Russell, Fitness benefits 33. A. M. Herskind, M. McGue, N. V. Holm, T. I. A. Sørensen, B. Harvald, J. W. Vaupel,
of prolonged post-reproductive lifespan in women. Nature 428, 178–181 (2004). The heritability of human longevity: A population-based study of 2872 Danish
doi:10.1038/nature02367 Medline twin pairs born 1870–1900. Hum. Genet. 97, 319–323 (1996).
doi:10.1007/BF02185763 Medline
14. C. Moreau, C. Bhérer, H. Vézina, M. Jomphe, D. Labuda, L. Excoffier, Deep human
genealogies reveal a selective advantage to be on an expanding wave front. 34. B. D. Mitchell, W. C. Hsueh, T. M. King, T. I. Pollin, J. Sorkin, R. Agarwala, A. A.
Science 334, 1148–1150 (2011). doi:10.1126/science.1212880 Medline Schäffer, A. R. Shuldiner, Heritability of life span in the Old Order Amish. Am. J.
Med. Genet. 102, 346–352 (2001). doi:10.1002/ajmg.1483 Medline
15. A. Helgason, S. Pálsson, D. F. Gudbjartsson, T. Kristjánsson, K. Stefánsson, An
First release: 1 March 2018 www.sciencemag.org (Page numbers not final at time of first release) 535. R. A. Kerber, E. O’Brien, K. R. Smith, R. M. Cawthon, Familial excess longevity in with special reference to humans. Annu. Rev. Ecol. Syst. 15, 279–301 (1984).
Utah genealogies. J. Gerontol. A 56, B130–B139 (2001). doi:10.1146/annurev.es.15.110184.001431
doi:10.1093/gerona/56.3.B130 Medline
50. R. Labouriau, A. Amorim, Human fertility increases with marital radius. Genetics
36. P. Sebastiani, N. Solovieff, A. T. Dewan, K. M. Walsh, A. Puca, S. W. Hartley, E. 178, 601–603 (2008). doi:10.1534/genetics.107.072454 Medline
Melista, S. Andersen, D. A. Dworkis, J. B. Wilk, R. H. Myers, M. H. Steinberg, M.
Montano, C. T. Baldwin, J. Hoh, T. T. Perls, Genetic signatures of exceptional 51. K. R. Veeramah, M. F. Hammer, The impact of whole-genome sequencing on the
longevity in humans. PLOS ONE 7, e29848 (2012). reconstruction of human population history. Nat. Rev. Genet. 15, 149–162
doi:10.1371/journal.pone.0029848 Medline (2014). doi:10.1038/nrg3625 Medline
37. J. Deelen, M. Beekman, H.-W. Uh, L. Broer, K. L. Ayers, Q. Tan, Y. Kamatani, A. M. 52. L. J. Lawson Handley, N. Perrin, Advances in our understanding of mammalian
Bennet, R. Tamm, S. Trompet, D. F. Guðbjartsson, F. Flachsbart, G. Rose, A. sex-biased dispersal. Mol. Ecol. 16, 1559–1578 (2007). doi:10.1111/j.1365-
Viktorin, K. Fischer, M. Nygaard, H. J. Cordell, P. Crocco, E. B. van den Akker, S. 294X.2006.03152.x Medline
Böhringer, Q. Helmer, C. P. Nelson, G. I. Saunders, M. Alver, K. Andersen- 53. G. Malécot, The Mathematics of Heredity (Freeman, 1970).
Ranberg, M. E. Breen, R. van der Breggen, A. Caliebe, M. Capri, E. Cevenini, J. C.
Collerton, S. Dato, K. Davies, I. Ford, J. Gampe, P. Garagnani, E. J. C. de Geus, J. 54. L. L. Cavalli-Sforza, A. Moroni, G. Zei, Consanguinity, Inbreeding, and Genetic Drift
Harrow, D. van Heemst, B. T. Heijmans, F.-A. Heinsen, J.-J. Hottenga, A. Hofman, in Italy (Princeton Univ. Press, 2004).
B. Jeune, P. V. Jonsson, M. Lathrop, D. Lechner, C. Martin-Ruiz, S. E. Mcnerlan, E.
55. J. H. Relethford, E. R. Brennan, Temporal trends in isolation by distance on
Mihailov, A. Montesanto, S. P. Mooijaart, A. Murphy, E. A. Nohr, L. Paternoster, I.
Sanday, Orkney Islands. Hum. Biol. 54, 315–327 (1982). Medline
Downloaded from http://science.sciencemag.org/ on March 1, 2018
Postmus, F. Rivadeneira, O. A. Ross, S. Salvioli, N. Sattar, S. Schreiber, H.
Stefánsson, D. J. Stott, H. Tiemeier, A. G. Uitterlinden, R. G. J. Westendorp, G. 56. J. Yuan, A. Gordon, D. Speyer, R. Aufrichtig, D. Zielinski, J. Pickrell, Y. Erlich,
Willemsen, N. J. Samani, P. Galan, T. I. A. Sørensen, D. I. Boomsma, J. W. DNA.Land is a framework to collect genomes and phenomes in the era of
Jukema, I. M. Rea, G. Passarino, A. J. M. de Craen, K. Christensen, A. Nebel, K. abundant genetic information. Nat. Genet. 50, 160–165 (2018).
Stefánsson, A. Metspalu, P. Magnusson, H. Blanché, L. Christiansen, T. B. L. doi:10.1038/s41588-017-0021-8
Kirkwood, C. M. van Duijn, C. Franceschi, J. J. Houwing-Duistermaat, P. E.
Slagboom, Genome-wide association meta-analysis of human longevity 57. J. K. Pickrell, T. Berisa, J. Z. Liu, L. Ségurel, J. Y. Tung, D. A. Hinds, Detection and
identifies a novel locus conferring survival beyond 90 years of age. Hum. Mol. interpretation of shared genetic influences on 42 human traits. Nat. Genet. 48,
Genet. 23, 4420–4432 (2014). doi:10.1093/hmg/ddu139 Medline 709–717 (2016). doi:10.1038/ng.3570 Medline
38. G. A. Erikson, D. L. Bodian, M. Rueda, B. Molparia, E. R. Scott, A. A. Scott-Van 58. E. Han, P. Carbonetto, R. E. Curtis, Y. Wang, J. M. Granka, J. Byrnes, K. Noto, A. R.
Zeeland, S. E. Topol, N. E. Wineinger, J. E. Niederhuber, E. J. Topol, A. Torkamani, Kermany, N. M. Myres, M. J. Barber, K. A. Rand, S. Song, T. Roman, E. Battat, E.
Whole-genome sequencing of a healthy aging cohort. Cell 165, 1002–1011 Elyashiv, H. Guturu, E. L. Hong, K. G. Chahine, C. A. Ball, Clustering of 770,000
(2016). doi:10.1016/j.cell.2016.03.022 Medline genomes reveals post-colonial population structure of North America. Nat.
Commun. 8, 14238 (2017). doi:10.1038/ncomms14238 Medline
39. O. Zuk, E. Hechter, S. R. Sunyaev, E. S. Lander, The mystery of missing
heritability: Genetic interactions create phantom heritability. Proc. Natl. Acad. 59. R. Khan, D. Mittelman, Rumors of the death of consumer genomics are greatly
Sci. U.S.A. 109, 1193–1198 (2012). doi:10.1073/pnas.1119675109 Medline exaggerated. Genome Biol. 14, 139 (2013). doi:10.1186/gb4141 Medline
40. E. A. Boyle, Y. I. Li, J. K. Pritchard, An expanded view of complex traits: From 60. R. Tarjan, Depth-first search and linear graph algorithms. SIAM J. Comput. 1,
polygenic to omnigenic. Cell 169, 1177–1186 (2017). 146–160 (1972). doi:10.1137/0201010
doi:10.1016/j.cell.2017.05.038 Medline 61. M. Gymrek, A. L. McGuire, D. Golan, E. Halperin, Y. Erlich, Identifying personal
41. P. M. Visscher, W. G. Hill, N. R. Wray, Heritability in the genomics era—concepts genomes by surname inference. Science 339, 321–324 (2013).
and misconceptions. Nat. Rev. Genet. 9, 255–266 (2008). doi:10.1038/nrg2322 doi:10.1126/science.1229566 Medline
Medline 62. B. Walsh, Estimating the time to the most recent common ancestor for the Y
42. A. Skytthe, K. O. Kyvik, N. V. Holm, K. Christensen, The Danish Twin Registry. chromosome or mitochondrial DNA for a pair of individuals. Genetics 158, 897–
Scand. J. Public Health 39 (suppl.), 75–78 (2011). 912 (2001). Medline
doi:10.1177/1403494810387966 Medline 63. M. Abney, A graphical algorithm for fast computation of identity coefficients and
43. T. Shor, D. Geiger, Y. Erlich, O. Weissbrod, SciLMM: Computing heritability with generalized kinship coefficients. Bioinformatics 25, 1561–1563 (2009).
millions of individuals. bioRxiv:10.1101/256396 (2018). doi:10.1093/bioinformatics/btp185 Medline
44. W. Li, J. Reich, A complete enumeration and classification of two-locus disease 64. M. Abney, M. S. McPeek, C. Ober, Estimation of variance components of
models. Hum. Hered. 50, 334–349 (2000). doi:10.1159/000022939 Medline quantitative traits in inbred populations. Am. J. Hum. Genet. 66, 629–650
(2000). doi:10.1086/302759 Medline
45. P. C. Phillips, Epistasis—the essential role of gene interactions in the structure
and evolution of genetic systems. Nat. Rev. Genet. 9, 855–867 (2008). 65. D. C. Rao, C. J. MacLean, N. E. Morton, S. Yee, Analysis of family resemblance. V.
doi:10.1038/nrg2452 Medline Height and weight in northeastern Brazil. Am. J. Hum. Genet. 27, 509–520
(1975). Medline
46. H. J. Cordell, Detecting gene-gene interactions that underlie human diseases.
Nat. Rev. Genet. 10, 392–404 (2009). doi:10.1038/nrg2579 Medline 66. O. Kempthorne, The correlation between relatives in a random mating
population. Proc. R. Soc. London Ser. B 143, 102–113 (1954).
47. W.-H. Wei, G. Hemani, C. S. Haley, Detecting epistasis in human complex traits. doi:10.1098/rspb.1954.0056 Medline
Nat. Rev. Genet. 15, 722–733 (2014). doi:10.1038/nrg3747 Medline
67. F. Elwert, N. A. Christakis, The effect of widowhood on mortality by the causes of
48. L. L. Cavalli-Sforza, P. Menozzi, A. Piazza, The History and Geography of Human death of both spouses. Am. J. Public Health 98, 2092–2098 (2008).
Genes (Princeton Univ. Press, 1994). doi:10.2105/AJPH.2007.114348 Medline
49. E. M. Wijsman, L. L. Cavalli-Sforza, Migration and genetic population structure 68. M. Rostila, J. Saarela, I. Kawachi, The forgotten griever: A nationwide follow-up
First release: 1 March 2018 www.sciencemag.org (Page numbers not final at time of first release) 6study of mortality subsequent to the death of a sibling. Am. J. Epidemiol. 176, Denmark (www.sdu.dk/en/om_sdu/institutter_centre/ist_sundhedstjenesteforsk/
338–346 (2012). doi:10.1093/aje/kws163 Medline centre/dtr). The findings, opinions and recommendations expressed therein are
those of the authors and are not necessarily those of the DTR. The Vermont Death
69. G.-B. Chen, Estimating heritability of complex traits from genome-wide Certificate collection were obtained upon request from the Chief of Public Health
association studies using IBS-based Haseman-Elston regression. Front. Genet. 5, Statistics of the Vermont Department of Health (www.healthvermont.gov/stats).
107 (2014). Medline
70. D. Golan, S. Rosset, Narrowing the gap on heritability of common disease by SUPPLEMENTARY MATERIALS
direct estimation in case-control GWAS. arXiv:1305.5363 (2013). www.sciencemag.org/cgi/content/full/science.aam9309/DC1
71. D. Speed, D. J. Balding, Relatedness in the post-genomic era: Is it still useful? Nat. Materials and Methods
Rev. Genet. 16, 33–44 (2015). doi:10.1038/nrg3821 Medline Figs. S1 to S21
Tables S1 to S6
72. C. R. Henderson, A simple method for computing the inverse of a numerator Movie S1
relationship matrix used in prediction of breeding values. Biometrics 32, 69–83 References (60–79)
(1976). doi:10.2307/2529339
7 February 2017; resubmitted 2 November 2017
73. R. A. Mrode, Linear Models for the Prediction of Animal Breeding Values (Cabi,
Accepted 7 February 2018
2014).
Published online 1 March 2018
74. T. Meuwissen, Z. Luo, Computing inbreeding coefficients in large populations. 10.1126/science.aam9309
Downloaded from http://science.sciencemag.org/ on March 1, 2018
Genet. Sel. Evol. 24, 305 (1992). doi:10.1186/1297-9686-24-4-305
75. Y. Chen, T. A. Davis, W. W. Hager, S. Rajamanickam, Algorithm 887: CHOLMOD,
supernodal sparse Cholesky factorization and update/downdate. ACM Trans.
Math. Softw. 35, 22 (2008). doi:10.1145/1391989.1391995
76. P.-R. Loh, G. Bhatia, A. Gusev, H. K. Finucane, B. K. Bulik-Sullivan, S. J. Pollack, T.
R. de Candia, S. H. Lee, N. R. Wray, K. S. Kendler, M. C. O’Donovan, B. M. Neale,
N. Patterson, A. L. Price, Contrasting genetic architectures of schizophrenia and
other complex diseases using fast variance-components analysis. Nat. Genet.
47, 1385–1392 (2015). doi:10.1038/ng.3431 Medline
77. K. Matilainen, E. A. Mäntysaari, M. H. Lidauer, I. Strandén, R. Thompson,
Employing a Monte Carlo algorithm in Newton-type methods for restricted
maximum likelihood estimation of genetic parameters. PLOS ONE 8, e80821
(2013). doi:10.1371/journal.pone.0080821 Medline
78. H. M. Kang, N. A. Zaitlen, C. M. Wade, A. Kirby, D. Heckerman, M. J. Daly, E. Eskin,
Efficient control of population structure in model organism association mapping.
Genetics 178, 1709–1723 (2008). doi:10.1534/genetics.107.080101 Medline
79. C. Lippert, J. Listgarten, Y. Liu, C. M. Kadie, R. I. Davidson, D. Heckerman, FaST
linear mixed models for genome-wide association studies. Nat. Methods 8, 833–
835 (2011). doi:10.1038/nmeth.1681 Medline
ACKNOWLEDGMENTS
We thank D. Zielinski, G. Japhet, and J. Novembre for valuable comments and the
Erlich lab members for constant support in pursuing this project. The authors also
thank the Vermont Health Department for providing all death certificates. This study
was supported by a generous gift from Andria and Paul Heafy (Y.E), the Burroughs
Wellcome Fund Career Awards at the Scientific Interface (Y.E.), the Broad Institute’s
SPARC: Catalytic Funding for Novel Collaborative Projects award (Y.E. and D.M.), by
NIH grants R01 MH101244 and R03 HG006731 (A.L.P.), and Israeli Science Founda-
tion grant 1678/12 (D.G). A.G., and Y.E. conducted the downloading, indexing, and
organizing the data. J.K., A.G., M.W., B.M., M.G., M.S., and Y.E. developed the proce-
dures to cleaning the family trees and extract demographic information. J.K., T.S.,
O.W., D.G., G.B., D.G.M, A.L.P, and Y.E. were involved in analyzing the genetic archi-
tecture of longevity. J.P., M.W. and Y.E. conducted the analysis of human migration.
J.K., T.S., O.W., D.G.M, A.L.P, and Y.E. wrote the manuscript. T.S and Y.E became
employees of MyHeritage.com, the parent company of Geni.com, during the course
of this study. The other authors did not declare relevant competing interests. The
Geni dataset without names is available from Yaniv Erlich under the terms described
on FamiLinx.org. The code for the API integration is available on
https://github.com/TeamErlich/geni-integration-example, the code for Sci-LMM is
available on: https://github.com/TalShor/SciLMM, and the code to download Geni
profiles is available on: https://github.com/erlichya/geni-download. The Human
Mortality Database (HMD) is available on www.mortality.org/. The Danish Twin
Registry (DTR) data are available upon request from the University of Southern
First release: 1 March 2018 www.sciencemag.org (Page numbers not final at time of first release) 7Downloaded from http://science.sciencemag.org/ on March 1, 2018 Fig. 1. Overview of the collected data. (A) The basic algorithmic steps to form valid pedigree structures from the input data available via the Geni API. Gray: profiles; Red: marriages (See fig. S2 for a comprehensive overview). The last step shows an example of a real pedigree from the website with ~6,000 individuals spanning about 7 generations. (B) The size distribution of the largest 1,000 family trees after data cleaning sorted by size. First release: 1 March 2018 www.sciencemag.org (Page numbers not final at time of first release) 8
Downloaded from http://science.sciencemag.org/ on March 1, 2018

  Fig. 2. Analysis and validation of demographic data. (A) Distribution of life expectancy per year. The colors
  correspond to the frequency of profiles of individuals who died at a certain age for each year. Stars indicate
  deaths during military ages in the civil war, WWI, and WWII. (B) The expected lifespan in Geni (black) and the
  Oeppen and Vaupel study [red (30)] as a function of year of death. (C) Comparing the lifespan distributions
  versus Geni (black) and HMD (red) (Also see fig. S5A). (D) The geographic distribution of the annotated place of
  birth information. Every pixel corresponds to a profile in the dataset. (E) Validation of geographical assignment by
  historical trends. Top: the cumulative distribution of profiles since 1500 for each city on a logarithmic scale as a
  function of time. Bottom: year of first settlement in the city.

First release: 1 March 2018                       www.sciencemag.org     (Page numbers not final at time of first release)   9
Downloaded from http://science.sciencemag.org/ on March 1, 2018
     Fig. 3. The genetic architecture of longevity. (A) The regression (red) of child longevity on its mid-parent
     longevity (defined as difference of age of death from the expected lifespan). Black: the average longevity of
     children binned by the mid-parent value. Gray: estimated 95% confidence intervals. (B) The estimated
     narrow-sense heritability (red squares) with 95% confidence intervals (black bars) obtained by the mid-
     parent design stratified by the average decade of birth of the parents. (C) The correlation of a trait as a
     function of IBD under strict additive (h2, orange), squared (VAA, purple), and cubic (VAAA, green) epistasis
     architectures after dormancy adjustments. (D) The average longevity correlation as a function of IBD (black
     circles) grouped in 5% increments (gray: 95% CI) after adjusting for dominancy. Dotted line: the
     extrapolation of the models toward MZ twins from the Danish Twin Registry (red circle).

First release: 1 March 2018                       www.sciencemag.org    (Page numbers not final at time of first release) 10
Downloaded from http://science.sciencemag.org/ on March 1, 2018 Fig. 4. Analysis of familial dispersion. (A) The median distance [log10 x+1] of father-offspring places of birth (cyan), mother-offspring (red), and marital radius (black) as a function of time (average year of birth). (B) The rate of change in the country of birth for father-offspring (cyan) or mother-offspring (red) stratified by major geographic areas. (C) The average IBD [log2] between couples as a function of average year of birth. Individual dots represent the measured average per year. Black line denotes the smooth trend using locally weighted regression. (D) The IBD of couples as a function of marital radius. Blue line denotes best linear regression line in log-log space. First release: 1 March 2018 www.sciencemag.org (Page numbers not final at time of first release) 11
Quantitative analysis of population-scale family trees with millions of relatives
Joanna Kaplanis, Assaf Gordon, Tal Shor, Omer Weissbrod, Dan Geiger, Mary Wahl, Michael Gershovits, Barak Markus, Mona
Sheikh, Melissa Gymrek, Gaurav Bhatia, Daniel G. MacArthur, Alkes L. Price and Yaniv Erlich

published online March 1, 2018

                                                                                                                          Downloaded from http://science.sciencemag.org/ on March 1, 2018
  ARTICLE TOOLS                   http://science.sciencemag.org/content/early/2018/02/28/science.aam9309

  SUPPLEMENTARY                   http://science.sciencemag.org/content/suppl/2018/02/28/science.aam9309.DC1
  MATERIALS

  REFERENCES                      This article cites 69 articles, 9 of which you can access for free
                                  http://science.sciencemag.org/content/early/2018/02/28/science.aam9309#BIBL

  PERMISSIONS                     http://www.sciencemag.org/help/reprints-and-permissions

Use of this article is subject to the Terms of Service

Science (print ISSN 0036-8075; online ISSN 1095-9203) is published by the American Association for the Advancement of
Science, 1200 New York Avenue NW, Washington, DC 20005. 2017 © The Authors, some rights reserved; exclusive licensee
American Association for the Advancement of Science. No claim to original U.S. Government Works. The title Science is a
registered trademark of AAAS.
You can also read