01/52 Cooperative Governance and Traditional ...
←
→
Page content transcription
If your browser does not render page correctly, please read the page content below
01/52
2
    PROFILE: CAPRICORN DISTRICT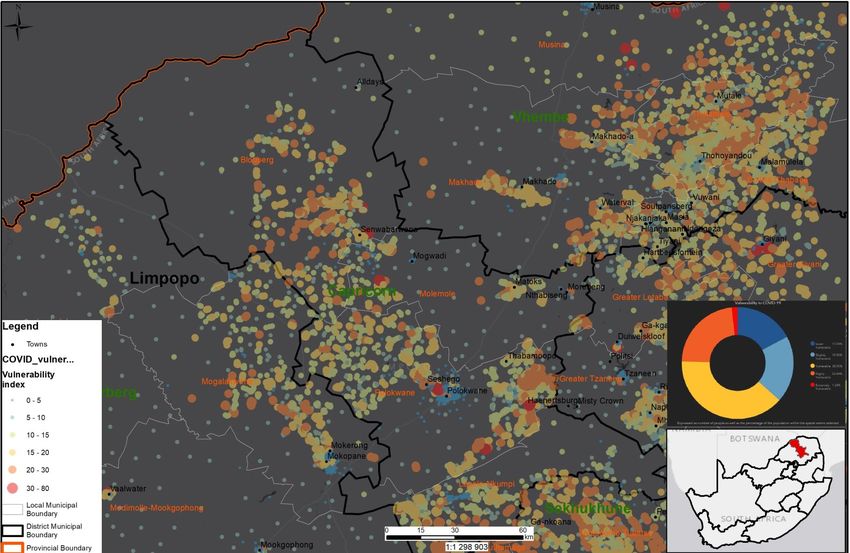
PROFILE: CAPRICORN DISTRICT            3

CONTENT

1     Executive Summary ........................................................................................... 6
2     Introduction: Brief Overview ............................................................................. 7
2.1 Location................................................................................................................ 7
2.2 Historical Perspective ........................................................................................... 8
2.3 Spatial Status ....................................................................................................... 9
2.4 Land Ownership ................................................... Error! Bookmark not defined.
3     Social Development Profile ............................................................................. 11
3.1 Key Social Demographics .................................................................................. 11
3.1.1        Population and Household Profile .............................................................. 11
3.1.2        Race, Gender and Age profile .................................................................... 12
3.1.3        Poverty ......................................................... Error! Bookmark not defined.
3.1.4        Human Development Index and Gini coefficient ........................................ 17
3.1.5        Unemployment/Employment ...................................................................... 17
3.1.6        Education provision .................................................................................... 20
3.1.7        Healthcare Provision .................................................................................. 13
3.1.8        Covid-19 ..................................................................................................... 14
3.1.9        Crime Levels .............................................................................................. 19
4     Drivers of the economy ................................................................................... 22
4.1 Economic Overview ........................................................................................... 22
4.2 Primary Sectors .................................................................................................. 24
4.2.1        Agriculture and Mining.................................. Error! Bookmark not defined.
4.3 Trade .................................................................................................................. 26
4.4 Tourism .............................................................................................................. 26
5     Service delivery ................................................................................................ 27
6     Governance ...................................................................................................... 33
7     Projects to diversify and grow people and the economy ............................. 35
8     Key recommendations ..................................................................................... 38
8.1 Prioritise Integrated Development Plan .............................................................. 38
8.2 Investor and Sponsorship Opportunities ............................................................ 38
4
    PROFILE: CAPRICORN DISTRICT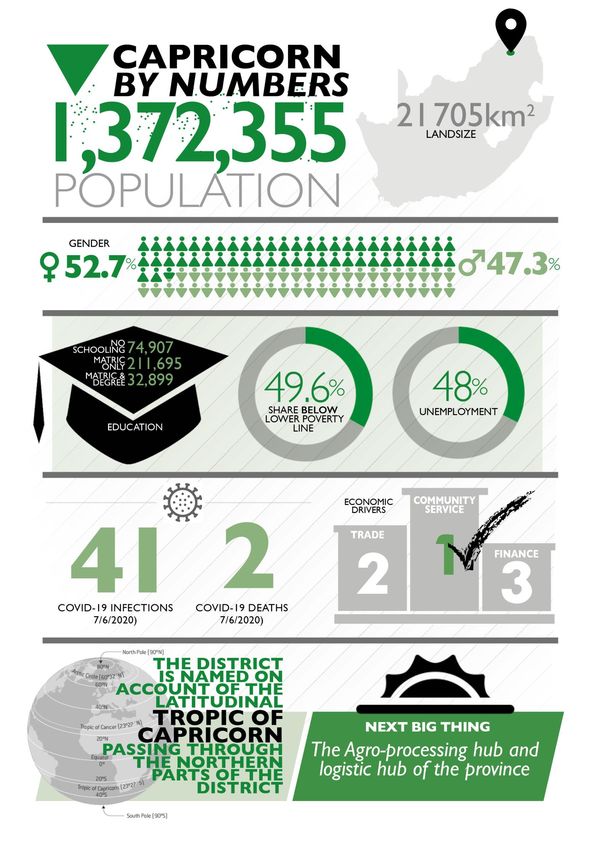
5
PROFILE: CAPRICORN DISTRICT

                                  COVID-19 Vulnerability Index
                                          Capricorn
                                     Source: CSIR/NCDM
                              `
6
PROFILE: CAPRICORN DISTRICT
1. Executive Summary
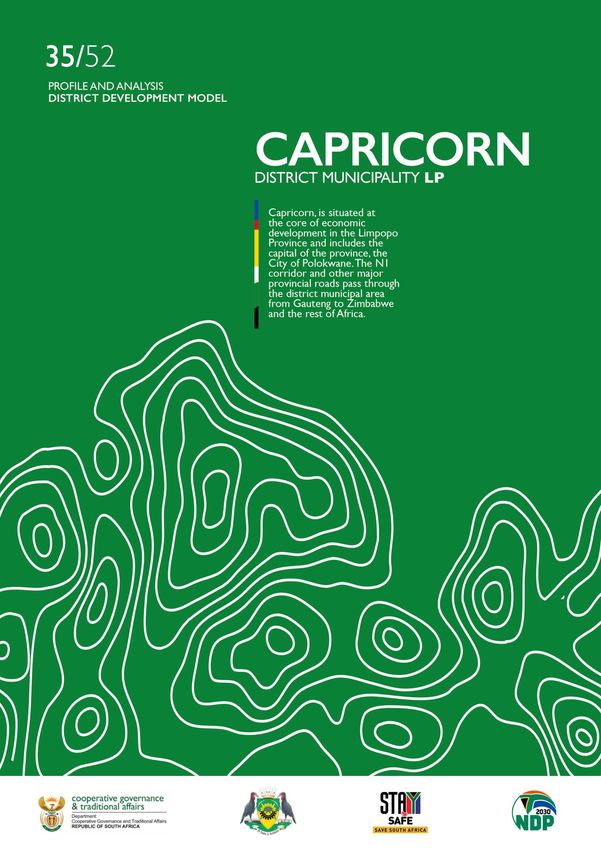
The Capricorn District Municipality is situated at the core of economic
development in the Limpopo Province and includes the capital of the
province, the City of Polokwane. The central location of the district in
relation to the province, the country and the SADC region as a whole
means that trip generation and trip interchanges happen and are
strongest in Polokwane.
The District consists of four (4) local municipalities, namely; Blouberg LM, Molemole
LM, Polokwane LM and Lepelle-Nkumpi LM. The District covers an area of 185 222.27
Hectares which constitutes 12% of the total surface area of the province and is made
up of 113 wards and has 28 traditional authorities.
The Capricorn District has a total population of 1 372 355 million people representing
about 23% of the total population in the province and 2.3% of the population in South
Africa. The most populated local municipality in the district is the City of Polokwane,
while Molemole is the least populous municipality in the district.
In the Capricorn District the number of people without any schooling decreased from
132 373 (2009) to 74 907 (2019), while in the same period the number of people within
the 'matric only' category, increased from 89 673 to 211 695. The number of people
with 'matric and a certificate/diploma' increased from 26 729 to 73 042 in the same
period, while number of people with a 'matric and a Bachelor's' degree increasing from
10 282 to 32 898.
In terms of educational facilities, the district has a total number of 541 primary schools,
342 secondary schools, 5 combined schools, 14 special schools, 489 ECDs and 22
institutions of higher learning
With regards to the health, three highest causes of death in the district for children
under the age of 5 are: lower respiratory infections (22.3%), Diarrhoea (21.2%), and
pre-term birth complications (8.9%). The top two causes of death for young women
and men between the ages 15-24 are road injuries at 13.3% and HIV/Aids (11.3%). In
the age group 25 to 64, the top causes of death for males and females are HIV, TB
and lower respiratory infections.
On the economic front, the main drivers of the economy in Capricorn are agriculture,
manufacturing, mining and community services. The agricultural sector has high
potential and a role to play in the district economy, particularly agro-processing (citrus
fruits such as oranges) of agricultural produce. There are large areas of orange farms
that can be resuscitated at the Zebediela citrus farm estate laying fallow and
unproductive.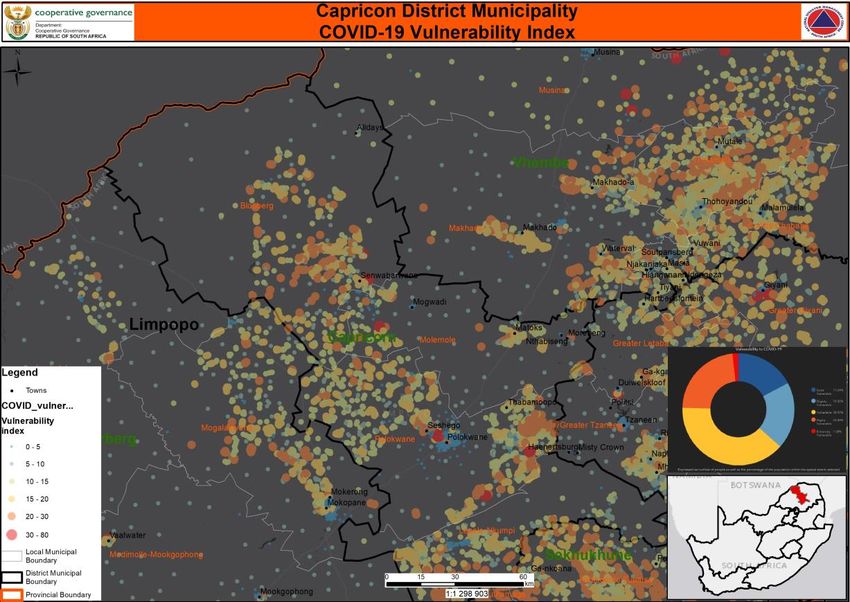
PROFILE: CAPRICORN DISTRICT 7
In 2018, Capricorn employed 353 000 people which is 26.56% of the total employment
in Limpopo Province (1.33 million), 2.17% of total employment in South Africa
(16.3 million). Between 2008 and 2018 employment in the district increased annually
at an average rate of 4.16%. There is a total number of 81 100 people unemployed in
Capricorn, which is a decrease of -9 620 from 90 800 in 2008. The total number of
unemployed people within Capricorn constitutes 24.13% of the total number of
unemployed people in the Limpopo Province.
In terms of employment contribution by sector to the total employment in the district,
agriculture contributes 7%, mining 1%, manufacturing 7%, electricity 1%, Construction
10%, Trade 25%, Transport 4%, Finance 11%, community services 26%, while
households contribute 8%. Community services together with trade contribute the
largest share to the total employment in the district.
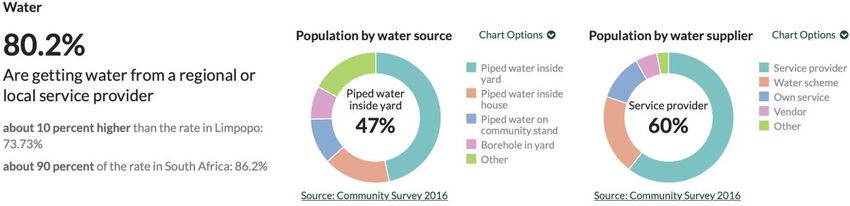
With regards to the provision of basic services, about 298 264 (80.1%) households in
the district have access to safe drinking water. About 33% of households have access
to water-borne facilities and 62% of households use pit latrines (VIP and without
ventilation). The percentage of households with access to electricity in the district has
increased from 33% in 1996 to 96% in 2016.
“WITH REGARDS TO THE PROVISION
OF BASIC SERVICES , ABOUT 298 264 (80.1%)
HOUSEHOLDS IN THE DISTRICT HAVE ACCESS
TO SAFE DRINKING WATER .”
2. Introduction: Brief Overview
2.1 Location
The Capricorn District is situated in the centre of the Limpopo Province,
sharing boundaries with the Mopani District to the east, Sekhukhune
District to the south, Vhembe District to the north and Waterberg
District to the west. The District is situated at the core of economic
development in the Limpopo Province and includes the capital of the
province, the City of Polokwane. The N1 corridor (from Gauteng to
Zimbabwe and the rest of Africa) and other major provincial roads pass
through the district. The central location of the district in relation to the
province, the country and the SADC region as a whole means that trip
generation and trip interchanges happen and are strongest in
Polokwane.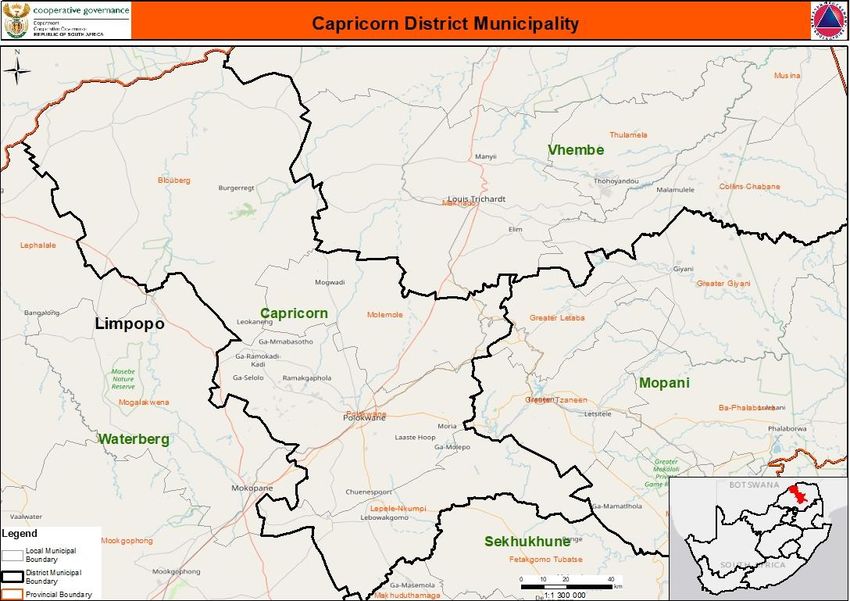
8
          PROFILE: CAPRICORN DISTRICT

The map below shows the geographical location and the four (4) municipalities
(Aganang LM was disestablished).

2.2 Historical Perspective
The district is named Capricorn District Municipality on account of the Latitudinal Tropic
of Capricorn passing through the northern parts of the district. It is one of the 5 districts
of Limpopo province of South Africa, with its administrative seat and that of the
province residing in the City of Polokwane. The town became a city in 1992 and was
previously named Pietersburg in honour of the Voortrekker leader Petrus Jacobus
Joubert. It was renamed Polokwane, meaning ‘place of peace’ in 2005.

The city and district was once the capital for the Northern Sotho/Pedi clan of the
Bakone ba Matla a Thaba, who lived in the area in the 17th century. The skilled clan
successfully defended their territory resulting in the abandonment of the town
established by the Voortrekkers under the leadership of Andries Potgieter which was
once called Zoutpansbergdorp just 100km north of Polokwane. The Boers abandoned
the town in favour if laagering in Polokwane.

The district hosts the Bakone Malapa Northern Sotho Open-Air Museum in Polokwane
which showcases the traditional and modern-day lifestyle of the Bakone people. The
museum is centred on a traditional village still occupied by members of the tribe, who
sell various crafts to tourists. Within the museum complex one can find archaeological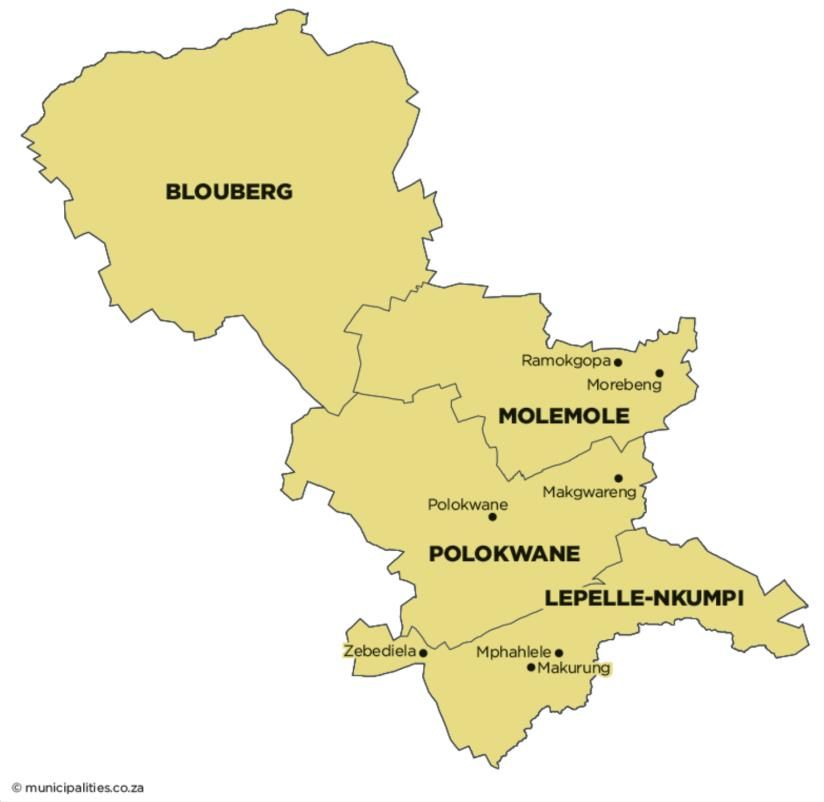
PROFILE: CAPRICORN DISTRICT   9

sites with remains of the iron- and copper-smelting installations, as well as rock
paintings which date back to around 1000 B.C. The Eersteling Monuments in
Pietersburg / Polokwane is the site of South Africa's first gold crushing site and its first
gold power plant is marked by monuments. In 2017, Polokwane was named the
"Greenest Municipality in South Africa".

2.3 Spatial Status
The Capricorn District covers an area of 16,970.30 kilometres square, which
represents 12% of the total surface area of the province. The district comprises 4 local
municipalities and each is defined below:

Blouberg Municipality is located at the far northern part of the district area. The
following growth points have been identified in the Blouberg LM, namely;
Senwabarwana (Bochum), Alldays, Eldorado, Buffelshoek, Harriswich and My-Darling.
The municipality borders Zimbabwe and Botswana and is the largest at 9 540km² of
the four municipalities of the district making up almost half of the District. Blouberg is
home to some of the most spectacular rock climbing in South Africa. It is famous for
its big-wall natural climbing, with route lengths up to 350m. The vegetation ranges from
subtropical savanna at the base, to alpine near the summit. It takes its name from the
Blouberg (blue mountains), a mountain range located to the west of the western end
of the Soutpansberg Mountain Range, north-west of the town of Vivo. Blouberg is a
hot area with annual rainfall varying between 380 and 550mm. Most rainfall is
experienced during the summer months. Evapotranspiration during the rainy season
is very high. The area is prone to frequent drought, which has an adverse effect on the
local economy. The only perennial river is the Mogalakwena River, which feeds the
10
          PROFILE: CAPRICORN DISTRICT

Glen Alpine Dam, the only source of pipeline water in the area. The main economic
drivers are agriculture, mining and tourism.

Lepelle-Nkumpi Municipality is the second largest municipality in population and
smallest in landmass (3 484 km2) within the District. It is located in the southern area,
55 kilometres from Polokwane. The municipal area comprises 2 urban nodes, the
Lebowakgomo District Growth Point and the Magatle Municipality Growth Point, and a
surrounding rural area with both commercial and communal mixed-farming practises.
The municipality is predominantly rural. It is divided into 29 wards, four of them being
a township called Lebowakgomo and one of the Capricorn District's growth points. All
sittings of the Provincial Legislature take place at Lebowakgomo Old Parliament for
the former homeland. Its next important town is Zebediela.

Molemole Municipality is located on the north-eastern side of the District. The
municipality shares boundaries with Vhembe to the north, to the south Polokwane, to
the east Mopani, and to the west Blouberg. The N1 crosses through the municipal area
linking the Molemole with Zimbabwe to the north. The R521 Provincial Road passes
through the municipality linking it to Botswana on the western side. It comprises farms,
plantations, small-scale mining, housing (low cost, informal, middle income),
transportation networks (road and rail), agricultural areas (commercial and
subsistence), and recreational and community facilities. It has a potential for tourism
development, which needs to be improved and marketed to attract and create an
economic base. Notable towns in the municipality are Mogwadi (Dedron) and
Morebeng (Soekmekaar) as well as the villages of Ramokgopa.

Polokwane Local Municipality houses the City of Polokwane which is the capital of
Limpopo. The municipality serves as the economic hub of Limpopo, and has the
highest population density in the Capricorn District. It is located on the N1 that extends
from Pretoria to Zimbabwe. The spatial pattern of the municipal area reflects the
historic "apartheid city" model, with Polokwane as the main centre and other township
nodes such as Seshego and Mankweng located 10km to the north-northwest and
25km to the east of the city centre respectively. At the centre of the area is the
Polokwane economic hub, which comprises the central business district, industrial
area, and a range of social services and well-established formal urban areas servicing
the more affluent residents of Polokwane. Situated on the outskirts in several clusters
are less formal settlement areas, which are experiencing enormous influx from rural
urban migration trends.

These areas are in dire need of upgraded services and infrastructure, both social and
engineering, and are struggling to cope with the informal influx of more and more
people who want access to an improved quality and standard of living. Extremely
impoverished rural settlements are scattered in the peripheral areas of the municipal
area. It is a city with more than a century of phenomenal growth and prosperity.
Polokwane Municipality accounts for 3% of the total surface area of Limpopo, however,
PROFILE: CAPRICORN DISTRICT 11 over 10% of the population of Limpopo resides within its boundaries. The city is also home to the University of Limpopo previously known as Turfloop, as well as the headquarters of the 10million strong Zion Christian Church which is in the City of Moria. The key economic drivers are community services (32.1%), finance (21.5%), wholesale and retail trade (18.3%), transport (11.7%), manufacturing (4.8%), mining (4.2%). 3. Social Development Profile 3.1 Key Social Demographics 3.1.1 Population The Capricorn District has a total population of 1 372 355 million people representing about 23% of the total population in the province and 2.3% of the population in South Africa. The most populated local municipality in the district is Polokwane Local Municipality, while Molemole is the least populous municipality in the district. Between 2009 and 2019, the population growth of the district averaged 0.9% per annum, which is about half than the growth rate of South Africa as a whole (1.61%). Compared to Limpopo's average annual growth rate (0.86%), the growth rate in Capricorn's population at 0.92% was very similar than that of the province. According to District’s 2040 Growth and Development Strategy in the year 2040 the population of CDM will be close to 1.5 million, if we assume a linear growth of the population at an average of 1%.
12
          PROFILE: CAPRICORN DISTRICT

3.1.2 Gender, Age and Race
53% of the population are women and the median age is 22, with 51% of the
population being between the ages 18 and 64 years.

In terms of the age pyramid below the female population is substantially larger than
male population. The segment of the population with the highest number of people is
between the ages of 5 to 14, followed by 25 to 34.
                                 Population structure, Total, 2019
                                      DC35 Capricorn vs. National

                DC35 Capricorn                      75+
                South Africa                      70-74
                                                  65-69
                                                  60-64
               Male                               55-59                               Female
                                                  50-54
                                                  45-49
                                                  40-44
                                                  35-39
                                                  30-34
                                                  25-29
                                                  20-24
                                                  15-19
                                                  10-14
                                                  05-09
                                                  00-04
      8.0%       6.0%          4.0%        2.0%        0.0%         2.0%       4.0%            6.0%
                                                      Source: IHS Markit Regional eXplorer version 1946

97% of the population in Capricorn district are black Africans, followed by 2% whites,
1% coloureds and some 5 598 Indians/Asian.

3.1.3 Households
According to the 2016 Community Survey there were 378 301 households in
Capricorn, by 2019 there were 391 006 households. This is 24% of the total number
of households in Limpopo and 2.3% of the total households in South Africa. The
PROFILE: CAPRICORN DISTRICT 13 average household size in 2008 decreased from approximately 3.9 individuals per household to 3.5 persons per household in 2018. 49,1% of the households are headed by women. In Blouberg this constitutes 57% of the households, 56% in Lepelle-Nkumpi, 55% in Molemole and 45% in Polokwane. 5 201 households are headed by children. 3.1.4 Health Profile According to the Department of Health, the three highest causes of death for children under the age of 5 are: lower respiratory infections (22.3%), Diarrhoea (21.2%), and pre-term birth complications (8.9%). The top two causes of death for young women and men between the ages 15-24 are road injuries at 13.3% and HIV/Aids (11.3%). In the age group 25 to 64, the top causes of death for males and females are HIV, TB and lower respiratory infections. With regard to HIV, there are 70 710 people infected with HIV in Capricorn, this constitutes and 21.48 and 1.68% of people infected with HIV in Limpopo and South Africa respectively. The HIV/AIDS infected population represents 5.19% of the district total population in 2016. Amongst the HIV infected people 3048 are infected with TB. In addition, the top 3 causes of death affecting women in the childbearing age group are: hypertension in pregnancy (28.5%), other maternal (24.2%) and indirect maternal (18.5%). In terms of facilities, the District has a total number of 96 clinics, 6 District hospitals and 0 regional Hospital. These facilities render comprehensive health care package to communities the District.
14
          PROFILE: CAPRICORN DISTRICT

3,1,5 Covid-19
Number of cases
As of 07 June 2020, the Capricorn District municipality had recorded 41 Covid- 19
positive cases with 14 active cases, 27 recoveries and 2 death.

The Council for Scientific and Industrial Research (CSIR) in collaboration with Albert
Luthuli Centre for Responsible leadership have developed a set of COVID-19
Vulnerability Indicators using available data and knowledge. It identifies vulnerabilities
present in communities and identifying areas in need of targeted coordinated
interventions and early response. The purpose of the indicators is intended to support
the early prevention/mitigation and preparedness phase of the disaster management
cycle and informing disaster management decision making. It is not based on
epidemiological modelling but a response to highlighting intervention areas due to
underlying situation. The composition of the index follows two main factors, namely:
transmission potential and health susceptibility.

Transmission potential areas identify areas that prevent social distancing to be
practiced and where limitations of practicing good basic hygiene. The health
susceptibility index denotes areas where large number of people are potential more
susceptible to being adversely affected by COVID-10 due to factors such as age and
underlying health conditions. The Capricorn vulnerability profile is presented below.
The map shows low vulnerability areas (blue dotted areas) versus areas with higher
vulnerability (red dotted areas)
PROFILE: CAPRICORN DISTRICT 15
Given the highlighted social and infrastructure challenges, as well as population
density, the areas around Polokwane in Seshego in particular display some extreme
vulnerabilities. The areas around the City of Moria and Ngwanamago also show some
concern. Area specific live GIS vunerability maps are available curtosy of CSIR at:
https://pta-gis-2-web1.csir.co.za/portal2/apps/opsdashboard/#/390a74fb10844c7a85396e60555a866d
Quarantine Facilities Available and Assessed
A total of 50 facilities assessed in the province of which 36 (18 Public and 18 Private)
are readily available with 2084 beds. Three (03) facilities require minor repairs, while
eleven (11) require major repairs. A total of Three (03) quarantine sites have been
identified within Capricorn District Municipality to curb the spread of Corona virus.
Infrastructure (responding to Covid-19)
(a) Provision of Water and Sanitation
Capricorn District (including Polokwane) received 10 Water Trucks (Tankers) and 209
Water (storage) tanks have been delivered.
(b) Reprioritization of the Budget
A total of 96 projects to the value of R 230,838,265 million have been reprioritized by
municipalities (MIG funded) and of which 40 projects to the value of R 14 million are
being implemented through funding by DBSA/MISA. There are no DBSA/MISA funded
projects to be implemented in Capricorn District.16
PROFILE: CAPRICORN DISTRICT
(c) Social Support
Which regards the distribution of food parcels, total food parcels distributed in the
province to date since the lockdown, increased to 91 384 as at 29 May 2020, this is
the consolidated number of food parcels from DSD, SASSA and Other Donors]
In terms of provisions of hand sanitisers at Taxi Ranks: 24 Taxi Ranks were visited
across the province and three (03) of those were in Capricorn District to assess
compliance. It was observed that there is poor compliance, and this is a risk area as
most people use public transport.
“TRANSMISSION POTENTIAL AREAS IDENTIFY
AREAS THAT PREVENT SOCIAL DISTANCING TO
BE PRACTICED AND WHERE LIMITATIONS OF
PRACTICING GOOD BASIC HYGIENE .”
3.4. Poverty Dimensions
3.4.1 Distribution
In 2019, there were 680 841 people living in poverty, using the upper poverty line of
R1 227 per person per month, across Capricorn District Municipality - this is lower than
the 705 924 in 2009. The percentage of people living in poverty has decreased from
75.05% in 2008 to 65.75% in 2018. If the lower poverty line of R810 per person per
month is utilised, then just under 50% of the population lives in poverty.
Number and percentage of people in Poverty
2009-2019
800,000 60.0%
700,000
50.0%
600,000
40.0%
500,000
400,000 30.0%
300,000
20.0%
200,000
10.0%
100,000
0 0.0%
2009 2010 2011 2012 2013 2014 2015 2016 2017 2018 2019
People below the lower poverty line % below the lower poverty line
In 2016, the SAMPI headcount poverty for Capricorn stood at 8,5% against the national
average of 7%. In terms of the percentage of people living in poverty for each of thePROFILE: CAPRICORN DISTRICT 17
regions within the District, Blouberg has the highest percentage of people living in
poverty, using the upper poverty line definition, with a total of 79.1%. The lowest
percentage of people living in poverty can be observed in the Polokwane with a total
of 60.2% living in poverty, using the upper poverty line definition.
3.4.2 Inequality
The Gini-coefficient of the Capricorn District is 0,60 which represents severe income
inequality.
Inequality at District level
0.62
0.61
0.60
0.59
0.58
0.57
0.56
0.55
0.54
0.53
0.52
Mopani Vhembe Capricorn Waterberg Sekhukhune
2009 2013 2016 2019
The average annual household income is R14 600 which is about half of the national
average. 73% of the households earn less than R40 000 per annum and 14% have
absolutely no income.
3.4.3 Employment/Unemployment
In 2018, Capricorn employed 353 435 people which is 26.56% of the total employment
in Limpopo Province (1.33 million) and 2.17% of total employment in South Africa
(16.3 million). Between 2008 and 2018 employment in the district increased annually
at an average rate of 4.16%. Despite this longer term gain there are lesser people
employed that the 354 357 who were employed during 2016. 75,4% of those who are
employed are in the formal sector and 24,6% are in the informal sector. This means
87 258 people were employed by the informal sector during 2016. The Trade Sector
is the largest employer in the informal sector with 41.3% of people employed. The18
PROFILE: CAPRICORN DISTRICT
sector that contributed the most to employment (both formal and informal) was
Community Services (27%), while the least contributing sector was Electricity (1%).
EMPLOYMENT BY SECTOR 2019
Agriculture, forestry and fishing
Mining and quarrying
8% 7% Manufacturing
2%
7%
1% Electricity, gas and water
27% 10% Construction
Wholesale and retail trade, catering and
accommodation
Transport, storage and communication
24%
10%
4% Finance, insurance, real estate and
business services
Community, social and personal services
Households
There is a total number of 81 100 people unemployed in Capricorn, which is a
decrease of 9 620 from 90 800 in 2008. The total number of unemployed people within
Capricorn constitutes 24.13% of the total number of unemployed people in Limpopo
Province. The District experienced an average annual decrease of 1.11% in the
number of unemployed people, which is better than that of the Limpopo Province which
had an average annual decrease in unemployment of 1.09%.
Employment and Unemployment trend in Capricorn 2008 – 2018PROFILE: CAPRICORN DISTRICT 19
400,000
347,578 353,435
335,856
350,000 318,292
296,368
300,000 271,243
249,789 252,476
235,165 238,977 238,367
250,000
200,000
150,000
90,748 83,192 82,474
100,000 73,884 78,324 81,126
65,970 63,366 62,422 64,322 70,511
50,000
0
2008 2009 2010 2011 2012 2013 2014 2015 2016 2017 2018
Unemployment Employment
When comparing unemployment rates among the local municipalities within Capricorn
District Municipality, Lepelle-Nkumpi Local Municipality has the highest unemployment
rate at 26.8%, which has decreased from 37.1% in 2008. It can be seen that the
Polokwane Local Municipality had the lowest unemployment rate of 16.6% in 2018,
which decreased from 27.3% in 2008.
3.4.4 Crime
The table below indicates the number of reported crimes in the 18 police stations within
the district during 2018 and 2019. Of all the reported cases, serious crimes reported
by the community ranked highest followed by theft. There are Community Policing
Forums (CPFs) in all Police Stations and Community Safety Forums (CSFs) in all local
municipalities. Department of Community Safety is currently providing stipends to CPF
and CSF members.
“IT CAN BE SEEN THAT THE POLOKWANE
LOCAL MUNICIPALITY HAD THE LOWEST
UNEMPLOYMENT RATE OF 16.6% IN 2018,”
Crime Statistics for CDM - 2018 and 2019
Crimes 2018 2019 Increased/decreased
Community-reported serious crimes 27630 28198 Increased
All theft not mentioned elsewhere 5750 5890 Increased
Burglary at residential premises 4202 4300 Increased
Drug-related crime 5050 3864 Decreased
Assault with the intent to inflict grievous bodily harm 3221 3192 Decreased
Driving under the influence of alcohol or drugs 1754 2040 Increased
Robbery with aggravating circumstances 1894 2037 Increased20
PROFILE: CAPRICORN DISTRICT
Crimes 2018 2019 Increased/decreased
Common assault 1990 1916 Increased
Malicious damage to property 1829 1821 Decreased
Burglary at non-residential premises 1586 1615 Increased
Theft out of or from motor vehicle 1717 1555 Decreased
Shoplifting 1058 1234 Increased
Commercial crime 1056 1164 Increased
Sexual offences 970 968 Decreased
Common robbery 915 944 Increased
Stock-theft 733 821 Increased
Rape 793 810 Increased
Robbery at non-residential premises 409 471 Increased
Sexual offences detected as a result of police action 225 406 Increased
Robbery at residential premises 354 278 Decreased
Murder 274 254 Decreased
Theft of motor vehicle and motorcycle 214 229 Increased
Attempted murder 155 178 Increased
Illegal possession of firearms and ammunition 116 168 Increased
Carjacking 107 92 Decreased
Arson 66 80 Increased
Sexual assault 106 81 Decreased
Attempted sexual offences 60 60 Same
Contact sexual offences 11 17 Increased
Robbery of cash in transit 4 2 Decreased
Truck hijacking 3 1 Decreased
Bank robbery 0 0 Same
Number of Police Stations in CDM
Municipality Police Stations Police Satellite Police Magistrate
Stations Stations Courts
Blouberg Senwabarwana , Maleboho, Tolwe, Alldays, Saamboubrug 05 00 05
Lepelle-
Zebediela, Magatle, Lebowakgomo 03 01 01
Nkumpi
Molemole Morebeng, Mogwadi, Botlokwa 03 02 02
Seshego, Polokwane, Mankweng, Sebayeng, Westenburg,
Polokwane 07 01 03
Matlala, Mashashane
Capricorn Total 18 04 12
3.5 Education and Skills Profile
In the Capricorn District the number of people without any schooling decreased from
132 373 (2009) to 74 907 (2019). Despite this it that 12% of the population above 20
years have no schooling. In the same period the number of people within the 'matric
only' category, increased from 89 673 to 211 695. Also 41% have matric or higher
qualifications, this is an increase from 26 729 to 73 042 in the same period, while
number of people with a 'matric and a Bachelor's' degree increasing from 10 282 to 32
898. Overall improvement in the level of education is visible with an increase in the
number of people with 'matric' or higher education. 4% of the population has
postgraduation qualifications.PROFILE: CAPRICORN DISTRICT 21
Progress in Education
DC35 Capricorn, Total
100%
Matric & Postgrad
90% degree
Matric & Bachelors
80% degree
Matric & certificate /
70% diploma
Matric only
60%
Certificate / diploma
50% without matric
Grade 10-11
40%
Grade 7-9
30%
Grade 3-6
20%
Grade 0-2
10%
No schooling
0%
1997 1999 2001 2003 2005 2007 2009 2011 2013 2015 2017 2019
Source: IHS Markit Regional eXplorer version 1946
In relation to educational facilities, the district has a total number of 541 primary
schools, 342 secondary schools, 5 combined schools, 14 special schools, 489 ECDs
and 22 institutions of higher learning.
Educational Facilities
Local Secondary Primary schools Combined Special ECD Higher
Municipalities schools schools Schools Centres Institutions
Polokwane 156 schools- 253 schools- 2 schools- 9 schools 208 16 FET Colleges
70 770 Learners 118 100 Learners 2 549 Learners 2 Universities
(Limpopo &
Unisa)
1 Technicon
(TUT)
Molemole 41 schools- 64 schools- 1 school- 1 school 49 1 TVET
18 118 Learners 27 115 Learners 676 Learners (Ramokgopa)
Blouberg 73 schools- 120 schools- 1 school- 2 schools 99 1 TVET
23 476 Learners 38 625 Learners 317 Learners (Senwabarwana)
Lepelle-Nkumpi 72 schools- 104 schools- 1 school- 2 schools 133 1 TVET
27 007 Learners 47 707 Learners 506 Learners (Lebowakgomo)
Capricorn 342 541 5 14 489 22
Source: Department of Education, 2018
The Northern Muslim School in Capricorn South and St George College in Mopani
West are the only 2 schools in Limpopo to have achieved a 100% pass rate since
2015.
Challenges experienced in improving skills and education in the Capricorn District
include:22
PROFILE: CAPRICORN DISTRICT
• High teenage pregnancy rates
• Dilapidated schools
• Lack of sufficient classrooms to accommodate all learners
• Lack of water and sanitation facilities at schools
• Poor access roads to schools
• Later arrival of learner materials, e.g. Books and desks
4. Drivers Of The Economy
4.1 Structure of the Economy
In 2019, the community services sector was the largest within district
accounting for R 29 billion or 33% of the total GVA in the district
municipality's economy. The sector that contributed the second most
to the GVA of the district was trade at 21.4%, followed by the finance
sector with 19.5%. The sector that contributed the least to the economy
of the district was the agriculture sector with a contribution of
R 1.66 billion or 2% of the total GVA.
GVA-R Sectoral composition
DC35 Capricorn, 2019
9 Community
services 1 Agriculture
33% 2%
2 Mining
8 Finance 9%
19%
3 Manufacturing
4 Electricity 3%
3%
7 Transport 6 Trade 5 Construction
7% 21% 3%
Source: IHS Markit Regional eXplorer version 1946PROFILE: CAPRICORN DISTRICT 23
24
                    PROFILE: CAPRICORN DISTRICT

The major business centre in the District is Polokwane City with nodal points dotted
throughout the District. Polokwane Local Municipality contributes 73% to the Capricorn
District economy.
Polokwane is also the largest metropolitan complex in the north and a major economic
centre. Its proximity to the neighbouring countries of Botswana, Zimbabwe,
Mozambique and Swaziland, as well as its convenient distance from the Kruger
National Park and Magoebaskloof make it a perfect gateway to Africa and attractive
tourist destination in itself.

4.2. Primary Sectors
The primary sector consists of two broad economic sectors, namely the mining and
agriculture sectors. Between 2008 and 2018, the agriculture sector experienced the
highest positive growth in 2008 with an average growth rate of 21.9%. The mining
sector reached its highest point of growth of 9.0% in 2010. The agricultural sector
experienced the lowest growth for the period during 2016 at -7.2%, while the mining
sector reaching its lowest point of growth in 2009 at -14.3%.1

                                              Gross value added (GVA) by agriculture and mining
                                                                  2008-2018

               21.9%
                                                                                                     20.6%

                                       9.0%                          6.7%
                                                                             7.0%
                                                  4.8%                5.7%                           4.1%
                                                  2.5%                               2.8%
                1.3%                   0.6%                1.2%                      1.3%
                           0.1%                                              -0.6%                           -0.2%
                2008        2009       2010       2011     2012-1.8% 2013    2014    2015    2016    2017     2018 -2.3%
                                                                                             -5.4%
                                                                                             -7.2%

                          -14.3%                    Agriculture     Mining
                                          Source: IHS Markit Regional eXplorer version 1803

Both the agriculture and mining sectors are generally characterised by volatility in
growth over the period. High Agricultural potential exists in:
   • The Natse River in the Blouberg LM;
   • The Nokayamantala and Matlala River;
   • The Sand River in Molemole LM;
   • The Diepriver in Polokwane LM ; and
   • The Olifantsriver in Lepelle-Nkumpi.

1   IHS Markit Regional eXplorer version 1803
PROFILE: CAPRICORN DISTRICT 25 The main type of agricultural activity engaged in by agricultural households in the district is largely confined to animals only, crops only or mixed farming. Blouberg engages more in animal production. Livestock ownership in the CDM is dominated by poultry ownership, with key municipalities being Polokwane, Molemole and Lepelle- Nkumpi. The scale of livestock production is also a significant inference on the sophistication of livestock value chains in the CDM. In cattle production, subsistence farming (1-10 cattle) is the mainstay of the district, especially in Lepelle-Nkumpi and Polokwane Local Municipalities. Commercial cattle production (+100) is highly minimal, with marginal production in Molemole Local Municipality (2%). Sheep production is mainly done at subsistence level throughout the district. Commercial sheep production is marginally practised in Molemole (3%) and Polokwane (3%).2 Mining activities are concentrated in Lepelle-Nkumpi, which is known to form part of the platinum mining cluster on the Dilokong Corridor. Mining contributes minimally to the district economy; however, it contributes significantly to the economy of the Lepelle-Nkumpi as it has more mining potential and operations which include: • LONMIN in Ga-Mphahlele which specializes in platinum, chrome and granite; • Rooibosch Mining operation in Zebediela; • Granite mining operation; and • Diepsloot mining operation. Blouberg also has potential for platinum mining around Harrieswith. The Molemole is known for its granite mining, while Polokwane has silicon potential and reserves of platinum and iron that could be exploited. The mining sector in the Capricorn DM gives rise to the potential for SMME‟s, especially in support of those businesses linked to the mining industry. 4.3. Secondary Sectors The secondary sector consists of three broad sectors namely manufacturing, electricity and the construction sector. These collectively contribute less than 10% to the Capricorn economy. The manufacturing sector is largely present in the Polokwane City/Seshego cluster this is because the other municipalities are largely rural which generally means the secondary sectors are fairly retracted. Currently, horticultural products are processed in Gauteng and then transported back to Limpopo Province for consumption, thus the development of agro-processing industries can and should definitely be one of the industrial focus areas. 4.4. Tertiary Sectors The tertiary sector consists of four broad economic sectors the trade, transport, finance and community services sectors. A specific regional economy has a comparative 2 Department of Rural Development. 2016. Capricorn Comprehensive Rural development Plan.
26
           PROFILE: CAPRICORN DISTRICT

advantage over other regional economies if it can more efficiently produce the same
good. The location quotient is one way of measuring this comparative advantage. For
2018 Capricorn District has a comparative advantage in the trade, community services
and mining sectors.

                            Location Quotient by broad economic sectors
                                      Capricorn vs. national, 2018
     1.6
     1.4
     1.2
     1.0
     0.8
     0.6
     0.4
     0.2
     0.0

       Capricorn      National Total
                                  Source: IHS Markit Regional eXplorer version 1803

4.4.1 Trade
Wholesale, retail, trade, catering and accommodation (Wholesale, Retail and Trade)
can be broken up into wholesale which refers to the sale of goods in bulk at a discount
to merchants for resale to retailers; industrial, commercial, institutional or professional
users; or other wholesalers. The major business centre in the District is Polokwane
City. Secondary centres are scattered throughout the District (Nodal Points) but there
is a noticeable lack of any other large scale business/ retail/ commercial activity in the
remaining parts of the district area.

4.5 Tourism
The Capricorn DM identified the tourism sector as one of its economic drivers in its
Integrated Development Plan (IDP). 88% of the tourists visiting the district are
domestic.

The Blouberg area has been identified to have more potential in this sector when
compared to the other local municipalities in CDM. Travellers are fascinated by the
diversity of the region, its grassy plains, bush-veld and misty mountains. The district
comprises of forests, cultural villages, dams, art, game and monuments, all that a
region needs to attract tourists. It has beautiful and diverse landscapes which also
PROFILE: CAPRICORN DISTRICT 27
attract travellers and makes it a favourite destination for leisure and adventure. The
following activities form part of tourism development:
• Air Experience – Charter flight and micro lighting;
• Culinary Experience – African Food, Coffee shops, Family restaurants, pubs,
etc.;
• Accommodation - CDM offers a large number of accommodation options
varying from rustic camps to chalets located closer to nature attractions, to the
most luxurious accommodations;
• Land Activities – Caving, hiking, canoeing, mountain biking, paintball, etc.;
• Wildlife Experience – Birding, game drives, hunting, walking safaris; and
• Culture and Heritage - Art galleries, museums, heritage centres.
Capricorn District Municipality had a total tourism spending of R 7.14 billion in 2018
with an average annual growth rate of 11.4% since 2008 (R 2.43 billion).
5. Service Delivery
5.1. Water and Sanitation
80,1% of the population, which is 298 264 households receive their
water from a regional or local service provider. The two main providers
are the Capricorn District which is a Water Service Authority that is
being assisted by Lepelle Northern Water. The district has a water
quality laboratory in Mankweng at the University of Limpopo.
Polokwane LM is a Water Service Authority and a Water Service
Provider. The other three local municipalities within the District are
serving as Water Services Providers (WSP). Service Level Agreements
were signed with three Local Municipalities (Blouberg LM, Lepelle-
Nkumpi LM and Molemole LM) serving as WSP for the revenue
collection. Only 47% receive piped water inside their yards and Lepelle-
Nkumpi has the lowest access at 70,8% of the households receiving
water.28
PROFILE: CAPRICORN DISTRICT
Water
69% of the population still use pit latrines and 2% have no access to any toilets.
Distribution of Households with Access to Sanitation in CDM, 1996 – 2016
Percentage Households with Access to Sanitation Backlog
Municipality
1996 2001 2007 2011 2016 2016
Blouberg 3.2 4.1 1.5 9.0 8.5 91.5%
Aganang (Disestablished) 0.6 1.7 2.5 3.0 1.8 98.2%
Molemole 7.8 13.4 16.7 16.2 17.8 82.2%
Polokwane 27.2 34.9 35.2 44.1 48.2 51.8%
Lepelle-Nkumpi 12.5 17.3 14.1 19.6 21.2 78.8%
Capricorn District 15.1 21.8 21.1 29.1 33.2 66.8%
Source: STATS SA Census 1996, 2001, 2011 and Community Survey 2007 and 2016
Blouberg LM has the highest proportion of households with flush/chemical followed by
Molemole LM. In Limpopo, municipalities with the lowest proportion of households with
improved sanitation are Makhuduthamaga at 4, 6%, followed by Blouberg and Greater
Letaba local municipalities at 4, 6% and 8, 0%, respectively.PROFILE: CAPRICORN DISTRICT 29
Sanitation backlog
200,000 196454 195330 2008-2018
189712
190,000
182088
180,000 173917
171078
169083 168400
167427 166688
170,000 163999
160,000
150,000
140,000
2008 2009 2010 2011 2012 2013 2014 2015 2016 2017 2018
Source: IHS Markit Regional eXplorer version 1803
Waste Water Treatment Works within Capricorn
Municipality Waste Water Treatment Work Status
• No operational plan.
Polokwane Seshego Sewage Works
• Pump blockages because of too much sand received.
• Effluent not channelled to maturation ponds.
• Broken automated screen and settling tanks.
• Licensed & operational Plan available
Polokwane Sewage works
• Adequate equipment.
• Effluent analysis done.
• Plant upgrading
• No License & No operational plan
Mankweng Sewage Works
• Effluent analysis not done
• Flow meter not functioning.
• Effective access control.
• No operation plan.
Lepelle Lebowakgomo Sewage Works
Nkumpi • Inadequate equipment.
• Effluent analysis not done
• Vandalized fence and gates
• No license & no operational plans
Zebediela 1 Stop Filling Station Sewage
Works • Effluent not analysed.
• No license & no operation plan.
Lebowakgomo Zone B and F Oxidation
Ponds • Effluent analysis not done.
• Floating debris.
• Effluent is discharged into artificial wetland.
• Flow meter not functioning properly.
• No license & operation plan
Magatle Oxidation Ponds
• No operator onsite.
• Domestic animal grazing inside the facility.
• No license & no operational plan.
Blouberg Senwabarwana Oxidation Ponds
• Effluent analysis not done.
• Excessive vegetation.
• No license no operational plan.
Alldays Sewage Works
• Excessive vegetation
• No remarkable improvement instead raw effluent is discharged into the
environment.
• Effluent analysis not done.
• No License & operation plan.
Molemole Mogwadi Oxidation Pond
• Effluent analysis not done30
PROFILE: CAPRICORN DISTRICT
Municipality Waste Water Treatment Work Status
• No License & Operational Plan
Morebeng Sewage Works.
• Effluent analysis not available.
• No license & operational plan.
Molemole Oxidation Ponds.
• Abandoned & Effluent analysis not done,
• No operator.
5.2. Human Settlements
93% of the households are formal dwellings. Lepelle-Nkumpi has the highest
percentage of traditional and informal dwellings. Capricorn District has 3,8% informal
dwellings and 1,6% traditional dwellings.
When looking at the formal dwelling backlog over time, the number decreased annually
by 2.48%.
Formal dwelling backlog
2008-2018
30,000
25,000
20,000
15,000
10,000
5,000
0
2008 2009 2010 2011 2012 2013 2014 2015 2016 2017 2018
Formal dwelling backlog
Source: IHS Markit Regional eXplorer version 1803
5.3. Electricity
According to Community Survey 2016, 96% of households have access to electricity
while 4% do not have access to electricity and use other sources of energy such as
gas, paraffin, candles, solar etc. The percentage of households with access to
electricity has increased from 33% in 1996. 91% of these households have an inhouse
prepaid meter. A large number of households still rely on firewood for cooking andPROFILE: CAPRICORN DISTRICT 31
heating due to electricity costs. This is a concern as the cutting of trees for energy
provision leads to deforestation and soil erosion.
Electricity is largely generated and distributed by ESKOM. However, Blouberg and
Polokwane LMs are electricity services providers (electricity license holders). The
highest backlog is in Polokwane with 5,2% of the households not having electricity,
which is down from the 42,6% registered in 1996. The backlog in Blouberg is 2,2% in
Molemole 2,2%, in the disestablished Aganang and 2% in Lepelle-Nkumpi.
5.4. Waste Management
Only 25% of the households receive refuse disposal from the local governments or a
service provider. 2,3% utilise a communal dump system. The majority (64%) utilise
their own dumping sites, which presents an environmental hazard and challenge.
Waste Collection Services and Landfill/Waste Disposal Sites in CDM
Municipality Township collection Rural areas collection Permitted/ Not permitted/
Licensed landfill site Illegal
Blouberg ▪ Alldays ▪ Dilaneneng, ▪ Senwabarwana None
▪ Senwabarwana ▪ Avon, ▪ Alldays
▪ Desmond park ▪ Indermark,
▪ Extension 5 ▪ Burggerught,
▪ Motlana,
▪ Kromhoek,
▪ Devrede,
▪ Grootpan,
▪ Longden,
▪ Taaibosch,32
PROFILE: CAPRICORN DISTRICT
▪ Witten,
▪ Raweshi,
▪ Eldorado,
▪ Machaba
Lepelle-Nkumpi ▪ Lebowakgomo ▪ Mathibela Lebowakgomo/Lenting None
▪ Rakgoatha
▪ Mankweng
▪ Mamaolo
▪ Matome
Molemole ▪ Mogwadi No formalized collection except usage ▪ Mogwadi None
▪ Morebeng of EPWP programmes. ▪ Morebeng
Polokwane ▪ Polokwane EPWP waste collection in 19 wards ▪ Weltevreden None
▪ Seshego ▪ Ga-Ramoshoana
▪ Mankweng
▪ Sebayeng
5.5. Roads and Transport
The total road network for the district is 4 506 km, with 1 223 km paved and 3 283 km
gravelled/unpaved. This means only 27% of then roads are paved.
With regard to the supply for public transport, a variety of transport facilities are in use
in the district. The major public transport services are bus and taxi operations. There
are 4 subsidised bus operations within the district i.e. Bahwaduba, Kopano, Madodi,
and Great North. The bus industry is weakened as a result of insufficient government
funding and internal management capacities. The taxi industry is well established, and
it augments the minimal bus network. Passenger rail over shorter distances is not
available but there is a functionary cargo network which services the regional market
with an emphasis on Botswana and Zimbabwe. A majority rely on non-motorised
transport (NMT’s) – e.g. donkey carts and bicycle, used in rural areas as an alternative
mode of transport. Light delivery vehicles (LDV’s) are also generally used as public
transport. There is no e hailing system and metred taxi’s only operate in the City of
Polokwane. There is also an international airport which largely services the domestic
market from OR Tambo International in Johannesburg.
According to CDM Integrated Transport Plan, current transport supply numbers are;
107 taxi facilities within CDM, of which more than 8% are informal, 285 taxi routes, and
approximately 50% of the routes are in the Polokwane Local Municipality, 180 bus
routes in the CDM, 196 subsidised buses in operation and 27 taxi associations with
approximately 3063 taxi vehicles. Poor road conditions are a significant factor on the
operating life span of the vehicles, operating costs, and level of service to the
passenger. Transport system is not flexible to respond to customer requirements.PROFILE: CAPRICORN DISTRICT 33
6. Governance
6.1. Municipality Performance
All municipalities received findings on high levels of irrecoverable debt,
and current liabilities exceeding 10% of the following year’s budgeted
resources. The Auditor-General over the past five years.
Municipality 2014/15 2015/16 2016/17 2017/2018 2018/2019
Blouberg Qualified Qualified Qualified Qualified Qualified
Lepelle-Nkumpi Qualified Qualified Qualified Qualified Qualified
Molemole Unqualified Unqualified Unqualified Unqualified Unqualified
With findings with findings with findings with findings with findings
Polokwane Unqualified Unqualified Qualified Qualified Pending
with findings with findings
Capricorn Unqualified Unqualified Unqualified Unqualified Unqualified
with findings with findings with findings with findings without
findings
6.2. Municipal Capacity
One of the measures of effective governance is the extent that municipalities have staff
to perform their required duties. This also assumes that staff is suitable qualified for
the respective positions. The total number of staff (including managerial positions) per
municipality is illustrated below:
Total Number of Staff per Municipality
Full-time Part-time Vacant posts Total % Filled
Municipality 2017* 2018 2017* 2018 2017* 2018 2017* 2018 2018
Blouberg 188 213 0 0 43 48 231 261 81.6%
Lepelle-Nkumpi 233 238 0 0 17 27 250 265 89.8%
Molemole 165 173 0 0 7 25 172 198 87.4%
Polokwane 1764 1928 10 11 381 250 2155 2189 88.6%
Capricorn District 571 567 0 0 8 94 579 661 85.8%
Total 2921 3119 10 11 456 444 3387 3574
According to an assessment conducted by the Municipal Demarcation Board in 2018,
there are 32 Engineers and engineering technologists, 293 planners and planning
technicians, 3 qualified accountants and 34 environmental officers across the
municipalities within the district.
Number of Engineers, Planners, Accountants and Environmental Officers
Capricorn Blouberg Molemole Lepelle- Polokwane
Nkumpi
Qualified engineers and engineering 10 4 7 4 7
technologists
Qualified planners and planning 3 5 3 3 15
technicians
Qualified accountants 2 0 0 0 1
Environmental officers 4 3 2 0 12834
PROFILE: CAPRICORN DISTRICT
6.3. Traditional Affairs Governance
The following table illustrates the participation rate of the traditional leaders in Council
meetings as reported by the municipalities.
Traditional Councils that Participate in Municipal Council Meetings
Municipality Name Traditional Authority
1. Kgoshigadi MRM Mothapo Bakgaga (Ga-Mothapo)
2. Kgoshigadi AR Chuene Ditlou-Machidi (Ga-Chuene)
3. Kgoshi MS Dikgale Bakone (Ga-Dikgale)
4. Kgoshigadi PR Ledwaba Ga-Ledwaba
Capricorn District 5. Kgoshi KS Moloto Moletji
Municipality 6. Kgoshigadi MR Manthata Manthata (Ga-Manthata)
7. Kgoshi KO Lebogo Kibi
8. Kgoshi NI Malebogo Ga-Maleboho
9. Kgoshi SA Seakamela Seakamela
10. Kgoshigadi L.R. Matlala Ga-Matlala
Blouberg Local 1. Kgoshi Makgato Ga-Makgato
Municipality
1. Kgoshi Thobejane Mafefe
2. Kgoshi Mathabatha Mathabatha (Ga-Mathabatha)
3. Kgoshigadi Mphahlele Mphahlele (Ga-Mphahlele)
Lepelle-Nkumpi Local
4. Kgoshigadi Chuene Ditlou-Machidi (Ga-Chuene)
Municipality
5. Kgoshigadi Ledwaba Ga-Ledwaba
6. Kgoshi Sello Kekana Iii Zebediela Ndebele (Zebediela)
7. Kgoshigadi Seloane Batau Ba Ga-Seloane
Molemole Local 1. Kgoshi Ramokgopa Ramokgopa
Municipality 2. Kgoshi Machaka Machaka
1. Kgoshi Mothiba Mothiba (Ga-Mothiba)
2. Kgoshi DC Maja Maja (Ga-Maja)
Polokwane Local
3. Kgoshi MG Makgoba Makgoba (Ga-Makgoba)
Municipality
4. Kgoshi MR Mamabolo Bjatladi (Mamabolo)
5. Kgoshigadi MV Mamabolo MankwengPROFILE: CAPRICORN DISTRICT 35
7. Projects To Diversify And Grow
People And The Economy
7.1. Social Development
Social development projects in Capricorn District include the following:
Department Project description Budget Financial
year
Basic Education No fee learners and schools R492,650,750 2019/20
Eskom Energy R37,146,044.02 2019/20
Sedikong Agribusiness development: R1, 500 000 2019/20
Environmental Affairs
Lepelle-Nkumpi
Department Of Sport, Arts Construction of Seleteng Library Lepelle- R16,870,000 2019/20
And Culture Nkumpi; Capricorn
Maintenance of Aganang Library; District
Sport Development Games; District
Indigenous Games; District Junior Dipapadi
Polokwane Capricorn;
District Schools Sport Tournaments
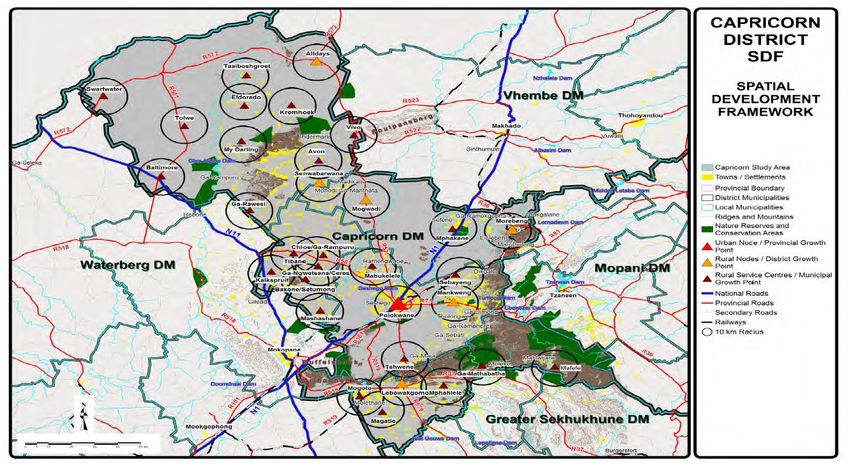
7.2. Spatial Development
The table below shows categories of growth points within the district as per the district’s
Spatial Development Framework. All categories classified as growth points should be
stimulated according to their status in the hierarchy by amongst others, providing
higher levels of service infrastructure, and ensuring that appropriate services are
available for potential business and service/light industrial concerned.
Capricorn Nodal Hierarchy as per Capricorn SDF, 2017
Nodal Point Area Municipality
Provincial Growth Points Polokwane/Seshego Polokwane LM
District Growth Points Lebowakgomo Lepelle-Nkumpi LM
Mankweng Polokwane LM
Senwabarwana (Bochum) Blouberg LM
Municipal Growth Points Morebeng (Soekmekaar) Molemole LM
Mogwadi (Dendron) Molemole LM
Alldays Blouberg LM
Rural Nodal/ Service Points Mphakane Molemole LM
Ga-Rampuru Polokwane LM
Ga-Mashashane Polokwane LM
Sebayeng Polokwane LM
Mogoto Lepelle-Nkumpi LM
Vivo Blouberg LM
Eldorado Blouberg LM
Tolwe Blouberg LM
Source: Capricorn District SDF, 2017
The map below provide spatial representation of the above listed Nodal Hierarchy of
the district.36
PROFILE: CAPRICORN DISTRICT
Source: Capricorn District SDF, 2017
Some of the key spatial projects to help support development in the aforementioned
nodes include the following:
Project Municipality/Funder 2019/2020 2020/2021 2021/2022
Township establishment at CDM 1,500,000 395,000 553,500
Farm Volgestruisfontein 667
LS
Township establishment – CDM 395,000 738,000
Aganang extension
Township establishment at CDM 1,500,000 1,777,500 553,500
portion 151-160 of the Farm
Sterkloop 688
Urban renewal Projects: CDM 335,000 592,500 1,845,000
Polokwane Municipal Towers
7.3. Infrastructure Projects
The major infrastructure projects within the district are discussed below:
In Molemole, the district will invest R90.2 million for implementation of Sephala,
Mokopu, Thoka, Makwetja Regional Water Supply project, which is going to benefit the
following villages, Sephala in Ward 3, Mokopu in Ward 3, Thoka in Ward 3 and
Makwetja in Ward 3. Water Service Infrastructure Grant project is being implemented
at Machabaphala (Ward 15) and will soon be completed. The projects will benefit 5,499
households once completed.
In Blouberg, the district will invest R117.5 million implementing the following water
projects in Senwabarwana Bulk Water (Ward 19); Burgerreght/ Motlana/ The Grange
(all in Ward 13); Langlaagte (Rammutla)/ Vergelegen water project (Ward 5);PROFILE: CAPRICORN DISTRICT 37
Lethaleng, Puraspan (Ga Machaba) (all in Ward 11) Ext water supply; We are also
implementing water projects through Water Service Infrastructure Grant in the
following areas; Earlydawn (Ward 1), Mankgodi (Ward 21), Ngwanallela (Ward 22),
Maokeng (Ward 8), Kromhoek GaMakgato (Ward 15), Nailana (Ward 8), Maokeng,
Kromhoek (Ward 15), Manaka (Ward 9) and Ngwanallela (Ward 22); The progress on
all these projects is between 77% and 90% and will benefit a total of 4872 households;
Avon is part of WSIG programme in 2019/20 financial year in order to address water
challenges in the area.
The District has signed an agreement with Waterberg JV Resources Pty Ltd Mine
operating in Blouberg to jointly develop a water supply management plan to increase
the water supply and infrastructure capacity for both the local community and the Mine.
The Municipality and the Mine will work together in this venture in which the Mine will
avail the sole capital funding for the project while the Municipality will deploy technical
resources to identify potential water sources.
In Lepelle Nkumpi, the district will invest R420 million for implementation of regional
water schemes which are anticipated to be completed by the next financial year -
Groothoek (Lebowakgomo Zone B) (Ward 15) water supply to benefit 16, 858
households, Groothoek Gedroogte (Ward 3) water supply to benefit 918 households,
as well as Mphahlele (Bolatjane (Ward 23), Phalakwane (Ward 23), Makurung (Ward
21) and Dithabaneng (Ward 21)) regional water scheme which will benefit 4070
households.
7.4. Economic Projects
The establishment of Mega Agri- Parks, one per district municipality, follows the
pronouncement by the Minister of Rural Development and Land Reform. An Agri-Park
is an agglomeration of agricultural cultivation, packing, processing, storage and
marketing of agricultural commodities in a central location such as an economic hub.
For Capricorn District Municipality, an area of 4000 hectares at Moletjie, Capricorn Hub
was pledged by Kgoṧi Moloto. Only 500 hectors will be utilised for the establishment
of the Agri- Park. A farmer production site has been identified in Bochum in Blouberg.
7.5. Environmental Forecasting
Below is a list of risks and threats which emanates from a recently completed
Environmental Outlook project as indicated in the 2019/20 IDP:
• Potential problem of climate change influencing the rainfall patterns, which may
have an impact on specie numbers and diversity, food security and water
availability. Climate change predictions indicate an increase in extreme weather
events such as droughts, hail storms and floods;
• Lack of public awareness on environmental matters including alien invading
plants, deforestation and veld fires;You can also read