A Skin Lipidomics Study Reveals the Therapeutic Effects of Tanshinones in a Rat Model of Acne
←
→
Page content transcription
If your browser does not render page correctly, please read the page content below
ORIGINAL RESEARCH
                                                                                                                                              published: 10 June 2021
                                                                                                                                      doi: 10.3389/fphar.2021.675659

                                           A Skin Lipidomics Study Reveals the
                                           Therapeutic Effects of Tanshinones in
                                           a Rat Model of Acne
                                           Tingting Chen 1, Zhaoming Zhu 1, Qunqun Du 1, Zhuxian Wang 1, Wenfeng Wu 1, Yaqi Xue 1,
                                           Yuan Wang 1, Yufan Wu 1, Quanfu Zeng 1, Cuiping Jiang 1, Chunyan Shen 1, Li Liu 1,
                                           Hongxia Zhu 2* and Qiang Liu 1*
                                           1
                                            School of Traditional Chinese Medicine, Southern Medical University, Guangzhou, China, 2Integrated Hospital of Traditional
                                           Chinese Medicine, Southern Medical University, Guangzhou, China

                                           Tanshinone (TAN), a class of bioactive components in traditional Chinese medicinal plant
                                           Salvia miltiorrhiza, has antibacterial and anti-inflammatory effects, can enhance blood
                                           circulation, remove blood stasis, and promote wound healing. For these reasons it has
                                           been developed as a drug to treat acne. The purpose of this study was to evaluate the
                                           therapeutic effects of TAN in rats with oleic acid-induced acne and to explore its possible
                                           mechanisms of action through the identification of potential lipid biomarkers. In this study,
                           Edited by:
                      Claudio Ferrante,    a rat model of acne was established by applying 0.5 ml of 80% oleic acid to rats’ back skin.
  University of Studies G. d’Annunzio      The potential metabolites and targets involved in the anti-acne effects of TAN were
              Chieti and Pescara, Italy
                                           predicted using lipidomics. The results indicate that TAN has therapeutic efficacy for
                        Reviewed by:
                        Darko Modun,
                                           acne, as supported by the results of the histological analyses and biochemical index
            University of Split, Croatia   assays for interleukin (IL)-8, IL-6, IL-β and tumor necrosis factor alpha. The orthogonal
                     Giustino Orlando,
                                           projection of latent structure discriminant analysis score was used to analyze the lipidomic
  University of Studies G. d’Annunzio
              Chieti and Pescara, Italy    profiles between control and acne rats. Ninety-six potential biomarkers were identified in
                  *Correspondence:         the skin samples of the acne rats. These biomarkers were mainly related to
                        Hongxia Zhu        glycerophospholipid and sphingolipid metabolism, and the regulation of their
                gzzhx2012@163.com
                           Qiang Liu
                                           dysfunction is thought to be a possible therapeutic mechanism of action of TAN on acne.
                liuqiang@smu.edu.cn
                                           Keywords: tanshinone, skin lipidomics, acne, glycerophospholipid metabolism, sphingolipid metabolism

                    Specialty section:
         This article was submitted to     INTRODUCTION
                  Ethnopharmacology,
               a section of the journal    Salvia miltiorrhiza Bunge, a traditional Chinese medicine plant, was first recorded by Zhu Di in “Puji
            Frontiers in Pharmacology      Fang” for acne treatment. Tanshinones (TANs), a class of chemical compounds and the major active
           Received: 03 March 2021         component in Salvia miltiorrhiza Bunge, has also been reported as a treatment for cardiovascular
            Accepted: 10 May 2021          disease (Weng et al., 2013; Maione et al., 2014; Maione et al., 2015; Jia et al., 2016). TAN has been
           Published: 10 June 2021         recently shown to improve the condition of the facial skin by helping to reduce scarring through
                             Citation:     improving blood circulation and promoting cell metabolism (Li et al., 2016). Pharmacological studies
Chen T, Zhu Z, Du Q, Wang Z, Wu W,         show that cryptotanshinone has anti-acne effects (Yu et al., 2016) and Tanshinone IIA has an
Xue Y, Wang Y, Wu Y, Zeng Q, Jiang C,      inhibitory effect on the growth of Propionibacterium acnes (Li and Zhou, 2018). In addition, TANs
Shen C, Liu L, Zhu H and Liu Q (2021)
                                           have exhibited anti-oxidant (Fang et al., 2008; Li et al., 2008; Li et al., 2013), anti-bacterial, anti-
 A Skin Lipidomics Study Reveals the
Therapeutic Effects of Tanshinones in a
                                           inflammatory (Bai et al., 2008; Tang et al., 2011; Chen et al., 2019), and anti-fibrosis (Jiang et al.,
                   Rat Model of Acne.      2019) effects. Furthermore, a recent report has found TAN to regulate tissue repair (Bernut et al.,
        Front. Pharmacol. 12:675659.       2020). Consequently, TAN has been included in the research and development of cosmetic materials
     doi: 10.3389/fphar.2021.675659        (Tao et al., 2013; Natshch et al., 2019).

Frontiers in Pharmacology | www.frontiersin.org                                   1                                            June 2021 | Volume 12 | Article 675659
Chen et al.                                                                                                           Lipidomics of Tanshinone in Acne

    Acne is one of the most common skin diseases and affects                  smaller, coarse granules, weighed and refluxed in 95% ethanol
approximately 85% of the population at some point in their                    (1:10 w/v) for three times, 2 h each time, and filtered (Shen et al.,
lifetimes (Thiboutot et al., 2018). Its pathogenesis is multifactorial        2017b). The filtrates were combined, with ethanol removed by
and includes an increased level and sensitivity of androgen                   decompression, resulting in a thick, concentrated filtrate paste
receptors (Barros and Thiboutot, 2017), excessive sebum                       with relative density of 1.30–1.35 (60°C). This paste was washed
secretion (Li et al., 2017), abnormal ductal keratosis of                     in hot water until colorless, dried at 80°C, and crushed into a fine
sebaceous glands in hair follicles (Das and Reynolds, 2014),                  powder.
and the colonization of Propionibacterium acnes, leading to an                   The TAN gel was produced by dissolving this powder in ethanol,
inflammatory response in the skin (Zouboulis, 2009). A pivotal                 adding carbomer, water and triethanolamine. The TAN gel (100 mg
factor in the aetiopathogenesis of acne is the quantitative and               TAN in 1 g gel) was red-brown in color and transparent.
qualitative modification of skin lipids. Skin lipids play a
significant role in the occurrence of acne lesions
(Makrantonaki et al., 2011), as they can dramatically influence                Qualitative and Quantitative Evaluation
skin condition via different mechanisms, such as maintaining                  of TAN
physical chemistry function, biochemistry function, and                       The qualitative and quantitative analysis of TAN were used
microecology function (Jia et al., 2018).                                     UHPLC-Orbitrap-MS instrument and HPLC with an UV
    Lipidomics, a branch of metabonomics, is the study of the                 detection system, respectively. The specific UHPLC-ESI-MS
properties of all lipid molecules in living organisms (Han and                and HPLC methods used are included in the Supplementary
Gross, 2003). It enables the analysis of lipids by quantifying                Material.
changes in individual lipids, subgroups and molecular species.
Liquid chromatography-mass spectrometry (LC-MS) is an                         Experimental Animals and Acne Model
analysis technique that allows for the comprehensive analysis                 All animal were approved by the Animal Care and Use committee
of lipids and molecular types, including the lipids in lipid cells and        of the Southern Medical University (Approval No. L2019036,
keratinocytes (Kofeler et al., 2012; Zhao et al., 2014). In this study,       Guangdong, China). Adult male Sprague Dawley rats (220 ± 20 g)
changes in the lipidomic profile of the skin were analyzed using               were purchased from the Experimental Animals Center of
the ultra-performance liquid chromatography (UPLC)-Orbitrap                   Southern Medical University. The rats were housed at a
MS system. Similar studies have been performed with respect to                humidity of 40–65%, a temperature of 19–23 °C and a 12 h
cancer, metabolic syndrome and skin diseases (Camera et al.,                  light-dark cycle (Jiang et al., 2007).
2016). UPLC-quadruple time-of-flight-MS is a high-resolution                      The rats were allocated into experimental groups through a
MS technique that can analyze the complete structure of a lipid               randomized block design. All experimental procedures and data
species (van Smeden et al., 2014).                                            analyses were conducted in a blinded fashion. After one week of
                                                                              acclimatization, the rats were randomly selected as control group
                                                                              (C, n  8) or model group. The acne rat model was established by
MATERIAL AND METHODS                                                          applying oleic acid. Briefly, rats were anesthetized using
                                                                              intraperitoneal injections of 3% sodium pentobarbital (Sigma-
Chemicals and Reagents                                                        Aldrich, United States). Their back hair was depilated about
MS-grade methanol, MS-grade acetonitrile and high-                            4 cm2. 0.5 ml of 80% oleic acid (Aladdin Bio-Chem
performance liquid chromatography (HPLC)-grade 2-propanol                     Technology, Shanghai, China) was applied to the back skin
were purchased from Thermo Fisher. HPLC-grade formic acid                     once daily for 14 days. Once the acne model was established,
and HPLC-grade ammonium formate were purchased from                           the acne rats were divided into the acne model group (M, n  8)
Sigma. HPLC-grade acetonitrile was purchased from Merck                       and the TAN gel administration group (T, n  8) according to a
KGaA (Darmstadt, Germany). Analytical-grade pure                              random number control table. The rats in the TAN gel group
phosphoric acid was purchased from Guangzhou Chemical                         received a dose of 1.0 g d−1 for 7 days. The rats in the Control and
Reagent Factory. Reference standards of Tanshinone I,                         Model groups received no TAN gel treatment.
Crytotanshinone, Tanshinone IIA (purity >98%) were
purchased from the National Institutes for Food and Drug                      Histopathological Examination
Control (Beijing, China). Diydrotanshinone I (purity >98%)                    Sections of skin tissues from the rats were fixed in 4% formalin,
was purchased from Guangzhou Qiyun Biotechnology Co.,                         embedded in paraffin, and sliced into 3–5 μm thick sections.
Ltd. (Guangdong, China).                                                      The sections were stained with hematoxylin-eosin for
                                                                              histopathological analysis and observed under a light
TAN and TAN Gel Preparation                                                   microscope (BX53; Olympus).
TANs are major active components of the dried root of Salvia
miltiorrhiza Bunge. The Salvia miltiorrhiza Bunge pieces were
purchased from Guangzhou Weida Chinese Medicine Decoction                     Examination of Serum Inflammatory
Pieces Co. Ltd., (Guangdong, China), Batch number: 201909-3.                  Factors
TANs were extracted and isolated from the pieces through                      Serum samples were centrifuged and the supernatants assayed for
solvent extraction. First, the pieces were pulverized into                    cytokine release using the Cytokine RAT interleukin (IL)-8, IL-6,

Frontiers in Pharmacology | www.frontiersin.org                           2                                     June 2021 | Volume 12 | Article 675659
Chen et al.                                                                                                                    Lipidomics of Tanshinone in Acne

 FIGURE 1 | UHPLC-Orbitrap-MS spectrometry of TAN. Positive(A):
 Salvia miltiorrhiza new quinone B (1), Tanshinaldehyde(2), Dihydrotanshinone        FIGURE 2 | High-performance liquid chromatography chromatogram of
 I(3), Tanshinone IIB (4), dehydromiltirone (5), Tanshinone Ⅰ(6),                    A:standard mixture of 1:Diydrotanshinone Ⅰ, 2:Tanshinone Ⅰ, 3:
 Cryptotanshinone (7), Methylenetanshinquinone (8), Tanshinone IIA (9),              Crytotanshinone, 4: Tanshinone IIA, B:TAN sample.
 Negative(B):Danshin spiroketal lactone (10), Danshenxinkun A (11), Alpha-
 (3,4-dihydroxyphenyl)lactic acid (12).

                                                                                        Simca 14.1 software (Umetrics AB, Umea, Sweden) was used
                                                                                    for the multivariate analysis, including the principal component
IL-1β, and tumor necrosis factor alpha (TNF-α) Kit. The                             analysis (PCA) and orthogonal partial least-squares
detection was conducted according to the kit manual (Shen                           discrimination analysis (OPLS-DA) (Park et al., 2020). All
et al., 2017a).                                                                     lipid species and subclasses were found to have equal
                                                                                    variances and were analyzed using variation multiple analysis
Lipid Extraction and Analysis                                                       and t-tests.
Lipids were extracted using the methyl tert-butyl ether (MTBE)
method. Briefly, the skin samples were homogenized in 200 µl                         Statistical Analysis
water and 240 µl methanol. MTBE (800 µl) was added to the                           The experimental data were expressed as mean ± standard
homogenized sample, which was then ultrasonicated at 4°C                            deviation (S.D), unless otherwise stated. Statistical analyses
for 20 min and afterward left to stand at room temperature for                      were performed using SPSS statistics software version 21.0
30 min. The solution was centrifuged at 14,000 g at 10°C for                        (SPSS Inc. Chicago, United States). Comparison of the same
15 min, after which the upper layer was collected and dried with                    parameter among groups was analyzed by one-way ANOVA. A
nitrogen. The lipid extracts were re-dissolved for analysis using                   value of p < 0.05 was considered to be statistically significant.
200 µl of a 90% isopropanol/acetonitrile mixture.
   Q-Exactive Plus mass spectrometer (Thermo Fisher Scientific)
was connected to an UHPLC Nexera LC-30A (SHIMADZU) via                              RESULTS
an electrospray ionization ion (ESI) source for the lipid analysis.
The chromatographic conditions were shown in Supplementary                          Quantitative Analysis and Qualitative
Material.                                                                           Composition of TAN
                                                                                    UHPLC-Orbitrap-MS was used to characterize the chemical
Data Analysis and Presentation                                                      TAN composition. The total ion current chromatograms of
“LipidSearch” was used to carry out peak recognition, peak                          the TAN are shown in Figure 1. Twelve major compounds
extraction, and lipid identification (secondary identification) of                    were identified, including amounts of terpene like Salvia
the lipid molecules and internal standard lipid molecules. Both                     miltiorrhiza   new      quinone   B,     tanshinaldehyde,
the precursor tolerance and product tolerance were set at 5 ppm,                    Dihydrotanshinone I, tanshinone IIB, dehydromiltirone,
and the product ion threshold was set at 5%.                                        tanshinone I, cryptotanshinone, methylenetanshinquinone,

Frontiers in Pharmacology | www.frontiersin.org                                 3                                        June 2021 | Volume 12 | Article 675659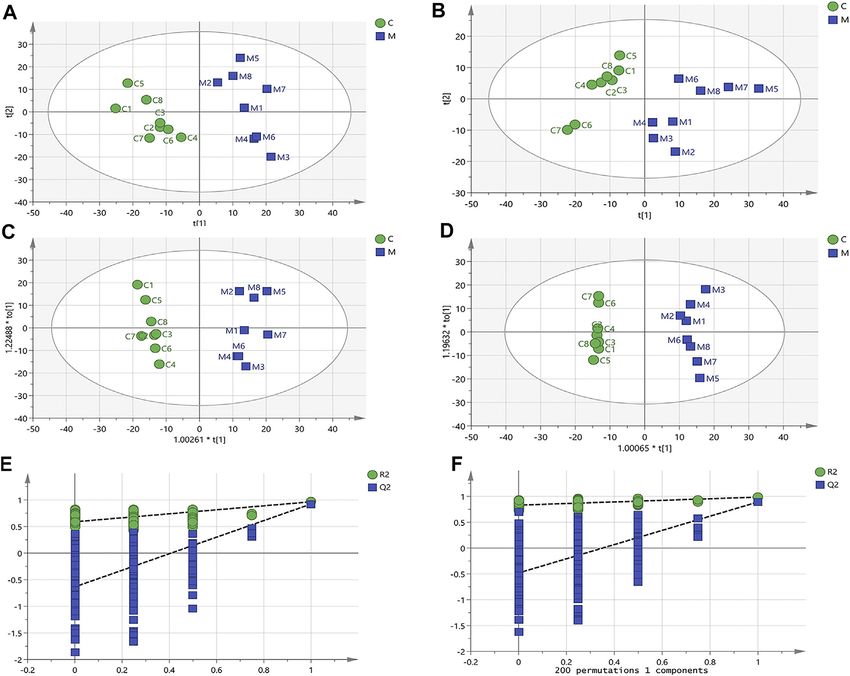
Chen et al. Lipidomics of Tanshinone in Acne
TABLE 1 | Linear range, regression equation, coefficient of determination (r2) and amounts of marker compounds in TAN.
Compound Linear range (µg/ml) Regression equation r2 Amount (mg/g)
Mean RSD (%)
Diydrotanshinone I 1.94–62.00 Y 38.556X−2.2323 0.9999 33.6 1.08
Tanshinone I 3.13–100.00 Y 38.377X−16.044 0.9996 27.8 0.06
Crytotanshinone 1.94–62.00 Y 46.918X+18.035 0.9997 21.8 1.12
Tanshinone IIA 6.25–200.00 Y 52.32X−16.816 0.9995 141.0 0.08
Y: peak area (mAU) of compounds; X: concentration (μg/ml) of compounds.
FIGURE 3 | Skin histopathology among the three treatment groups (hematoxylin-eosin, 200 × magnification). C: control rats; M: oleic acid-induced acne rats; T:
oleic acid-induced acne + TAN-treated rats.
tanshinone IIA, Danshin spiroketal lactone, Danshenxinkun A treatment was able to reverse high cytokine levels, present in the
and a phenolic acid alpha-(3,4-dihydroxyphenyl)lactic acid. untreated M group, to levels exhibited by the C group (p < 0.05).
Details of the TAN compounds detected are shown in
Supplementary Table S3.
The TAN HPLC results are shown in Figure 2 and Table 1. All Effect of TAN on Skin Lipidomics in Rats
components were clearly distinguished at the retention time of With Oleic Acid-Induced Acne
30 min. Dihydrotanshinone, Tanshinone I, crytotanshinone, and According to the International Lipid Classification and
Tanshinone IIA were marked as markers of TAN, and were Nomenclature Committee, lipid compounds can be divided
defined as 33.6, 27.8, 21.8, and 141.0 mg in 1 g TAN, respectively. into eight categories (Fahy et al., 2009). Each category can be
sub-divided into different lipid classes based on polarity. Each
class, based on differences in saturation or the length of the
Effect of TAN on Oleic Acid-Induced carbon chain, can be further subdivided into different molecular
Acne in Rats species (lipid species). Altogether, a three-level classification of
The histological results are presented in Figure 3. In the M group, lipid compounds is achieved. In this study, 28 lipid classes and
acne-like lesions developed on the back skin. Histological analysis 1,197 lipid species were identified. Figure 5 shows the number of
of the skin revealed hyperplasia of the stratified squamous lipid species in each lipid class.
epithelium, which was accompanied by significant thickening According to the LipidSearch analysis, a visual data matrix was
of the stratum corneum. In the M group, dermis hyperemia, generated and exported to Simca 14.1 software for multivariate
inflammatory cell infiltration, and sebaceous gland size were data analysis. PCA revealed the lipid changes in the C group
significantly increased (Figure 3A). Excessive keratinization of compared to the M group. The results are illustrated in the score
hair follicle sebaceous glands, blocking hair follicle pores, and a plots of Figures 6A,B. The model parameter (R2X), which
key pathological mechanism of acne development, was observed. indicates the explanatory power of a model, of Figures 6A,B,
M rats treated with TAN (Figure 3B) exhibited skin tissue similar were 0.746 and 0.606, respectively.
to that of C rats, with improved keratosis, reduced inflammatory OPLS-DA analysis demonstrated clear differentiation in
cell infiltration, and smaller sebaceous glands (Figure 3C). lipidomic profiles between C and M groups as indicated in
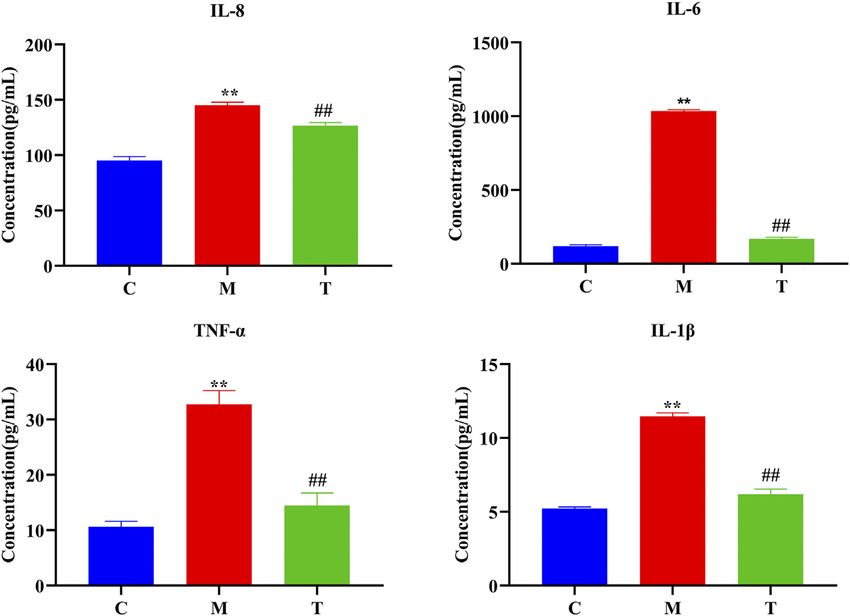
As illustrated in Figure 4, IL-8, IL-6, IL-β, and TNF-α Figure 6C (R2X 0.609, R2Y 0.964, Q2 0.924) and
expression were significantly higher in rats from the M group Figure 6D (R2X 0.670, R2Y 0.986, Q2 0.895).
than the C and T groups (p < 0.05). The T group had similar Permutation testing and cross validation support this finding
serum cytokine levels to that of the C group, suggesting that TAN (Figure 6). Table 2 lists the significantly different lipids.
Frontiers in Pharmacology | www.frontiersin.org 4 June 2021 | Volume 12 | Article 675659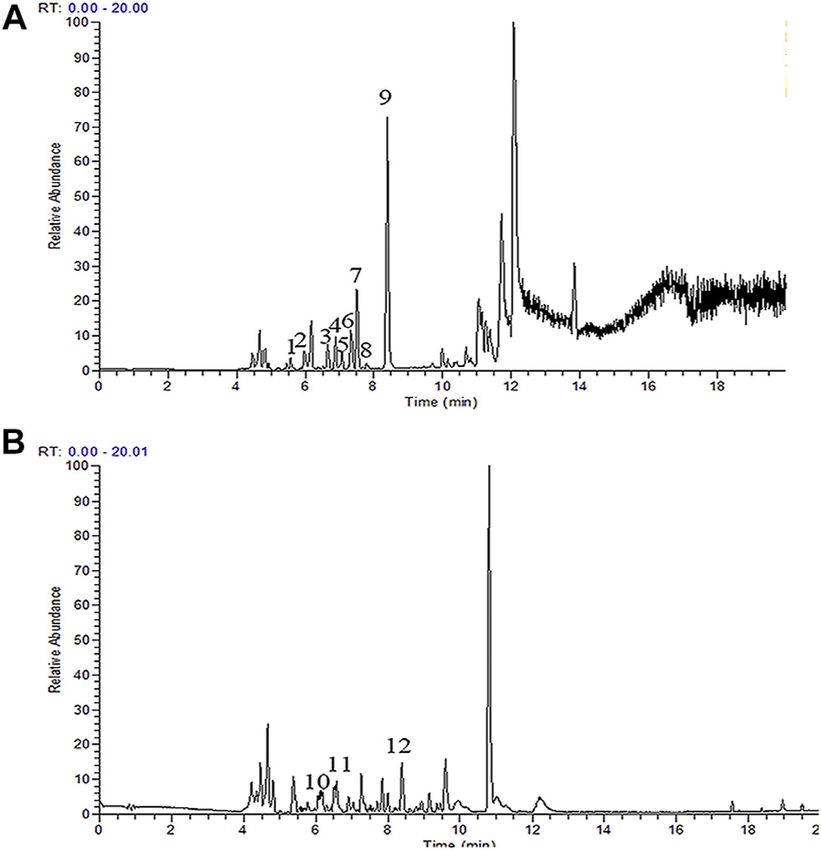
Chen et al.                                                                                                                               Lipidomics of Tanshinone in Acne

 FIGURE 4 | Expression levels of the serum inflammatory factors interleukin (IL)-8, IL-6, IL-β, and tumor necrosis factor alpha (TNF-α) (**, p < 0.01 vs. C rats; ##,
 p < 0.01 vs. M rats).

 FIGURE 5 | The number of lipid species within each identified lipid class based on. the International Lipid Classification and Nomenclature Committee.

   A total of 96 lipid species, 55 and 41 in positive and negative                       concentrations of 12 TGs were significantly decreased (p < 0.05), in
ion mode, respectively, were identified. In negative ion mode,                            the M group compared to the C group.
the     concentrations      of    35    ceramides        (Cers),     4                      To further elucidate the metabolic differences between the C
phosphatidylethanolamines        (PEs),      1     lysophosphatidyl                      and M groups, the identified lipids were analyzed using a
ethanolamine (LPE), and 1 fatty acid (FA) were significantly                              clustering heatmap. Significantly different lipids between M
increased (p < 0.05) in the M group compared to the C group.                             and C groups were considered to be potential biomarkers
In positive ion mode, the concentrations of 17 Cers, 2 acyl carnitines                   (Figure 7). The heatmap in Figure 7 directly expresses the
(AcCas), 5 diglycerides (DGs), 1 lysophosphatidylcholine (LPC), 1                        variability of each lipid species, and illustrates their relative
So, and 9 triglycerides (TGs) were significantly increased, while the                     increase (red) or decrease (blue) in M rats compared to the

Frontiers in Pharmacology | www.frontiersin.org                                      5                                             June 2021 | Volume 12 | Article 675659
Chen et al.                                                                                                                             Lipidomics of Tanshinone in Acne

 FIGURE 6 | Multivariate data analysis of skin lipidomics. (A) The principal component analysis (PCA) score plots from the skin lipid profiles of the C and M
 experimental groups in positive ion mode (R2X  0.746, Q2  0.531). (B) The PCA score plots from the skin lipid profiles of the C and M experimental groups in negative
 ion mode (R2X  0.606, Q2  0.405). (C) The orthogonal partial least-squares discrimination analysis (OPLS-DA) score plots from the skin lipid profiles of the C and M
 experimental groups in positive ion mode (R2X  0.609, R2Y  0.964, Q2  0.924). (D) The OPLS-DA score plots from the skin lipid profiles of the C and M
 experimental groups in negative ion mode (R2X  0.670, R2Y  0.986, Q2  0.895). (E) Permutation test of the lipid species from the OPLS-DA model in positive ion mode
 (R2  0.576, Q2  −0.623). (F) Permutation test of the lipid species from the OPLS-DA model in negative ion mode (R2  0.834, Q2  −0.580).

C and T groups, which leads us to postulate that TAN can                                species in M rats compared to C rats. This is in agreement with
improve the disease state as shown in Figure 3.                                         previous metabolome database reports of a dysregulation in lipid
   The lipid metabolism pathway analysis was performed using                            species, in particular sphingolipid and glycerophospholipid
Metabolomics Pathway Analysis (MetPA) 5.0. A total of 96                                metabolism, as a sign of acne (Camera et al., 2016).
identified metabolites were mapped to the Human
Metabolome Database to obtain IDs to perform pathway                                    Change of Sphingolipid Metabolism
enrichment analysis. The differential lipid species were                                In this study, we found that Cer concentrations in the M group
analyzed using MetPA, and the results are shown in Table 3.                             were increased, suggesting that Cers were more active in the M
Impact values >0.01 and p-values < 0.05 were considered as the                          rats than those in the C group. Among them, concentrations of
screening conditions. Figure 8 demonstrates that sphingolipid                           Cer(d42:1), Cer(34:0), and Cer(34:1), ultra-long chain Cers, were
and glycerophospholipid metabolism had the highest impact                               significantly increased. The altered Cer expression profiles may
factors.                                                                                lead to decreased extracellular lipid matrix density and increased
                                                                                        risk of exogenous invasion, which in turn stimulates the Th2/
                                                                                        Th22 inflammatory response (Li et al., 2020). In addition,
DISCUSSION                                                                              disturbed Cer expression profiles, and impaired barrier
                                                                                        function, result in ongoing production of cytokines and
The therapeutic effects of TAN on acne were observed in a rat                           chemokines, such as IL-1α, TNF-α, and β-defensins, that
model of oleic acid-induced acne. Our results indicated an                              exacerbate the inflammatory response (Kanoh et al., 2019). In
upregulation of 84 lipid species and a downregulation 12 lipid                          skin, Cers regulate the balance between keratinocyte proliferation

Frontiers in Pharmacology | www.frontiersin.org                                     6                                            June 2021 | Volume 12 | Article 675659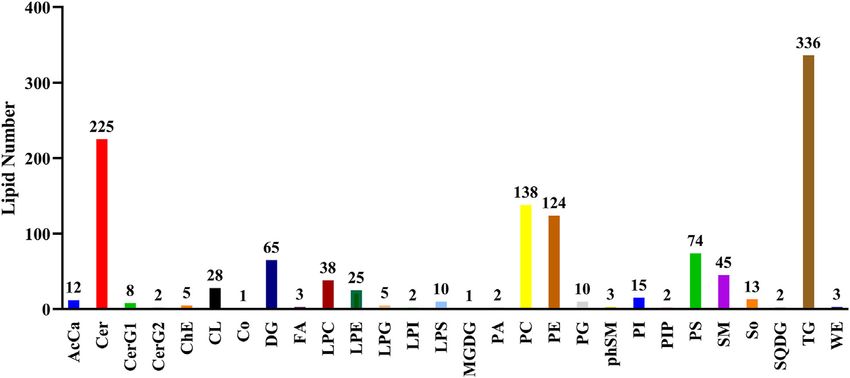
Chen et al. Lipidomics of Tanshinone in Acne
TABLE 2 | 96 identified potential biomarkers among the C, M and T.
Lipid species m/z Rt (min) C VS M Ma Tb
P Log2FC
Negative
Cer(d18:1/34:2) 830.7607 19.32406 0.0000 5.0295 ↑ ↓
Cer(d18:1/24:0) 726.6253 13.20895 0.0000 4.9656 ↑ ↓
Cer(d18:0/20:0) 670.5627 11.234 0.0000 4.5779 ↑ ↓
Cer(d42:2) 708.6148 13.82625 0.0000 3.9576 ↑ ↓
Cer(d18:0/20:0) 656.5835 12.71269 0.0003 3.7028 ↑ ↓
Cer(d18:0/21:0) 670.5991 12.89282 0.0000 3.6849 ↑ ↓
Cer(d17:0/25:0) 710.6304 15.03509 0.0000 3.5645 ↑ ↓
Cer(d54:1) 878.8182 20.47176 0.0014 3.4766 ↑ ↓
Cer(d18:0/26:0) 740.6774 15.76791 0.0007 3.4186 ↑ ↓
Cer(d18:0/23:0) 698.6304 13.9686 0.0000 3.3660 ↑ ↓
Cer(d18:1/30:1) 776.7137 17.99825 0.0000 3.2814 ↑ ↓
Cer(d52:1) 850.7869 19.29828 0.0000 3.2581 ↑ ↓
Cer(d18:1/28:1) 748.6824 16.714 0.0000 3.1965 ↑ ↓
Cer(d72:3) 1157.043 22.55396 0.0000 3.0347 ↑ ↓
Cer(d18:1/18:0) 642.5314 10.19465 0.0000 3.0183 ↑ ↓
Cer(d18:0/34:1) 850.7869 19.77001 0.0000 2.9937 ↑ ↓
Cer(d52:2) 848.7713 19.07259 0.0000 2.9919 ↑ ↓
Cer(d56:2) 904.8339 21.00001 0.0008 2.7741 ↑ ↓
Cer(d18:0/36:3) 874.7869 19.13745 0.0003 2.7521 ↑ ↓
Cer(d18:1/24:1? 708.6148 12.65092 0.0000 2.7243 ↑ ↓
Cer(d38:1) 654.5678 11.708 0.0000 2.6137 ↑ ↓
Cer(d50:1) 822.7556 18.55095 0.0000 2.5725 ↑ ↓
Cer(d18:1/32:1) 804.745 19.2463 0.0000 2.5524 ↑ ↓
Cer(d18:0/34:2) 848.7713 18.67903 0.0003 2.5181 ↑ ↓
Cer(d70:3) 1129.011 22.0871 0.0000 2.3984 ↑ ↓
Cer(d56:2) 904.8339 21.35417 0.0000 2.3947 ↑ ↓
Cer(d18:1/16:0) 614.5001 9.02884 0.0000 2.3678 ↑ ↓
Cer(d57:2) 918.8495 21.47109 0.0030 2.3654 ↑ ↓
Cer(d18:0/34:4) 844.74 16.90961 0.0008 2.3121 ↑ ↓
Cer(d16:1/26:1) 708.6148 12.9112 0.0000 2.2731 ↑ ↓
Cer(d18:1/18:0) 626.5365 10.70592 0.0000 2.1982 ↑ ↓
Cer(d59:3) 944.8652 21.84285 0.0035 2.0980 ↑ ↓
Cer(d55:2) 890.8182 20.85184 0.0000 2.0728 ↑ ↓
Cer(d60:4) 956.8652 21.56007 0.0001 2.0672 ↑ ↓
Cer(d18:0) 820.74 17.66335 0.0003 2.0053 ↑ ↓
FA (20:5) 301.2173 2.033 0.0049 2.5654 ↑ ↓
LPE (20:0) 508.3409 5.446,271 0.0000 2.0328 ↑ ↓
PE (16:1/18:2) 712.4923 7.434,218 0.0001 2.9635 ↑ ↓
PE (18:0/18:2) 742.5392 9.448,973 0.0004 2.5266 ↑ ↓
PE (24:2/18:2) 822.6018 12.57836 0.0000 2.0977 ↑ ↓
PE (36:5) 736.4923 7.194,899 0.0100 2.0491 ↑ ↓
Positive
DG (15:0) 348.2745 1.3521 0.0000 6.6497 ↑ ↓
AcCa(20:4) 448.3421 2.1250 0.0000 2.3769 ↑ ↓
AcCa(18:2) 424.3421 2.1920 0.0001 2.2946 ↑ ↓
Cer(d18:1/24:0) 666.6395 14.8970 0.0000 3.7160 ↑ ↓
Cer(d36:1) 566.5507 13.2694 0.0000 3.5810 ↑ ↓
Cer(d40:1) 622.6133 15.5625 0.0001 3.3591 ↑ ↓
Cer(d18:0/24:0) 668.6551 14.7050 0.0016 3.2196 ↑ ↓
Cer(d18:0/16:0) 572.5249 10.1544 0.0000 3.0980 ↑ ↓
Cer(d18:1/54:0) 1101.088 24.5525 0.0000 3.0138 ↑ ↓
Cer(d18:1/16:1) 552.4986 8.8579 0.0000 2.6150 ↑ ↓
Cer(d50:1) 794.7596 13.5360 0.0000 2.5911 ↑ ↓
Cer(d18:1/24:0) 666.6395 13.7101 0.0000 2.5894 ↑ ↓
Cer(d34:1) 538.5194 12.2471 0.0002 2.5210 ↑ ↓
Cer(d50:2) 776.749 14.0652 0.0000 2.4725 ↑ ↓
Cer(d18:1/56:0) 1129.12 24.8739 0.0000 2.4222 ↑ ↓
Cer(d18:0/22:0) 640.6238 13.6112 0.0000 2.3973 ↑ ↓
Cer(d18:0/17:0) 586.5405 10.6643 0.0015 2.2800 ↑ ↓
Cer(d18:2/51:2) 1052.994 22.1339 0.0000 2.2269 ↑ ↓
Cer(d44:1) 678.6759 17.9162 0.0001 2.0399 ↑ ↓
Cer(d18:1/26:0) 694.6708 14.8389 0.0000 2.0371 ↑ ↓
(Continued on following page)
Frontiers in Pharmacology | www.frontiersin.org 7 June 2021 | Volume 12 | Article 675659Chen et al. Lipidomics of Tanshinone in Acne
TABLE 2 | (Continued) 96 identified potential biomarkers among the C, M and T.
Lipid species m/z Rt (min) C VS M Ma Tb
P Log2FC
DG (36:2p) 622.5769 13.3210 0.0001 2.5883 ↑ ↓
DG (22:0/18:2) 694.6344 15.5480 0.0000 2.5602 ↑ ↓
DG (24:0/18:2) 722.6657 16.7877 0.0000 2.4717 ↑ ↓
DG (24:1/18:2) 720.6501 15.4434 0.0000 2.0170 ↑ ↓
LPC(24:0) 608.465 9.0185 0.0000 2.2503 ↑ ↓
So(d18:0) 302.3054 2.6342 0.0000 3.4427 ↑ ↓
TG (30:1/20:0/22:4) 1151.068 25.0762 0.0001 3.2637 ↑ ↓
TG (26:1/24:1/24:2) 1181.114 25.6011 0.0001 2.8942 ↑ ↓
TG (30:1/18:1/22:3) 1123.036 24.7924 0.0000 2.8787 ↑ ↓
TG (67:4) 1083.005 21.1760 0.0000 2.8079 ↑ ↓
TG (30:1/22:2/24:1) 1209.146 25.8468 0.0001 2.7197 ↑ ↓
TG (30:1/18:2/24:1) 1153.083 25.3393 0.0002 2.6218 ↑ ↓
TG (30:1/24:1/24:2) 1237.177 26.0781 0.0002 2.2441 ↑ ↓
TG (24:0/20:4/24:1) 1095.005 24.4620 0.0000 2.1535 ↑ ↓
TG (30:1/18:2/22:1) 1125.052 25.0774 0.0003 2.0958 ↑ ↓
TG (16:0/12:1/18:2) 790.6919 16.9359 0.0001 −2.0249 ↑ ↓
TG (15:0/16:0/16:1) 808.7389 19.7909 0.0002 −2.0465 ↑ ↓
TG (16:0/14:0/18:3) 818.7232 18.1460 0.0001 −2.0516 ↑ ↓
TG (8:0/8:0/24:1) 710.6293 14.7050 0.0066 −2.0949 ↑ ↓
TG (4:0/16:0/18:0) 684.6137 15.8794 0.0019 −2.0951 ↑ ↓
TG (15:0/16:0/16:0) 810.7545 20.7548 0.0001 −2.1094 ↑ ↓
TG (6:0/16:0/16:0) 684.6137 15.5811 0.0033 −2.1311 ↑ ↓
TG (16:0/8:0/18:1) 738.6606 16.7619 0.0003 −2.1414 ↑ ↓
TG (16:0/16:1/18:2) 846.7545 19.3644 0.0001 −2.1634 ↓ ↑
TG (16:0/14:0/16:0) 796.7389 20.3731 0.0001 −2.1929 ↓ ↑
TG (16:0/12:1/16:0) 766.6919 18.3072 0.0003 −2.1941 ↓ ↑
TG (8:0/18:1/18:2) 762.6606 15.7967 0.0019 −2.2486 ↓ ↑
TG (6:0/18:1/18:2) 734.6293 14.7557 0.0006 −2.2570 ↓ ↑
TG (16:0/12:1/16:0) 766.6919 17.9574 0.0002 −2.2812 ↓ ↑
TG (16:0/14:1/16:0) 794.7232 19.1828 0.0002 −2.3662 ↓ ↑
TG (4:0/16:0/16:0) 656.5824 14.6726 0.0038 −2.4827 ↓ ↑
TG (16:0/14:0/18:1) 822.7545 20.3946 0.0001 −2.4857 ↓ ↑
TG (6:0/16:0/16:1) 682.598 14.6957 0.0031 −2.6041 ↓ ↑
TG (6:0/16:0/18:1) 710.6293 15.6969 0.0024 −2.8806 ↓ ↑
TG (4:0/16:0/16:1) 654.5667 13.5966 0.0007 −3.6163 ↓ ↑
(↑):Upregulated (p < 0.05, n 8) (↓): Downregulated (p < 0.05, n 8).
a
Trends of the M group compared with the C group of the metabolites.
b
Trends of the T group compared with the M group of the metabolites.
and differentiation by exerting anti-proliferative and pro-apoptotic on the skin surface can be degraded by resident skin bacteria to generate
effects. Increased Cer synthesis, along with increased rates of DGs and free FAs (Camera et al., 2016). DGs result from the hydrolysis
keratinocyte differentiation, have been detected in vitro and in of TGs. In this study, variations in DG and TG differential metabolites
vivo models (Mizutani et al., 2013). We postulate that these in M compared to C and T groups indicates their dysregulation,
increases may lead to corneum thickening in the M group, suggesting another area of investigation for acne treatment.
compared to the C and T groups. The role of Cers and its The synthesis of TGs in vivo involves two main pathways: mono-
derivatives in regulating immune responses has been extensively glycerol and diglycerol synthesis. TGs are hydrolyzed into glycerol
studied. Cers are considered bioactive transmitters that are involved and FAs by a series of lipases, which then undergo β-oxidation for
in various inflammatory signaling pathways. Further research is absorption and use by the body. TG hydrolysis requires catalysis by
needed to determine whether extracellular Cer accumulating in the hormone-sensitive lipases which exist in two main forms: short- and
lipid matrix of the stratum corneum is also involved in inflammation long-chain forms. The short-chain form is mainly expressed in
and the immune response in acne. Notably, Cers can be broken adipose tissue and catalyzes the hydrolysis of TGs into FAs. The
down by ceramidase to produce sphingosine and FAs. long-chain form is expressed in steroidal tissues, such as the testes,
and hydrolyzes cholesterol esters into free cholesterol, which is then
Change of Glyceride Metabolism converted, by a series of enzymatic reactions, into androgens and
DGs are secreted by sebaceous glands and help maintain skin barrier estrogens.
stability. DGs are also second messengers involved in the inflammatory In this study, 29 different TG compounds were identified,
response (Grkovich and Dennis, 2009). TGs are formed by the with 58.6% were found in significantly higher concentrations
combination of DGs and FAs by glyceryl diesteryl transferase. TGs in C rats compared to M rats. However, according to the TG-
Frontiers in Pharmacology | www.frontiersin.org 8 June 2021 | Volume 12 | Article 675659Chen et al. Lipidomics of Tanshinone in Acne
FIGURE 7 | Heatmap of 96 lipid species among the experimental groups. Each line of this graph represents an accurate mass ordered by the retention time and is
colored by its abundance intensity. The scale from −3 blue (low) to + 3 red (high) represents the abundance.
TABLE 3 | Ingenuity pathway analysis with MetPA from differential lipid species.
Pathway name Match status P −log(p) Holm p FDR Impact KEGG
Sphingolipid metabolism 2/21 0.0026767 2.5724 0.22484 0.22484 0.42394 00600
Glycerophospholipid metabolism 2/36 0.0078181 2.1069 0.6489 0.32836 0.12185 00564
Glycosylphosphatidylinositol (GPI)-anchor biosynthesis 1/14 0.054479 1.2638 1.0 1.0 0.00399 00563
Glycerolipid metabolism 1/16 0.062056 1.2072 1.0 1.0 0.01402 00561
omics analysis, TGs had fewer differential metabolites, with Change of Glycerylphospholipid
an inconsistent variation trend, in contrast to the DG results. Metabolism
The enzymes catalyzing TG hydrolysis may therefore be Glycerylphospholipids, such as phosphatidylcholine (PC), PE, LPC,
dysfunctional in the M rats. For glycerolipids, TG lysophosphatidic acid (LPA), and LPE, are components of all cell
accumulation in non-adipose tissue is associated with membranes. Typical phospholipid molecules consist of hydrophilic
lipid toxicity (Liu et al., 2012). In the M group, abnormal phosphate heads and two lipophilic (hydrophobic) fatty chains. These
fat infiltration was observed, which could have lipids induce intracellular signal transduction by activating G-protein-
contributed to increased lipid toxicity and acne initiation coupled receptors on the cell membrane. Consequently, they play
in those rats. important biological functions in embryogenesis, cell proliferation,
lymphocyte homing, and the inflammation-induced immune
Change of Fatty Acid Metabolism response. The lipid biomarkers obtained in this study were mainly
FAs are the most basic unit and metabolite of lipid metabolism; its from the LPC, PE, and LPE subgroups.
structure and intracellular concentrations have important LPC is produced by phospholipase A2-mediated hydrolysis of PC,
implications for lipid metabolism in cells. In our study, it was as depicted in Figure 8. LPC is a biologically active lipid that can be
found that DGs and FAs exhibited a uniform increasing or produced under pathological conditions. It is an amphoteric molecule
decreasing trend in model group rats. that functions as both a surfactant and a detergent. LPC content is
In biological systems, carnitine can combine with FAs to form regulated to maintain proper cellular activity, as it easily damages cells
AcCa, which promotes the transport of FAs to the mitochondrial at high concentrations; for example, through weakening the integrity of
intima for fatty acid β-oxidation. monocytes and smooth muscle cells. As a member of the stain remover
Frontiers in Pharmacology | www.frontiersin.org 9 June 2021 | Volume 12 | Article 675659Chen et al. Lipidomics of Tanshinone in Acne
FIGURE 8 | Lipid metabolic pathway analysis of identified differential lipid species. (A) The network of potential biomarker variation in M rats compared to C rats in
Lipid Metabolism. Red (↑): upregulation; Blue (↓): downregulation. (B) The Metabolomics Pathway Analysis identified sphingolipid metabolism, glycerophospholipid
metabolism, and linoleic acid metabolism from the significantly differential lipid species. The size and color of each circle are based on pathway impact values and
p-values, respectively.
family, LPC can cause cell lysis at higher concentrations, while at lower metabolism pathways in an oleic acid-induced acne model. Our
concentrations can change membrane permeability. LPC has been results suggest that TAN may effectively treat acne by regulating the
found to injure endothelial cells in the human umbilical vein. metabolism of lipids, such as phospholipids and sphingolipids. In
Moreover, it has also been reported to be involved in various addition, lipidomics may be useful in investigating the effects, and
pathological conditions such as diabetes, obesity, atherosclerosis, and explaining possible mechanisms of action, of other traditional
cancer (Kabarowski et al., 2005). We therefore postulate that this would medicinal plants on skin diseases.
be a new biomarker to promote the occurrence of acne.
In the heathly human body, activated ethanolamine combines with
DGs to produce PE. LPE is a metabolite generated by the enzymatic DATA AVAILABILITY STATEMENT
hydrolysis of PE by phospholipase A1. The PE-LPE metabolic pathway
is involved in various cellular metabolic pathways (Shirvan et al., 2017). The raw data supporting the conclusion of this article will be
These aforementioned phospholipids play a role in several metabolic made available by the authors, without undue reservation, to any
pathways in the body, including those involving the metabolism of qualified researcher. Requests to access these datasets should be
glycerolipids, arachidonic acids, linoleic acids, α-linoleic acids; directed to liuqiang@smu.edu.cn.
integrative metabolism; and the retrograde endocannabinoid
signaling pathway. During phospholipid synthesis and metabolism,
lipid metabolites are produced via the action of enzymes. Under normal ETHICS STATEMENT
physiological conditions, the amount of these lipid metabolites is
regulated, but under an inflammatory state, they can aggregate and The animal study was reviewed and approved by the Animal Care
produce pathological effects. Many lipid metabolites are also biologically and Use committee of the Southern Medical University.
active secondary messengers and, in many cases, are associated with the
onset of disease. The pathways involved in glycerolipid metabolism
imply that LPCs, PEs, and LPEs can be converted into one another, as AUTHOR CONTRIBUTIONS
illustrated in Figure 8. In conclusion, we speculate that the uncontrolled
lipid species can be a warning signal of acne. Conceptualization, Funding acquisition, and Supervision: QL, HZ;
Data curation: TC, ZZ; tanshinones extract of Salvia miltiorrhiza:
YWa, QD; HPLC analysis: YX, ZW; Animal experiment: ZZ, TC,
CONCLUSION and WW; Investigation: YWu, QZ; Methodology: CJ, CS, and LL;
Visualization and Writing—original draft: TC, ZZ; Writing-
To summarize, using lipidomic analysis, this study identified 96 original draft preparation: ZZ, TC; Writing-review editing: TC,
different lipid species from the sphingolipid and glycerophospholipid QL, and HZ.
Frontiers in Pharmacology | www.frontiersin.org 10 June 2021 | Volume 12 | Article 675659Chen et al. Lipidomics of Tanshinone in Acne
FUNDING SUPPLEMENTARY MATERIAL
This study was supported by the National Natural Science The Supplementary Material for this article can be found online at:
Foundation of China (81874346), and the Science and https://www.frontiersin.org/articles/10.3389/fphar.2021.675659/
Technology Program of Guangzhou (201907010018). full#supplementary-material
Köfeler, H. C., Fauland, A., Rechberger, G. N., and Trötzmüller, M. (2012). Mass
REFERENCES Spectrometry Based Lipidomics: an Overview of Technological Platforms.
Metabolites 2 (1), 19–38. doi:10.3390/metabo2010019
Bai, A., Lu, N., Guo, Y., and Fan, X. (2008). Tanshinone IIA Ameliorates Li, Y. F., and Zhou, Y. L. (2018). The Therapeutic Effect of Tanshinone IIA on
Trinitrobenzene Sulfonic Acid (TNBS)-induced Murine Colitis. Dig. Dis. Sci. Propionibacterium Acnes-Induced Inflammation In Vitro. Dermatol. Ther. 31
53 (2), 421–428. doi:10.1007/s10620-007-9863-8 (6), e12716. doi:10.1111/dth.12716
Barros, B., and Thiboutot, D. (2017). Hormonal Therapies for Acne. Clin. Li, Y. I., Elmer, G., and LeBoeuf, R. C. (2008). Tanshinone IIA Reduces
Dermatol. 35 (2), 168–172. doi:10.1016/j.clindermatol.2016.10.009 Macrophage Death Induced by Hydrogen Peroxide by Upregulating
Bernut, A., Loynes, C. A., Floto, R. A., and Renshaw, S. A. (2020). Deletion Glutathione Peroxidase. Life Sci. 83 (15-16), 557–562. doi:10.1016/j.lfs.2008.
ofcftrLeads to an Excessive Neutrophilic Response and Defective Tissue Repair 08.003
in a Zebrafish Model of Sterile Inflammation. Front. Immunol. 11, 1733. doi:10. Li, W.-J., Kong, S.-Z., Luo, H., Jia, Z.-B., and Cheng, Y. (2013). Electrochemical and
3389/fimmu.2020.01733 Spectroelectrochemical Studies of Four Tanshinones from Salvia Miltiorrhiza
Camera, E., Ludovici, M., Tortorella, S., Sinagra, J.-L., Capitanio, B., Goracci, L., Bunge. Chin. Chem. Lett. 24 (12), 1145–1147. doi:10.1016/j.cclet.2013.08.003
et al. (2016). Use of Lipidomics to Investigate Sebum Dysfunction in Juvenile Li, Y., Shi, S., Gao, J., Han, S., Wu, X., Jia, Y., et al. (2016). Cryptotanshinone
Acne. J. Lipid Res. 57 (6), 1051–1058. doi:10.1194/jlr.M067942 Downregulates the Profibrotic Activities of Hypertrophic Scar Fibroblasts and
Chen, Z., Gao, X., Jiao, Y., Qiu, Y., Wang, A. L., Yu, M. L., et al. (2019). Tanshinone Accelerates Wound Healing: A Potential Therapy for the Reduction of Skin
IIA Exerts Anti-Inflammatory and Immune-Regulating Effects on Vulnerable Scarring. Biomed. Pharmacother. 80, 80–86. doi:10.1016/j.biopha.2016.03.006
Atherosclerotic Plaque Partially via the TLR4/MyD88/NF-Kappa B Signal Li, X., He, C., Chen, Z., Zhou, C., Gan, Y., and Jia, Y. (2017). A Review of the Role of
Pathway. Front. Pharmacol. 10, 850. doi:10.3389/fphar.2019.00850 Sebum in the Mechanism of Acne Pathogenesis. J. Cosmet. Dermatol. 16 (2),
Das, S., and Reynolds, R. V. (2014). Recent Advances in Acne Pathogenesis: 168–173. doi:10.1111/jocd.12345
Implications for Therapy. Am. J. Clin. Dermatol. 15 (6), 479–488. doi:10.1007/ Li, Q., Fang, H., Dang, E., and Wang, G. (2020). The Role of Ceramides in Skin
s40257-014-0099-z Homeostasis and Inflammatory Skin Diseases. J. Dermatol. Sci. 97 (1), 2–8.
Fahy, E., Subramaniam, S., Murphy, R. C., Nishijima, M., Raetz, C. R. H., doi:10.1016/j.jdermsci.2019.12.002
Shimizu, T., et al. (2009). Update of the LIPID MAPS Comprehensive Liu, L., Yu, S., Khan, R. S., Homma, S., Schulze, P. C., Blaner, W. S., et al. (2012).
Classification System for Lipids. J. Lipid Res. 50, S9–S14. doi:10.1194/jlr. Diacylglycerol Acyl Transferase 1 Overexpression Detoxifies Cardiac Lipids in
R800095-JLR200 PPARγ Transgenic Mice. J. Lipid Res. 53 (8), 1482–1492. doi:10.1194/jlr.
Fang, Z. Y., Lin, R., Yuan, B. X., Yang, G.-D., Liu, Y., and Zhang, H. (2008). M024208
Tanshinone IIA Downregulates the CD40 Expression and Decreases MMP-2 Maione, F., De Feo, V., Caiazzo, E., De Martino, L., Cicala, C., and Mascolo, N.
Activity on Atherosclerosis Induced by High Fatty Diet in Rabbit. (2014). Tanshinone IIA, a Major Component of Salvia Milthorriza Bunge,
J. Ethnopharmacol. 115 (2), 217–222. doi:10.1016/j.jep.2007.09.025 Inhibits Platelet Activation via Erk-2 Signaling Pathway. J. Ethnopharmacol.
Grkovich, A., and Dennis, E. A. (2009). Phosphatidic Acid Phosphohydrolase in 155 (2), 1236–1242. doi:10.1016/j.jep.2014.07.010
the Regulation of Inflammatory Signaling. Adv. Enzyme Regul. 49 (1), 114–120. Maione, F., Cantone, V., Chini, M. G., De Feo, V., Mascolo, N., and Bifulco, G.
doi:10.1016/j.advenzreg.2009.01.005 (2015). Molecular Mechanism of Tanshinone IIA and Cryptotanshinone in
Han, X., and Gross, R. W. (2003). Global Analyses of Cellular Lipidomes Directly Platelet Anti-aggregating Effects: an Integrated Study of Pharmacology and
from Crude Extracts of Biological Samples by ESI Mass Spectrometry: a Bridge Computational Analysis. Fitoterapia 100, 174–178. doi:10.1016/j.fitote.2014.
to Lipidomics. J. Lipid Res. 44 (6), 1071–1079. doi:10.1194/jlr.R300004-JLR200 11.024
Jia, L., Song, N., Yang, G., Ma, Y., Li, X., Lu, R., et al. (2016). Effects of Tanshinone Makrantonaki, E., Ganceviciene, R., and Zouboulis, C. C. (2011). An Update on the
IIA on the Modulation of miR-33a and the SREBP-2/Pcsk9 Signaling Pathway Role of the Sebaceous Gland in the Pathogenesis of Acne. Dermato-Endocrinol.
in Hyperlipidemic Rats. Mol. Med. Rep. 13 (6), 4627–4635. doi:10.3892/mmr. 3 (1), 41–49. doi:10.4161/derm.3.1.13900
2016.5133 Mizutani, Y., Sun, H., Ohno, Y., Sassa, T., Wakashima, T., Obara, M., et al. (2013).
Jia, Y., Gan, Y., He, C., Chen, Z., and Zhou, C. (2018). The Mechanism of Skin Cooperative Synthesis of Ultra Long-Chain Fatty Acid and Ceramide during
Lipids Influencing Skin Status. J. Dermatol. Sci. 89 (2), 112–119. doi:10.1016/j. Keratinocyte Differentiation. Plos One 8 (6), e67317. doi:10.1371/journal.pone.
jdermsci.2017.11.006 0067317
Jiang, J.-G., Huang, X.-J., Chen, J., and Lin, Q.-S. (2007). Comparison of the Natshch, H., Vettorato, E., and Touitou, E. (2019). Ethosomes for Dermal
Sedative and Hypnotic Effects of Flavonoids, Saponins, and Polysaccharides Administration of Natural Active Molecules. Curr. Pharm. Des. 25 (21),
Extracted from Semen Ziziphus Jujube. Nat. Product. Res. 21 (4), 310–320. 2338–2348. doi:10.2174/1381612825666190716095826
doi:10.1080/14786410701192827 Park, S. H., Lee, J. E., Lee, S. M., Lee, J., Seo, C. S., Hwang, G. S., et al. (2020). An
Jiang, Y., Hu, F. F., Li, Q., Shen, C., Yang, J., and Li, M. (2019). Tanshinone IIA Unbiased Lipidomics Approach Identifies Key Lipid Molecules as Potential
Ameliorates the Bleomycin-Induced Endothelial-To-Mesenchymal Transition Therapeutic Targets of Dohongsamul-Tang against Non-alcoholic Fatty Liver
via the Akt/mTOR/p70S6K Pathway in a Murine Model of Systemic Sclerosis. Diseases in a Mouse Model of Obesity. J. Ethnopharmacol. 260, 112999. doi:10.
Int. Immunopharmacol. 77, 105968. doi:10.1016/j.intimp.2019.105968 1016/j.jep.2020.112999
Kabarowski, J. H. S., Zhu, K., Le, L. Q., Witte, O. N., and Xu, Y. (2005). Shen, C. Y., Jiang, J. G., Li, M. Q., Zheng, C. Y., and Zhu, W. (2017a). Structural
Lysophosphatidylcholine as a Ligand for the Immunoregulatory Receptor Characterization and Immunomodulatory Activity of Novel Polysaccharides
G2A (Retraction of Vol 293, Pg 702, 2001). Science 307 (5707), 206. doi:10. from Citrus Aurantium Linn. Variant Amara Engl. J. Funct. Foods 35, 352–362.
1126/science.307.5707.206b doi:10.1016/j.jff.2017.05.055
Kanoh, H., Ishitsuka, A., Fujine, E., Matsuhaba, S., Nakamura, M., Ito, H., et al. Shen, C. Y., Zhang, W. L., and Jiang, J. G. (2017b). Immune-enhancing Activity of
(2019). IFN-gamma Reduces Epidermal Barrier Function by Affecting Fatty Polysaccharides from Hibiscus sabdariffa Linn. Via MAPK and NF-kB
Acid Composition of Ceramide in a Mouse Atopic Dermatitis Model. Signaling Pathways in RAW264.7 Cells. J. Funct. Foods 34, 118–129. doi:10.
J. Immunol. Res. 2019, 3030268. doi:10.1155/2019/3030268 1016/j.jff.2017.03.060
Frontiers in Pharmacology | www.frontiersin.org 11 June 2021 | Volume 12 | Article 675659Chen et al. Lipidomics of Tanshinone in Acne Parande Shirvan, S., Ebrahimby, A., Dousty, A., Maleki, M., Movassaghi, A., Borji, Activation in Cardiomyoblasts. Food Chem. Toxicol. 56, 28–39. doi:10.1016/j. H., et al. (2017). Somatic Extracts of Marshallagia Marshalli Downregulate the fct.2013.01.008 Th2 Associated Immune Responses in Ovalbumin-Induced Airway Yu, Z. W., Lv, H. Y., Han, G., and Ma, K. (2016). Ethosomes Loaded with Inflammation in BALB/c Mice. Parasit. Vectors 10, 233. doi:10.1186/s13071- Cryptotanshinone for Acne Treatment through Topical Gel Formulation. 017-2159-8 Plos One, 11, e0159967. doi:10.1371/journal.pone.0159967 Tang, S., Shen, X.-Y., Huang, H.-Q., Xu, S.-W., Yu, Y., Zhou, C.-H., et al. (2011). Zhao, Y.-Y., Wu, S.-P., Liu, S., Zhang, Y., and Lin, R.-C. (2014). Ultra-performance Cryptotanshinone Suppressed Inflammatory Cytokines Secretion in RAW264.7 Liquid Chromatography-Mass Spectrometry as a Sensitive and Powerful Macrophages through Inhibition of the NF-Κb and MAPK Signaling Pathways. Technology in Lipidomic Applications. Chem. Biol. Interact. 220, 181–192. Inflammation 34 (2), 111–118. doi:10.1007/s10753-010-9214-3 doi:10.1016/j.cbi.2014.06.029 Tao, S., Justiniano, R., Zhang, D. D., and Wondrak, G. T. (2013). The Nrf2- Zouboulis, C. C. (2009). Propionibacterium Acnes and Sebaceous Lipogenesis: A Inducers Tanshinone I and Dihydrotanshinone Protect Human Skin Cells and Love-Hate Relationship? J. Invest. Dermatol. 129 (9), 2093–2096. doi:10.1038/ Reconstructed Human Skin against Solar Simulated UV. Redox. Biol. 1 (1), jid.2009.190 532–541. doi:10.1016/j.redox.2013.10.004 Thiboutot, D. M., Dréno, B., Abanmi, A., Alexis, A. F., Araviiskaia, E., Barona Conflict of Interest: The authors declare that the research was conducted in the Cabal, M. I., et al. (2018). Practical Management of Acne for Clinicians: An absence of any commercial or financial relationships that could be construed as a International Consensus from the Global Alliance to Improve Outcomes in potential conflict of interest. Acne. J. Am. Acad. Dermatol. 78 (2), S1–S23. doi:10.1016/j.jaad.2017.09.078 van Smeden, J., Janssens, M., Kaye, E. C. J., Caspers, P. J., Lavrijsen, A. P., Vreeken, Copyright © 2021 Chen, Zhu, Du, Wang, Wu, Xue, Wang, Wu, Zeng, Jiang, Shen, R. J., et al. (2014). The Importance of Free Fatty Acid Chain Length for the Skin Liu, Zhu and Liu. This is an open-access article distributed under the terms of the Barrier Function in Atopic Eczema Patients. Exp. Dermatol. 23 (1), 45–52. Creative Commons Attribution License (CC BY). The use, distribution or doi:10.1111/exd.12293 reproduction in other forums is permitted, provided the original author(s) and Weng, Y.-S., Kuo, W.-W., Lin, Y.-M., Kuo, C.-H., Tzang, B.-S., Tsai, F.-J., et al. the copyright owner(s) are credited and that the original publication in this journal is (2013). Danshen Mediates through Estrogen Receptors to Activate Akt and cited, in accordance with accepted academic practice. No use, distribution or Inhibit Apoptosis Effect of Leu27IGF-II-Induced IGF-II Receptor Signaling reproduction is permitted which does not comply with these terms. Frontiers in Pharmacology | www.frontiersin.org 12 June 2021 | Volume 12 | Article 675659
Chen et al.                                                                                            Lipidomics of Tanshinone in Acne

GLOSSARY                                                        MGDG monogalactosyldiacylglycerol
                                                                PA phosphatidic acid
AcCa acyl carnitine
                                                                PC phosphatidylcholine
Cer Ceramide
                                                                PCA principal component
chE cholestery1 ester                                           analysis
CL cardiolipin                                                  PE phosphatidylethanolamine
Co coenzyme                                                     PG phosphatidylglycerol
DG diglyceride                                                  phSM phytosphingosine
FA fatty acid                                                   PI phosphatidylinositol
HPLC High-performance liquid chromatography chromatogram        PS phosphatidy1serines
IL-1β interleukin-1β                                            QC quality control
IL-6 interleukin-6                                              SM sphingomyelin
IL-8 interleukin-8                                              So sphingosine
LC-MS liquid chromatography-mass spectrometry                   SQDG sulfoquinovosyldiacylglycerol
LPC lysophosphatidylcholine                                     TG triglyceride
LPE lysophosphatidyl ethanolamine                               TNF-α tumor necrosis factor α
LPI lysophosphatidylinositol                                    VIP variable importance on
LPG lysophosphatidylglycerol                                    projection
LPS lysophosphatidylserine                                      WE wax exters

Frontiers in Pharmacology | www.frontiersin.org            13                                    June 2021 | Volume 12 | Article 675659
You can also read