Multilevel stakeholder networks for Australian marine biosecurity: well-structured for top-down information provision, requires better two-way ...
←
→
Page content transcription
If your browser does not render page correctly, please read the page content below
Copyright © 2020 by the author(s). Published here under license by the Resilience Alliance.
McAllister, R. R. J., H. Kruger, N. Stenekes, and R. Garrard. 2020. Multilevel stakeholder networks for Australian marine
biosecurity: well-structured for top-down information provision, requires better two-way communication. Ecology and Society 25
(3):18. https://doi.org/10.5751/ES-11583-250318

Research

Multilevel stakeholder networks for Australian marine biosecurity: well-
structured for top-down information provision, requires better two-way
communication
Ryan R. J. McAllister 1, Heleen Kruger 2, Nyree Stenekes 2 and Robert Garrard 1

ABSTRACT. The structure of stakeholder networks impacts the ability for environmental governance to fulfil core functions: share
information; agree on problem framing and actions; and resolve conflict. Managing pest and disease incursions presents particular
challenges. Rapid coordination of action is needed in times of crisis, but any hope of success during crisis requires a foundation of
ongoing communication and surveillance. Recent Australian strategic planning for marine biosecurity identified the critical role of an
independent national marine pest network in providing ongoing communication. We surveyed stakeholders in the existing marine pest
network to map how they share information. Constructing a multilevel, directed network, with 304 organizations and 12 policy forums,
we applied statistical network theory to identify which subnetwork configuration patterns were present more or less than by chance.
We mapped configurations against how they shape the network’s propensity for information sharing. What we found was a marine pest
network with a predisposition for bridging; evidence of hubs for both provision and receiving of information; and organizations
reporting greater levels of information provision to others compared to receiving information. Our assessment is that the network is
well structured for top-down information provision, but that a more sustainable network will require attention to building two-way
communication particularly with community groups.
Key Words: configurations; exponential random graph model; social network analysis

INTRODUCTION                                                               deeper understanding of what preconditions its ability to function
The environmental governance literature scrutinizes the role of            well is required.
stakeholder collaboration in solving complex problems (Lubell
                                                                           Pests constantly threaten marine biodiversity and ecological
2015). Collaboration is tricky and costly. But where problems span
                                                                           integrity (Floerl 2014) and can result in enormous economic and
multiple interests, and diversity of stakeholders is either inevitable
                                                                           ecological harm (Cook et al. 2016). For example, it is estimated
or desirable, then engaging in collaborative models is likely more
                                                                           an incursion of black-striped mussel (Mytilopsis sallei) could
successful than alternatives that may favor centralized control
                                                                           cause damages to Australian ports and key coastal infrastructure
(governance over government). Case studies and theory have
                                                                           of between US$100 million to US$200 million in present value
made enormous contributions to understanding collaborative
                                                                           terms over a period of three decades (Summerson et al. 2013).
governance (e.g., Ostrom 2010). What the structure of stakeholder
                                                                           Environmentally black-striped mussel’s dense aggregations also
interactions implies within such contexts is a somewhat newer
                                                                           out-compete native species, dominate habitats, and reduce water
scholarly endeavor. In this study we use a social network approach
                                                                           quality (Summerson et al. 2013).
to examine how organizations both participate in environmental
policy forums, and also interact outside of these formal structures.       Legislative and rule-making power for marine pest biosecurity
Our case data cover stakeholders with an interest in Australian            resides within government organizations, with responsibility for
marine biosecurity.                                                        various issues distributed across different levels. For example, on-
                                                                           ground Australian Government responsibilities include
In Australia, biosecurity policy is changing, with industry groups,
                                                                           inspections and pathway management of international vessels,
growers, and other community players now expected to have an
                                                                           whereas state and territory governments are generally responsible
increased role in pest governance (Kruger 2016, Mankad 2016,
                                                                           for managing incursions within their jurisdictions.
Maclean et al. 2018). This does not mean the government is not
deeply involved (Curnock et al. 2017, Maclean et al. 2019). There          The Marine Pest Sectoral Committee is the key national forum,
is however recognition that government players are neither                 comprising members from the Australian Government, states,
resourced sufficiently to fill all required roles and responsibilities,    and Northern Territory. The Committee includes observers with
nor necessarily the most capable of filling all roles. In terms of         technical/scientific expertise and New Zealand as a standing
governance, biosecurity now turns to multiple purpose networks             observer. Government committee members engage with
that seek to mesh diverse tasks such as surveillance, policy               nongovernment stakeholders through partner workshops that are
development, response to incursion, awareness building, and                held in conjunction with Marine Pest Sectoral Committee’s
research and development. Government has some role in shaping              biannual face-to-face meetings. The Committee itself has
the network but there is a degree of emergence too. For the                considerable influence on jurisdictional dialogues and
government to understand its role in shaping the network, a                engagement, but has no enforcement powers. Other marine pest

1
CSIRO, 2Australian Bureau of Agricultural and Resource Economics and Sciences (ABARES), Department of Agriculture, Water and the
Environment, Australian Government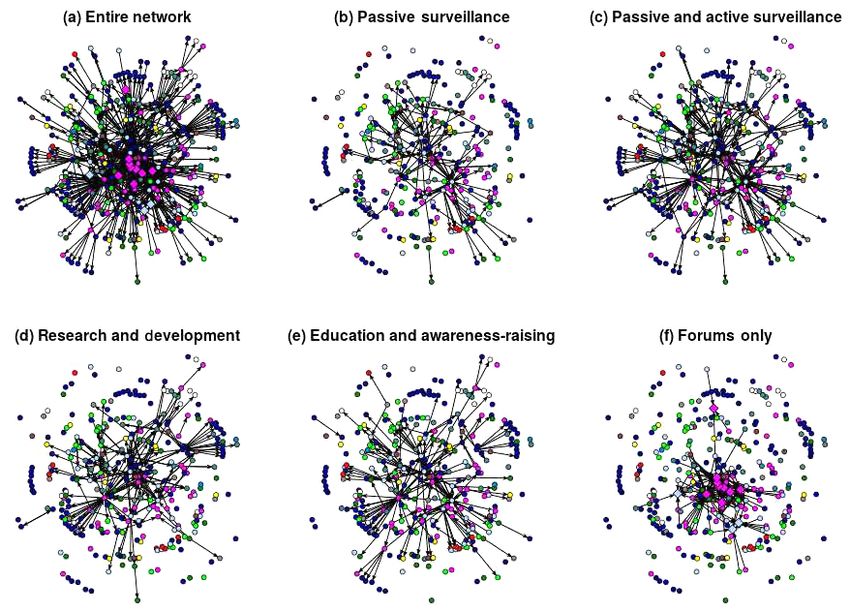
Ecology and Society 25(3): 18
                                                                                           https://www.ecologyandsociety.org/vol25/iss3/art18/

policy forums are formed on a needs basis. At the time of writing,      Even though as a whole biosecurity includes political processes
the Marine Pest Sectoral Committee had created task or working          involving a diversity of interests at multiple scales (Reed and
groups to develop strategies for marine pest biosecurity and            Curzon 2015), the marine pest network that we study is focused
surveillance, respectively, and to develop biosecurity guidelines       on communication, surveillance, and engagement. The marine
for marina and slipways.                                                pest network does not directly deal with managing incursions and
                                                                        negotiating cost sharing agreements. Accordingly, the network
The marine pest network is the suite of organizational
                                                                        should display a predominance of bridging capital, facilitating
interactions that emerge around the Marine Pest Sectoral
                                                                        an open sharing of information across diverse stakeholders in an
Committee. The network brings in many informal relationships
                                                                        environment of low social risk.
and extends well beyond organizational participation in policy
forums, spanning members of the public, scientists, industry, and       We quantify both the formal and informal stakeholder networks
government all with various interests in Australia’s marine pest        in the Australian marine pest network, and then statistically
biosecurity. If pest outbreaks occur institutional responses create     analyze the patterns of configurations that test for configurations
ephemeral networks that last during the emergency, but                  preconditioning bonding and bridging. The network itself is
Australia’s marine pest biosecurity network relates to the              based on organizations identifying which other organizations
enduring relationships that foster ongoing communications and           they received/provided information from/to on key issues for
surveillance.                                                           marine biosecurity, e.g., surveillance, and combining this with
                                                                        data on which organizations participated in known policy forums
Two recent strategic documents recommended the Australian
                                                                        for marine biosecurity.
Government more actively manage the national marine pest
network to strengthen collaboration and coordination between            The practical questions that motivated this study are the
stakeholders for better marine pest biosecurity outcomes in             following:
Australia (Australian Government 2015, 2018). The 2015 review
                                                                          1. How well predisposed is the network to enable effective
recommended the following:
                                                                             information dissemination?
  . coordinating national communication, including strengthening
                                                                          2. How do informal organizational stakeholder interactions
    education and awareness;
                                                                             structure around the suite of government working groups
  . facilitating passive surveillance from more sources, e.g.,               and committees tasked with improving marine pest
    community groups and industry, including coordinated                     biosecurity?
    reporting and data sharing about detections;
                                                                          3. How well predisposed is the network to engage communities
  . facilitating analysis of monitoring and active surveillance              in two-way information flows?
    programs;
                                                                        METHODS
  . facilitating national research and development initiatives.
                                                                        Multilevel networks
The Australian Government representatives on the Marine Pest            We modeled interactions between stakeholders using a social
Sectoral committee commissioned this study to inform actions to         network. Social networks consist of a set of nodes, usually
improve communication and co-ordination among stakeholders.             representing actors in the network, and a set of ties (or links),
This study represents the first assessment of what formal and           representing some relationship of interest between actors. A
informal marine pest stakeholder networks are currently at play,        multilevel network (Wang et al. 2013) is a network with two
and what functions they enable.                                         distinct types of node. In our setting, we defined the 12 policy
We adapt and contribute to a growing body of literature that seeks      forums to be nodes of one type, and the 304 organizations to be
to understand networks by mapping substructures (configurations)        nodes of the other. Multilevel networks have three levels, each
of which the relative abundance allow statistical inference on          denoting a different type of tie: micro, meso, and macro. Nodes
social and political processes (e.g., Bodin and Tengö 2012,             of one type occupy the microlevel, while nodes of the other occupy
Berardo 2014a, Lubell et al. 2014, Guerrero et al. 2015, Nita et        the macrolevel. Ties that exist in the micro and macrolevels
al. 2016, Barnes et al. 2017, Hamilton et al. 2018, Metz et al. 2020)   respectively denote linkages between nodes of the same level. Ties
including some specific to marine settings (Alexander et al. 2018,      that exist in the mesolevel denote across-level linkages (Fig. 1).
Barnes et al. 2019). We specifically tap into theoretical               We let organization nodes form the microlevel, while the policy
perspectives linking bonding capital to interactions where the          forums form the macrolevel.
potential for noncooperative behavior is greatest (Berardo 2014a).      The mesolevel of our network contained a tie between an
Bridging capital fosters learning and innovation, quickly               organization and a policy forum if that organization was
disseminates information (or instructions), and connects actors         identified as a participant in that forum (Fischer and Leifeld
to others in more distant parts of the network where information        2015). We treated these ties as undirected because by definition
is more likely to be novel (Granovetter 1973). Bonding capital          policy forums must allow two-way information flows. The
presents in networks as close-knit configurations, with dense and       microlevel was defined by direct interactions between
overlapping ties. Bonding capital helps build collaborative             organizations that do not occur as part of the marine pest policy
potential through trust, problem definition, and developing and/        forums. Because a one-way flow of information was permitted in
or contesting shared expectations (Berardo 2014b, Berardo and           this setting, we considered ties to be directed, with a directed link
Lubell 2019).                                                           from node A to node B if information was reported to flow from
Ecology and Society 25(3): 18
https://www.ecologyandsociety.org/vol25/iss3/art18/
A to B by either party. Because there was no immediate sensible et al. 2017). We used a framework that maps network
notion of interaction between policy forums, except through configurations showing homophily, reciprocity, and closed
mutual attendance by an organization, we did not allow structures as indicative of bonding capital as a means to assess
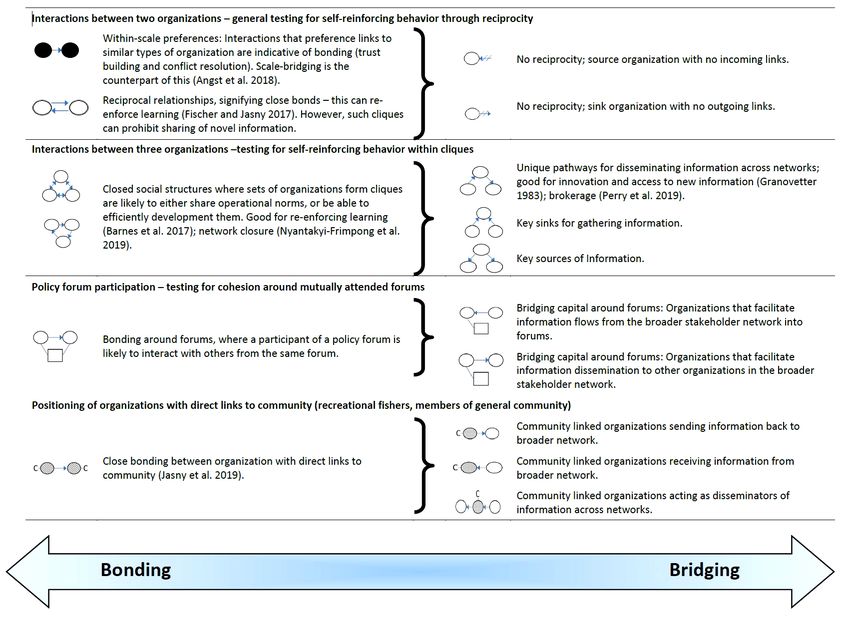
macrolevel ties. The resulting network is illustrated in Figure 2 the balance between bonding and bridging capital (Fig. 3).
(a). Figures 2(b-e) display subnetworks according to ties of each
nature. Statistical network modeling
Exponential random graph models, as implemented in the
package MPNET (Wang et al. 2014), were used to analyze the
Fig. 1. Examples of (a) multilevel policy network, and (b) data. This builds on advances in statistical modeling treating an
configuration. observed network as a single observation that can be compared
to a distribution of all possible networks with a shared core set
of characteristics, e.g., number of nodes and ties (Frank and
Strauss 1986, Wasserman and Pattison 1996, Robins and Morris
2007, Wang et al. 2013). Such approaches are well suited to
statistically testing if selected characteristics in the form of
configurations, are observed more-or-less often than by chance
alone. By mapping selected configurations to important network
processes (see Fig. 3), exponential random graph model can hence
be used to test for the presence of structures that can sustain
important social and political processes (Berardo 2014a, Lubell
et al. 2015). Exponential random graph models also allow for
statistical inferences to be made without the need for multiple
networks for comparison.
Part of the explanatory power of exponential random graph
model comes from its handling of nested configurations. Most
Fig. 2. Networks explored (a) to (f) using exponential random configurations in networks are nested within other
graph models. Squares represent policy forums, circles represent configurations. A configuration with four connected nodes also
organizations in marine pest network. Ties represent contains within it configurations with three connected nodes.
information sharing (one-mode) or affiliations through forums Exponential random graph models assess the relative frequently
(two-mode) of configurations in a network given the observed frequency of
other configurations, including those that are nested. Note that
in making accurate assessments of the representation of these
configurations in our data, we controlled for the general level of
activity displayed by each scale of stakeholder. This baseline
activity can also be interpreted as a measure of how active
stakeholders have been in the marine pest network.
One of the limitations of exponential random graph models is
that the Markov chain maximum likelihood estimation approach
used to find solutions often fails to converge to a sensible model;
a phenomenon called degeneracy. This is particularly common
when many configurations are included in the model. To
overcome this, we used “goodness-of-fit” (analogous to the
bootstrap, Efron 1979) to test for the over and under
representation of configurations not in the model (e.g., see Lubell
et al. 2014). A smaller model is fitted and used to produce
simulated graphs, whereby standard errors may be computed for
configurations not in the model under the null hypothesis that
their coefficient is zero. These may then be used to test whether
Framework these configurations are over or underrepresented in the observed
The distribution of network configurations emerge in networks network.
as individuals make choices about if, how, and when they
DATA
participate in a network (Hamilton et al. 2019). Social network
We collected our multilevel social network by first looking at
analysis does not take into consideration the formal level of
organizational participation in policy forums. We defined these
authority bestowed on certain actors, by which they may impose
formal interactions as those that take place in policy forums;
influence on decision making, regardless of their position in the
repeated meetings that contain agenda items related to marine
network (Carlsson and Sandström 2007). Even if favorable
pests, either as a standing item or as part of the agenda for an
structures are present, it provides no guarantee for success. Yet,
extended period. We required that a policy forum exhibited
poor or a lack of favorable configurations predispose a network
dedicated two-way discussion or debate regarding marine pest
to ineffectively respond to change and new information (Barnes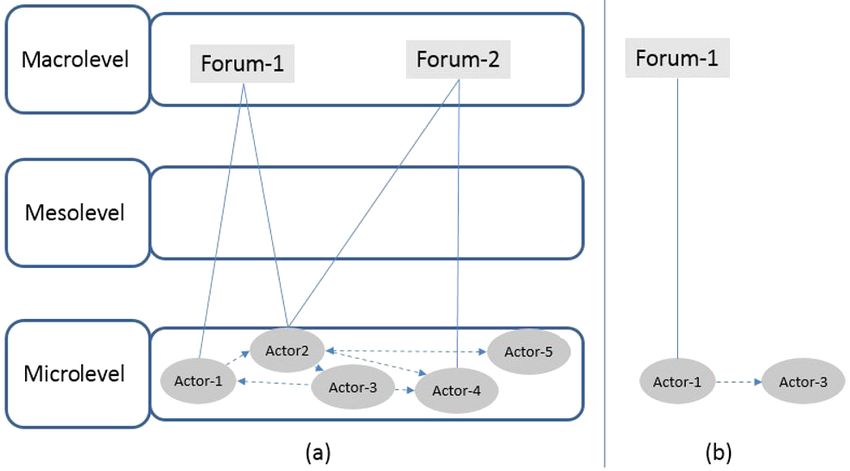
Ecology and Society 25(3): 18
                                                                                         https://www.ecologyandsociety.org/vol25/iss3/art18/

Fig. 3. Selection of network configurations of theoretical interest. References suggest recent reading.

topics, and excluded settings with predominately one-way              The resulting database contained 681 observations of people who
communication, such as conferences. Hence policy forums               were likely to have a relation to marine pests.
included: technical reference groups, working and steering
                                                                      We designed a survey instrument to measure interactions between
committees, and advisory groups. Informal interactions were
                                                                      stakeholders and capture the nature of those interactions.
defined to be any interactions related to marine pests not in the
                                                                      Respondents were asked to nominate stakeholders with whom
formal setting.
                                                                      they had contact regarding marine pest biosecurity. In the survey
We identified a set of policy forums through a series of phone        instrument we defined a contact as “an ongoing working
interviews with 10 stakeholders. Eight of these stakeholders were     relationship, including your work colleagues; and any other
members of the Marine Pest Sectoral Committee. These members          people with whom you have had personal interactions that you
represented each state and territory, except for the Australian       consider meaningful in relation to marine pest biosecurity.”
Capital Territory. The two remaining interviewees were                Respondents were also asked to describe the nature of their
representatives of a research and development organization and        affiliated organization and aspects of marine pest biosecurity with
a not-for-profit environmental NGO. In total, we identified 12        which they are involved. The survey was hosted on SurveyGizmo
policy forums, which are displayed in Table 1.                        between 6 December 2017 and 21 January 2018, with invitations
                                                                      to complete the survey emailed to the 681 individuals in the
In order to obtain a sample of individuals participating in the
                                                                      stakeholder database. A response rate of 35% was achieved,
marine pest network, we consulted with Marine Pest Sectoral
                                                                      totaling 237 observations.
Committee members. Workshop participants provided us with
contact details for known relevant stakeholders, as well as minutes   Ideally, the unit of analysis would be at the level of the individual
of policy forum meetings. Contacts were supplemented with             stakeholder. However, many survey respondents were able to
organizational stakeholders identified with an internet search.       identify a particular organization with whom they interacted
Ecology and Society 25(3): 18
https://www.ecologyandsociety.org/vol25/iss3/art18/
could respond on behalf of their organization. Our analysis was
Table 1. Policy forums. nonweighted so that ties between organizations were defined
simply as either existing or not, even if a tie happened to be based
Forum details Participating Individual on interactions between multiple individuals across organizations.
organizations attendances Note too that data regarding the Department of Agriculture and
or their branches at the forum Water Resources, which serves a substantial and importantly
(node counts) (tie counts)
diverse role in the network, was sufficiently rich that it could be
Consultative Committee for 16 87 disaggregated to the branch level rather than the department as
Introduced Marine Pest Emergencies
Marine Pest Sectoral Committee 13 64
a whole.
Marine Pest Sectoral Committee - 9 11 Survey respondents represented 118 distinct organizations and
Marina and Slipways Task Group
nominated interactions with an additional 186 organizations that
Marine Pest Sectoral Committee - 10 16
Surveillance and Diagnostics Strategy were not surveyed, yielding a total of 304 organizations. Each
Scoping Group organization was assigned to one of 13 categories based on the
Marine Pest Sectoral Committee - 39 96 scope of their operation (Table 2.)
Partner Workshop
Marine Pest Sectoral Committee - 7 8 Not only were respondents asked to identify those with whom
Strategy Development Task Group they interacted, but also the nature(s) of those interactions. In
Marine Pest Sectoral Committee - 23 33 this paper we are specifically interested in interactions relating to
Surveillance Strategy Task Group research and development, active surveillance, passive
National Biosecurity Committee 15 61
New South Wales (state) Marine Pest 7 32
surveillance, and education and awareness raising. Table 3
Working Group displays an extract from the survey related to these activities.
Queensland (state) - Inter-Agency 8 17
Marine Pest Reference Group
West Australian (state) Biosecurity 3 9
Table 3. Extracts from survey.
Senior Officer Group
South Australian (state) Marine 10 16 Have you provided any marine pest related information or advice to any
Biosecurity Forum other people over the last 12 months? Who did you provide marine pest
related information or advice (individual and organisation?) The full
survey had additional options for the nature of interaction which are not
analysed (Emergency response; On-going management; Policy /
regulation; Consultancies/services; and Preparedness)
Table 2. Organizations. Type of information you provided to them (select one or more from):
• R&D
Organizational category Count (1) Provided (2) Asked Both (1) • Active surveillance
information community and (2) • Passive surveillance
to for • Education/awareness
community information
Have you asked for marine pest related information or advice from any
Australian Government 28 2 0 0
other people over the last 12 months? Who have you asked for marine
agency
pest related information or advice over the last 12 months (individual and
State/territory 31 12 3 2
organisation?)
government agency
State-owned corporation 2 0 0 0
Type of information you asked them for (select one or more from):
Local government 2 1 0 0
• R&D
Industry association/body 25 1 0 0
• Active surveillance
Nongovernment 9 0 0 0
• Passive surveillance
organization
• Education/awareness
Private company/business 114 5 0 0
Education/extension 9 2 1 1
organization
When individuals responded that they interacted with vessel
Research/training 27 0 0 0
organization owners, the general public, or fishers, responses typically indicated
International government 10 2 0 0 general interactions with such a group without naming a specific
NRM/Regional 13 1 0 0 person or organization. Capturing community interactions was
government critical, but these responses were too general and did not lend to
Vessel services (e.g., 9 1 0 0 having specific vessel/general public/fisher organizations as
marina, slipway)
Port managers 25 1 0 0 individual actors in the network analysis. In order to overcome
Total 304 28 4 3 this issue, we identified whether each individual organization
interacted with a generic community and treated this as a binary
(yes/no) attribute attached to each organization, rather than as
regarding marine pests, but did not recall or chose not to identify network ties between network actors. The number of
individuals. As such, it was necessary to aggregate responses so organizations reporting community interactions tabulated by
that the unit of analysis became the respondent’s affiliated organizational category is shown in Table 2.
organization, rather than the respondent as an individual. For
many larger organizations, this meant that multiple individualsEcology and Society 25(3): 18
https://www.ecologyandsociety.org/vol25/iss3/art18/
Fig. 4. Over and under-representation of configurations. With +/++/+++ representing 90/95/99% significance
for overrepresentation (- indicating under). For full results see Appendix 1, noting these results come from both
exponential random graph model (Table A1.1) or goodness-of-fit (Table A1.2). The model fixes the structure of
forum participation. Configurations [9] and [10] are both weighted configurations. See AinSA/AoutSA from
Wang et al. (2014).
Semistructured interviews organization; nonrespondents could be represented in the
Guided by the network data collection process, semistructured network where they were identified by an organization that did
interviews with eight key informants were conducted to provide have survey respondents. The assumption was that this was
a more nuanced understanding of the network function and sufficient for their network position to be adequately represented
structure (Alexander et al. 2017). Interviewees were selected based in the data, noting that the data are a sample of an unobserved
on their position in the network, with the aim of achieving a population. Because the analysis generally focused on the global
spread across the states/territories and network roles. Interviewees network between organizations, the ties under consideration only
represented Australian Government (n = 1) and state/territories involved the connection between different organizations. For
government (n = 2), a community group (n = 2), training example, if someone nominated a colleague within their branch,
organization (n = 1), seafood industry body (n = 1), consultancy this tie was excluded. Networks are often discussed as if they are
business (n = 2), and a port corporation (n = 1). Note that some static entities. However, networks are evolving entities in terms of
interviewees represented more than one role and some interviews actors, resources, and power distribution (Carlsson and
involved two interviewees. Interviews were focused on finding out Sandström 2007). We are therefore only able to provide a snapshot
what networks were used for, by who and how. in broad brush strokes of a network that is, in reality, dynamic.
We provide limited insight into whether interactions form part of
Limitations long-term collaborations or short-term engagements, whether
A key assumption was that an organization could be included in they are the result of informal connections or formal agreements.
the network data even where there were no respondents from that We also acknowledge our dataset represents a sample rather thanEcology and Society 25(3): 18
https://www.ecologyandsociety.org/vol25/iss3/art18/
a population, though the statistical methods used are robust to This assumption allows for missing ties to be imputed each time
sample data. the algorithm simulates a network. We ran a Bayesian model
specifying that ties between nonrespondents were missing. The
RESULTS results were not meaningfully different, suggesting our
We ran five exponential random graph models where actor-actor assumption that the survey provides a good sample of the network
ties (microlevel network, Fig. 1) varied according to what holds.
knowledge was shared: (1) any, (2) passive surveillance, (3) either
passive or active surveillance, (4) research and development, (5) DISCUSSION
education and awareness. The same fixed actor-forum network In the event of a marine pest incursion, emergency institutional
(meso, Fig. 1) was used in all model runs. Where selected responses are activated (Australian Government 2018).
configurations (Fig. 3) did not converge, we proxied a test for Preparedness for such emergencies relies on a foundation of
significance using goodness-of-fit (Appendix 1, Table A1.2). coordinated communications in order to raise awareness, share
Figure 4 hence combines both network statistical modeling and research developments, and support surveillance. Although
simulation. biosecurity emergencies require institutional structures that
balance both rapid response across multiscales as well as venues
The propensity for network bonding is indicated by homophily,
for political decision making (McAllister et al. 2015, 2017), the
reciprocity, and closed structures. Results show actors of a certain
Australian marine pest network primarily needs the propensity
type (Table 2) were significantly more likely to provide
to disseminate and capture information across diverse
information to, or receive information from, actors of the same
geographies and stakeholders. Whereas emergency response
type (Fig. 4, [1]). The model also showed reciprocal sharing of
needs to manage risky and contested social interactions, and
information was statistically more likely than by chance [2]. Both
hence needs regions of bonding capital with its dense and
homophily and reciprocity had the propensity to reinforce existing
overlapping interactions (Berardo 2014a, b), the Australian
behaviors and knowledge. In contrast other modeled
marine pest network needs structural bridges to predispose
configurations showed a propensity for bridging [9-13]. There was
information flows (Angst et al. 2018).
statistical evidence of an abundance of key hubs for both receiving
and providing information [10-11] and a corresponding lack of We studied the foundational role of the Australian marine pest
close-structures [3-5]. There was also evidence that more actors network.
had no outgoing ties than can be explained by chance alone [7-8].
For attendees of policy forums there was no evidence they were How well predisposed is the network to enable effective
more likely to share information with each other outside of the information dissemination?
forum (Fig. 4, [5]). We quantitatively tested 16 network configurations, each
indicative of either bonding or bridging capital. Overall, despite
Actors coded as having links to the community showed a strong evidence of bonding through homophily and reciprocity, the
predisposition for providing rather than receiving information network is well structured for coordination and rapid
(Fig. 4, [14-15]), and with more bridging structures than could be dissemination of information. In particular, the Australian
expected by chance alone [16]. Most community linkages were via marine pest network shows a structural propensity for bridging
state/territory government (31 organizations, 14 with community configurations with key hubs for both provision and receiving of
links, Table 2), and nearly all references to such community information (Fig. 4). There were significantly more actors than
interactions involved actors providing information to expected that sent information but did not receive information.
communities (totaling 28, Table 2) rather than receiving This suggests that the network hubs for sending information have
information from community (totaling 4). more clearly defined roles than do hubs for receiving information.
All networks were a subset of (a) all-ties, with (b) passive Information flows around research and development were the
surveillance containing 24.3% of the all-ties network, (c) passive exception in showing stronger elements of bonding through well-
+ active surveillance 49.9%, (d) research and development 34.4%, connected clusters of organizations.
and (e) education and awareness 37.0%. All five models gave Semistructured interviews suggested government organizations
comparable findings with perhaps the exception of research and held key positions in the network’s core, but their reach was deeply
development, which showed bonding through selected closed dependent on the network’s connectivity with on-ground
structures (Fig. 4, 3e-4e]). organizational types, such as consultancies, port authorities, and
Note that 187 organizations were mapped in the network not resource and energy companies. Interviews also suggested some
because they responded to the survey, but because they were collective learning across the network, where stakeholders not
identified by one or more survey respondents. Our methods had only received information, but synthesized before on-sharing. For
no scope of measuring any potential ties between pairs within the example, a consultancy representative interviewed with specialist
set of 187 organizations. We assumed that we captured critical experience spoke to the information received from the different
actors within the scope of survey respondents. However, we also sources and the continual reshaping of his own knowledge and
tested if treating potential ties as “missing” influenced the results insights that he subsequently shared with others. A broad set of
using a Bayesian exponential random graph model (Caimo and organizations support efficient information dissemination
Friel 2011). Bayesian models can account for missing ties if the throughout the network, with many private companies well
set of ties not sampled is known and ties are assumed to be positioned to play brokering roles. Such actors are also likely to
“missing at random” (Koskinen et al. 2013); that is, the have insights into the barriers and opportunities that their clients
“missingness” of a tie does not depend on node-level covariates. face, including innovative practices and ideas with relevance forEcology and Society 25(3): 18
https://www.ecologyandsociety.org/vol25/iss3/art18/
other network actors. The combined picture that emerged from information to/from. In the network any in-tie between two actors
both quantitative and qualitative data was that of a network where was defined by either a receiver stating they sought information,
government plays a key role in shaping the network, but where or equally the sender stating they provided it. Overall 454
some brokering and knowledge integration was decentralized organizations reported providing information, while only 301
across nongovernment actors. reported receiving. Survey respondents were most likely to come
from the most active/central organizations, partly because those
How do informal organizational stakeholder interactions with clear roles were targeted, and partly because central players
structure around policy forums? most completely identified with the content matter (Australian
Our network contained 157 cases of organizational participation Department of Agriculture and Water Resources compared to a
across 13 policy forums (Table 1). However, we found no evidence yacht owner, etc.). Yet the higher reporting of sending
that any two participants of a forum were more likely to share information over receiving may suggest a self-perception of
information outside of that forum setting. The trust-building, providing rather than listening, or dissemination rather than
problem-defining, and risk-management that might otherwise be learning.
associated with bonding capital around such forums (Berardo
2014b) may well be provided for within the policy forums (Fischer The over-representation of information provision from
and Leifeld 2015). Regardless, the open-configurations associated government organizations to on-ground actors is unlikely to
with forums participation suggest a predisposition for bridging sustain any collective outcomes. This is not to suggest that the
relationships with nonparticipants, adding to the network’s ability state/territory’s roles should necessarily be active at the periphery
to share information widely across the network. in community engagement. In the absence of on-ground extension
roles in Australian biosecurity, existing active local actors could
This is supported by interviews suggesting state/territory be incentivized to boost links to the community and with a focus
governments are key participants in forums and are well- on capturing community information. For example, local
connected with other organization types in the network; they are government could logically play a role in filling this gap. Only
well placed to translate information between different groups, three local government actors were active in the network data
such as research findings to different on-ground users. The role (three organizations, one with a community out-link; Table 3).
of Marine Pest Sectoral Committee - Partner Workshop in scale- Local government was not core to the sampling strategy, which
bridging particularly suggests engagement is happening with a is a limitation to the study, but they are well positioned through
wide group of nongovernment actors. It shows the important role their connection with state/territory governments to engage with
of key venues, like the Marine Pest Sectoral Committee - Partner local groups about protecting the local marine environment.
Workshop (Table 1), in providing a forum for receiving and
providing information to nongovernment partners. From the Broad implications
interviews, it was also clear that Marine Pest Sectoral Committee Managing marine pest biosecurity along Australia’s extensive
and the Australian Department of Agriculture and Water coastline requires collaboration that is supported by a widely
Resources staff greatly valued this forum. However, there were distributed on-ground network with diverse actors (Australian
mixed views with some nongovernment interviewees perceiving Government 2015). There are legislated responsibilities for
the Partner Workshop as mainly involving Department of marine pest management in times of emergency response, but as
Agriculture and Water Resources staff providing updates to a foundation for any response, the marine pest network that
attendees. structures on-going coordinated communications and both
passive and active surveillance is essential. Our study shows the
How well predisposed is the network to engage communities in existing Australian marine pest network is well-structured for
two-way information? information dissemination and there is evidence that
Actors with links to the broader community play more prominent nongovernment actors already play some role in integrating and
bridging roles than could be expected by chance alone (Fig. 4). brokering information. Any improvements could focus on
However, one potential concern is the imbalance between ties for incentivizing local actors to facilitate stronger two-way
providing information to the community compared to a near relationships with communities, which are currently lacking.
absence of ties for receiving information from the community
(Table 2). This study not only unpacks an important case study. It also adds
methodological progress to the empirical study of the interactions
Discussions with Marine Pest Sectoral Committee members between policy structures and the related interactions that occur
revealed some state/territory governments had elaborate around them. Although the study has a practical focus, its
community engagement strategies in place for marine pests. This theoretical roots are in how networks structure around issues of
may explain why state/territories had the most community links social and political risk. In interactions in the marine pest network
(31 organizations, 12 with out-ties to community, 3 with in-ties there are low risks because most relate to sharing information, as
from community; Table 3). However, other states were lagging opposed to making decisions which may directly effect the
and still looking at ways to strengthen engagement with on- distribution of resources. Studies of biosecurity emergency
ground players, while education and awareness-raising was ad- response, where decisions are made around resource allocation,
hoc and occurring only during incursions, for example. have shown related networks have regions of bonding capital
Two-way information flows are fundamental in building trust- (McAllister et al. 2015, 2017). Our finding that the marine pest
based relationships (Kruger et al. 2010). Although statistically network has a structure indicative of bridging capital adds
results show significant reciprocity, there are subtleties in the data. evidence to theory suggesting stakeholder networks emerge in
The survey asked respondents who they received/provided response to the particular social risks they face (Berardo and
Scholz 2010).Ecology and Society 25(3): 18
https://www.ecologyandsociety.org/vol25/iss3/art18/
Responses to this article can be read online at: International Journal of the Commons 8(1):236-258. https://doi.
http://www.ecologyandsociety.org/issues/responses. org/10.18352/ijc.463
php/11583 Berardo, R., and M. Lubell. 2019. The ecology of games as a
theory of polycentricity: recent advances and future challenges.
Policy Studies Journal 47(1):6-26. https://doi.org/10.1111/
psj.12313
Acknowledgments:
Berardo, R., and J. T. Scholz. 2010. Self-organizing policy
We are grateful to those who contributed their data to our study, as
networks: risk, partner selection, and cooperation in estuaries.
well as the excellent reviews we received through the journal review
American Journal of Political Science 54(3):632-649. https://doi.
process. We also thank CSIRO’s Brendan Trewin and Andrew
org/10.1111/j.1540-5907.2010.00451.x
Terhorst, and the Australian Government’s Peter Wilkinson, Rob
Kancans, and Bart Woodham who all gave critical input into the Bodin, Ö., and M. Tengö. 2012. Disentangling intangible social-
research and on various drafts on the paper. Ethics was approved ecological systems. Global Environmental Change 22(2):430-439.
through CSIRO’s Human Research Ethics (114/17). https://doi.org/10.1016/j.gloenvcha.2012.01.005
Caimo, A., and N. Friel. 2011. Bayesian inference for exponential
Data Availability Statement: random graph models. Social Networks 33(1):41-55. https://doi.
org/10.1016/j.socnet.2010.09.004
The data are not publicly available because of restrictions as agreed
as part of human ethics. Please contact lead author RRJMcA to Carlsson, L. G., and A. C. Sandström. 2007. Network governance
discuss any data that may be potentially available. of the commons. International Journal of the Commons 2
(1):33-54. https://doi.org/10.18352/ijc.20
LITERATURE CITED Cook, E., R. Payne, A. Macleod, and S. Brown. 2016. Marine
Alexander, S. M., D. Armitage, P. J. Carrington, and Ö. Bodin. biosecurity: protecting indigenous marine species. Research and
2017. Examining horizontal and vertical social ties to achieve Reports in Biosecurity Studies 5:1-14. https://doi.org/10.2147/rrbs.
social-ecological fit in an emerging marine reserve network. s63402
Aquatic Conservation: Marine and Freshwater Ecosystems 27 Curnock, M., C. Farbotko, K. Collins, C. J. Robinson, and K.
(6):1209-1223. https://doi.org/10.1002/aqc.2775 Maclean. 2017. Engaging with risk (or not): shared responsibility
Alexander, S. M., Ö. Bodin, and M. L. Barnes. 2018. Untangling for biosecurity surveillance and the role of community gardens.
the drivers of community cohesion in small-scale fisheries. Geographical Research 55(4):379-394. https://doi.
International Journal of the Commons 12(1):519-547. https://doi. org/10.1111/1745-5871.12231
org/10.18352/ijc.843 Efron, B. 1979. Bootstrap methods: another look at the jacknife.
Angst, M., A. Widmer, M. Fischer, and K. Ingold. 2018. Annals of Statistics 7:1-26. https://doi.org/10.1214/aos/1176344552
Connectors and coordinators in natural resource governance: Fischer, A. P., and L. Jasny. 2017. Capacity to adapt to
insights from Swiss water supply. Ecology and Society 23(2):1. environmental change: evidence from a network of organizations
https://doi.org/10.5751/ES-10030-230201 concerned with increasing wildfire risk. Ecology and Society 22
Australian Government. 2015. Review of national marine pest (1):23. https://doi.org/10.5751/ES-08867-220123
biosecurity. Department of Agriculture and Water Resources, Fischer, M., and P. Leifeld. 2015. Policy forums: why do they exist
Canberra, Australia. and what are they used for? Policy Sciences 48:363-382. https://
Australian Government. 2018. MarinePestPlan 2018-2023: the doi.org/10.1007/s11077-015-9224-y
National Strategic Plan for Marine Pest Biosecurity. Department Floerl, O. 2014. Managment challenges and opportunities for
of Agriculture and Water Resources, Canberra, Australia. marine biosecurity in the Arctic. Pages 57-68 in L. Fernandez, B.
Barnes, M., Ö. Bodin, A. Guerrero, R. McAllister, S. Alexander, A. Kaiser, and N. Verstergaard, editors. Marine invasive species
and G. Robins. 2017. Theorizing the social structural foundations in the Arctic. Nordic Council of Ministers, Copenhagen,
of adaptation and transformation in social-ecological systems. Denmark.
Ecology and Society 22(4):16. https://doi.org/10.2139/ssrn.2932575 Frank, O., and D. Strauss. 1986. Markov graphs. Journal of the
Barnes, M. L., Ö. Bodin, T. R. McClanahan, J. N. Kittinger, A. American Statistical Association 81(395):832-842. https://doi.
S. Hoey, O. G. Gaoue, and N. A. J. Graham. 2019. Social- org/10.1080/01621459.1986.10478342
ecological alignment and ecological conditions in coral reefs. Granovetter, M. 1983. The strength of weak ties: a network theory
Nature Communications 10:2039. https://doi.org/10.1038/ revisited. Sociological Theory 1:201-233. https://doi.org/10.2307/202051
s41467-019-09994-1
Granovetter, M. S. 1973. The strength of weak ties. American
Berardo, R. 2014a. Bridging and bonding capital in two-mode Journal of Sociology 78:1360-1380. https://doi.org/10.1086/225469
collaboration networks. Policy Studies Journal 42(2):197-225.
https://doi.org/10.1111/psj.12056 Guerrero, A. M., R. R. J. McAllister, and K. A. Wilson. 2015.
Achieving cross-scale collaboration for large scale conservation
Berardo, R. 2014b. The evolution of self-organizing initiatives. Conservation Letters 8(2):107-117. https://doi.
communication networks in high-risk social-ecological systems. org/10.1111/conl.12112Ecology and Society 25(3): 18
https://www.ecologyandsociety.org/vol25/iss3/art18/
Hamilton, M., A. P. Fischer, and A. Ager. 2019. A social- outbreaks across scales. Ecology and Society 20(1):67. https://doi.
ecological network approach for understanding wildfire risk org/10.5751/ES-07469-200167
governance. Global Environmental Change 54:113-123. https://
Metz, F., M. Angst, and K. Ingold. 2020. Policy integration: Do
doi.org/10.1016/j.gloenvcha.2018.11.007
laws or actors integrate issues relevant to flood risk management
Hamilton, M., M. Lubell, and E. Namaganda. 2018. Cross-level in Switzerland? Global Environmental Change 61:101945. https://
linkages in an ecology of climate change adaptation policy games. doi.org/10.1016/j.gloenvcha.2019.101945
Ecology and Society 23(2):36. https://doi.org/10.5751/ES-10179-230236
Nita, A., L. Rozylowicz, S. Manolache, C. M. Ciocãnea, I. V. Miu,
Jasny, L., M. Johnson, L. K. Campbell, E. Svendsen, and J. and V. D. Popescu. 2016. Collaboration networks in applied
Redmond. 2019. Working together: the roles of geographic conservation projects across Europe. PLoS ONE 11(10):
proximity, homophilic organizational characteristics, and e0164503. https://doi.org/10.1371/journal.pone.0164503
neighborhood context in civic stewardship collaboration
Nyantakyi-Frimpong, H., P. Matouš, and M. E. Isaac. 2019.
networks in Philadelphia and New York City. Ecology and Society
Smallholder farmers’ social networks and resource-conserving
24(4):8. https://doi.org/10.5751/ES-11140-240408
agriculture in Ghana: a multicase comparison using exponential
Koskinen, J. H., G. L. Robins, P. Wang, and P. E. Pattison. 2013. random graph models. Ecology and Society 24(1):5. https://doi.
Bayesian analysis for partially observed network data, missing org/10.5751/es-10623-240105
ties, attributes and actors. Social Networks 35(4):514-527. https://
Ostrom, E. 2010. Beyond markets and states: polycentric
doi.org/10.1016/j.socnet.2013.07.003
governance of complex economic systems. American Economic
Kruger, H. 2016. Designing local institutions for cooperative pest Review 100(3):641-672. https://doi.org/10.1257/aer.100.3.641
management to underpin market access: the case of industry
Perry, E. E., D. H. Krymkowski, and R. E. Manning. 2019.
driven fruit fly area-wide management. International Journal of
Brokers of relevance in National Park Service urban collaborative
the Commons 10(1):176-199. https://doi.org/10.18352/ijc.603
networks. Ecology and Society 24(4):3. https://doi.org/10.5751/
Kruger, H., N. Stenekes, R. Clarke, and A. Carr. 2010. Biosecurity ES-11124-240403
engagement guidelines: practical advice for involving communities.
Reed, M. S., and R. Curzon. 2015. Stakeholder mapping for the
Science for decision makers. Australian Government Bureau of
governance of biosecurity: a literature review. Journal of
Rural Sciences, Barton, Australian Capital Territory, Australia.
Integrative Environmental Sciences 12(1):15-38. https://doi.
Lubell, M. 2015. Collaborative partnerships in complex org/10.1080/1943815X.2014.975723
institutional systems. Current Opinion in Environmental
Robins, G., and M. Morris. 2007. Advances in exponential
Sustainability 12:41-47. https://doi.org/10.1016/j.cosust.2014.08.011
random graph (p*) models. Social Networks 29(2):169-172.
Lubell, M., G. Robins, and P. Wang. 2014. Network structure and https://doi.org/10.1016/j.socnet.2006.08.004
institutional complexity in an ecology of water management
Summerson, R., M. Skirtun, K. Mazur, T. Arthur, R. Curtotti,
games. Ecology and Society 19(4):23. https://doi.org/10.5751/
and R. Smart. 2013. Economic evaluation of the costs of biosecurity
ES-06880-190423
response options to address an incursion of Mytilopsis sallei (black-
Maclean, K., C. Farbotko, A. Mankad, C. J. Robinson, M. striped mussel) into Australia. Australian Governmnet
Curnock, K. Collins, and R. R. J. McAllister. 2018. Building social (ABARES), Canberra, Australia.
resilience to biological invasions. A case study of Panama Tropical
Wang, P., G. Robins, P. Pattison, and J. H. Koskinen. 2014.
Race 4 in the Australian Banana Industry. Geoforum 97:95-105.
MNNet: program for the simulation and estimation of (p*)
https://doi.org/10.1016/j.geoforum.2018.10.018
exponential random graph Models for Multilevel networks.
Maclean, K., C. Farbotko, and C. J. Robinson. 2019. Who do Melbourne University School of Psychological Sciences,
growers trust? Engaging biosecurity knowledges to negotiate risk Melbourne, Australia.
management in the north Queensland banana industry, Australia.
Wang, P., G. Robins, P. Pattison, and E. Lazega. 2013.
Journal of Rural Studies 67:101-110. https://doi.org/10.1016/j.
Exponential random graph models for multilevel networks. Social
jrurstud.2019.02.026
Networks 35(1):96-115. https://doi.org/10.1016/j.socnet.2013.01.004
Mankad, A. 2016. Psychological influences on biosecurity control
Wasserman, S., and P. Pattison. 1996. Logit models and logistic
and farmer decision-making. A review. Agronomy for Sustainable
regressions for social networks. 1. An introduction to Markov
Development 36:40. https://doi.org/10.1007/s13593-016-0375-9
graphs and p. Psychometrika 61:401-425. https://doi.org/10.1007/
McAllister, R. R. J., C. J. Robinson, A. Brown, K. Maclean, S. bf02294547
Perry, and S. Liu. 2017. Balancing collaboration with
coordination: contesting eradication in the Australian plant pest
and disease biosecurity system. International Journal of the
Commons 11(1):330-354. https://doi.org/10.18352/ijc.701
McAllister, R. R. J., C. J. Robinson, K. Maclean, A. M. Guerrero,
K. Collins, B. M. Taylor, and P. J. De Barro. 2015. From local to
central: a network analysis of who manages plant pest and diseaseTable A1.1: Exponential Random Graph Models; fixed meso-level (actor-forums) network. Count, model parameter, t-score for parameter, with */**/*** signifying
90/95/99% significance.
Config. See Wang et al. All-Ties Passive Surveillance Both Active and Passive Education and Awareness Research and
2014 Surveillance Development
ArcA [643] -7.82 (-48.56)*** [156] -8.73 (-35.49)*** [321] -8.72 (-46.36)*** [218] -8.56 (-39.25)*** [238] -7.41 (-57.91)***
ReciprocityA [125] 4.74 (25.10)*** [24] 3.66 (8.86)*** [58] 4.30 (15.53)*** [21] 3.04 (7.32)*** [36] 4.03 (13.25)***
T1A [38] -0.13 (-0.89) [0] no convergence [4] -1.05 (-2.14)** [0] no convergence [38] no convergence
SinkA [125] 1.44 (4.30)*** [55] 0.70 (1.10) [101] 1.59 (3.36)*** [106] 2.56 (4.75)*** [65] no convergence
SourceA [26] -0.02 (-0.04) [17] -1.31 (-2.07)** [22] -1.32 (-2.47)*** [22] -2.62 (-4.22)*** [23] no convergence
AinSA [623.9] 0.39 (2.03)** [100.8] 1.13 (2.54)*** [240.8] 1.19 (3.89)*** [111.8] 1.93 (5.27)*** [194.4] no convergence
AoutSA [832.1] 0.89 (5.34)*** [171.4] 1.13 (3.16)*** [390.3] 0.91 (3.43)*** [270. 9] 0.12 (0.35) [271.3] no convergence
SenderA [247] 0.73 (6.48)*** [76] 0.43 (1.91)* [151] 0.66 (4.28)*** [113] 1.02 (4.95)*** [105] 1.83 (8.74)***
_ReceiverA [172] 0.09 (0.50) [44] -0.62 (-1.50) [81] -0.37 (-1.37) [42] 0.17 (0.47) [55] 0.35 (1.12)
_InteractionA [57] -0.47 (-2.50)*** [31] 0.55 (1.38) [44] 0.02 (0.08) [26] -0.86 (-2.21)** [27] -0.93 (-2.83)***
_MatchA [186] 0.62 (7.86)*** [49] 0.65 (3.90)*** [96] 0.64 (5.82)*** [56] 0.45 (2.70)*** [71] 0.69 (4.99)***
In2StarAX [1616] 0.23 (7.49)*** [439] 0.23 (3.76)*** [809] 0.21 (4.61)*** [441] 0.05 (0.85) [588] 0.25 (6.32)***
Out2StarAX [1992] 0.15 (7.82)*** [627] 0.12 (3.29)*** [1135] 0.13 (5.27)*** [991] 0.19 (5.72)*** [791] 0.21 (6.89)***
TXAXarc [422] -0.07 (-1.69)* [173] -0.10 (-1.35) [265] -0.08 (-1.50) [232] 0.11 (1.59) [188] -0.01 (-0.25)Table A1.2: Goodness-of-fit. Selected parameters in addition to fitted configurations from Table A1: Count, average from simulated graphs, t-score for difference, */**/*** signifying 90/95/99% significance. Note all fitted parameters reports
You can also read