The value of urban and peri-urban conservation efforts within a global biodiversity hotspot - SciELO SA
←
→
Page content transcription
If your browser does not render page correctly, please read the page content below
Bothalia - African Biodiversity & Conservation
ISSN: (Online) 2311-9284, (Print) 0006-8241
                                                          Page 1 of 10     Original Research

             The value of urban and peri-urban conservation
               efforts within a global biodiversity hotspot

 Authors:                              Background: Systematic conservation planning (SCP) is a key tool in conservation prioritisation.
 Lyle E. Ground1,2
                                       It has recently been applied within the eThekwini Municipal Area (EMA), South Africa, a
 Rob Slotow3,4
 Jayanti Ray-Mukherjee5                rapidly developing metro located within a biodiversity hotspot. Most vegetation types within
                                       this region are threatened, yet have received limited scientific attention.
 Affiliations:
 1
  Environmental Planning and           Objectives: To assess forb biodiversity of coastal and near-coastal grasslands and contextualise
 Climate Protection                    potential drivers of species variation to the EMA context.
 Department, eThekwini
 Municipality, Durban,                 Method: We quantified forb species richness, frequency and species composition, determined
 South Africa                          the variation of these amongst plots and sites, and assessed which variables were responsible
                                       for this variation.
 College of Health Sciences,
 2

 University of KwaZulu-Natal,          Results: Site forb species richness ranged from 33 to 84 species per site, with the most frequent
 Durban, South Africa
                                       species differing across the seven sites. Beta diversity was higher across than within sites.
 School of Life Sciences,
 3                                     Distance to the closest traditional medicine market and site perimeter-to-area ratio were the
 University of KwaZulu-Natal,          greatest drivers of species richness, whilst altitude, aspect, mean temperature and rainfall
 Durban, South Africa                  seasonality were the main contributors to species composition patterns.
 4
  Department of Genetics,              Conclusion: SCP can use key environmental and climatic categories to improve selection
 Evolution and Environment,            of grasslands to maximise both species richness and variation in species composition. A
 University College, London,           more fine-scale systematic conservation plan will, in turn, provide a more robust basis for
 United Kingdom
                                       development decisions. The outcomes illustrate the importance of urban and peri-urban
 5
  School of Liberal Studies,           conservation efforts, including fine-scale conservation planning, in contributing to regional,
 Azim Premji University,               national conservation targets.
 Bengaluru, India

 Corresponding author:
 Lyle E. Ground,                      Introduction
 lyle.ground@durban.gov.za            Conservation planning and sustainable environmental management have limited resources
 Dates:                               for implementation owing to competition with other socio-economic imperatives (Heywood &
 Received: 01 June 2016               Iriondo 2003; Shankaran 2009; Schneider et al. 2011). Prioritisation of areas for conservation,
 Accepted: 14 Oct. 2016               through systematic conservation planning (SCP), has become a key tool in conservation resource
 Published: 02 Dec. 2016
                                      allocation (Heywood & Iriondo 2003; Margules & Pressey, 2000; Pressey, Cowling & Rouget 2003).
 How to cite this article:            These algorithm-based planning tools use available data on habitats, species and ecosystem
 Ground, L.E., Slotow, R. &           services to select priority sites based on important criteria (Margules & Pressey 2000). However,
 Ray-Mukherjee, J., 2016,             SCP outputs are only as good as the input data (Heywood & Iriondo 2003; Margules & Pressey
 ‘The value of urban and
 peri-urban conservation
                                      2000; Smith, Goodman & Matthews 2006), and conservation plans are often based on limited
 efforts within a global              data, which requires conservation planners to define different environmental features by using
 biodiversity hotspot’,               environmental breaks or changes (termed mesofilters; Crous, Samways & Pryke 2013). These
 Bothalia 46(2), a2106. http://       ‘surrogate’ habitats are then assumed to be representative of a set of species known to occur
 dx.doi.org/10.4102/abc.
 v46i2.2106                           within them (Crous et al. 2013; Smith et al. 2006). Incorrect selection of surrogates may result in
                                      inaccurate SCP that does not sufficiently represent reality, leading to potentially wasted resource
 Copyright:                           expenditure on marginal areas (Crous et al. 2013) and inappropriate protection for the species
 © 2016. The Authors.
                                      that need it most (Coppolillo et al., 2004).
 Licensee: AOSIS. This work
 is licensed under the
 Creative Commons                     The eThekwini Municipal Area (EMA), which includes the metropolitan city of Durban, is
 Attribution License.                 located on the central-southern coastal region of KwaZulu-Natal (KZN) Province and includes
                                      99 728 ha of the original extent of the KwaZulu-Natal Coastal Belt Biome (KZNCB; Mclean,
     Read online:                     Ground & Boon 2014; Rutherford et al. 2006). This municipality is a hub of development, and the
                    Scan this QR      remaining grassland vegetation within the municipality currently represents less than 25% of its
                    code with your
                    smart phone or    historical extent (eThekwini Municipality SDF 2013; Mclean et al. 2014; O’Conner 2005; Scott-
                    mobile device     Shaw & Styles 2012; Uys, Bond & Everson 2004). The EMA has distinct variations in climatic
                    to read online.
                                      conditions, with subtropical to temperate conditions at higher elevations (high rainfall seasonality,

                                             http://www.abcjournal.org     Open Access
Page 2 of 10 Original Research
high temperature seasonality, lower mean temperatures) The coastal and near-coastal grasslands of the EMA are
and subtropical to tropical conditions at lower elevations predominantly included in the Durban Metropole Grassland
approaching sea level (lower rainfall seasonality, lower vegetation type (KZN2), Northern Coastal Grassland (KZN16),
temperature seasonality, higher mean temperatures) owing Ngongoni Veld (SVs4), or KZN Sandstone Sourveld (SVs5;
to climatic regulation from the warm Mozambique ocean Rutherford et al. 2006). These grasslands are nationally
current (Rutherford et al. 2006). This variation has created a recognised as either vulnerable (SVs4), endangered (SVs5,
heterogeneous region that supports tropical, sub-tropical KZN16) or critically endangered (KZN2), respectively
and temperate mist-belt species (Eeley, Lawes & Piper 1999; (Rutherford et al. 2006). The percentage of these grassland
Rutherford et al. 2006). types that are formally conserved, ranges between 1% and
4% (Rutherford et al. 2006), and the total remaining area
The grassland ecosystems of KZN have, until recently, had of coastal and coastal-hinterland grassland within the
fairly limited scientific attention (O’Conner 2005; Scott-Shaw EMA is 13 534 ha, which is only 12% of the pre-1850
& Styles 2012; Uys et al. 2004; Zaloumis & Bond 2011), which distribution (Mclean et al. 2014). These grassland ecosystems
imposes the risk of poor selection and representation of are, therefore, under significant threat and require urgent
critical biodiversity areas (Crous et al., 2013). Graminoides scientific attention to optimise their conservation planning
make up the majority of the biomass of a grassland system and management within the EMA spatial development plan
and have historically been the main focus of scientific studies (Rutherford et al. 2006; Uys et al. 2009).
(Zaloumis & Bond 2011). Conversely, the non-graminoid
herbaceous component (commonly termed forbs, which The present study therefore attempts to improve the
include geophytes) contributes most to overall grassland understanding of coastal and near-coastal grasslands within
species richness (Uys et al. 2004; Zaloumis & Bond 2011). the central region of KZN, with a particular focus on key
anthropogenic and environmental factors influencing species
The scale of transformation in the EMA is likely to have richness, species composition, species frequency, and species
affected ecosystem integrity and associated functioning. turnover (or beta diversity). For this purpose, we sampled
Fragmentation will have led to the disruption of natural sites situated in or near to the urban/peri-urban matrix of
spatial disturbance patterns, particularly fire and grazing, the EMA region of KZN, which contained primary coastal
critical for the maintenance of the successional state of and near-coastal grassland. The main objectives of the
grasslands (Boakye et al. 2013; Snyman 2006; Uys et al. 2004). study were: (1) to quantify the species richness and identify
Management (including block burning, grazing regulation, the level of variation in forb species composition at plot,
alien plant clearing) is currently the primary method for site and regional scales of central KZN coastal grasslands;
ensuring simulation of natural disturbance. It is in these (2) to determine which disturbance, or biogeographic or
managed grasslands where one would expect to find environmental factors, may be responsible for any observed
higher species richness and a more representative species variation in forb species richness and composition; and
composition (comparative to unmanaged grassland; Uys (3) to understand the spatial distribution and frequency of
et al. 2004; Van Wilgen et al. 2014). The discrepancy between occurrence of species at different spatial scales.
species assemblages within and outside managed areas adds
an additional anthropogenic-derived level of heterogeneity
to an already complex ecosystem (Uys et al. 2004).
Methods
Study sites and sampling
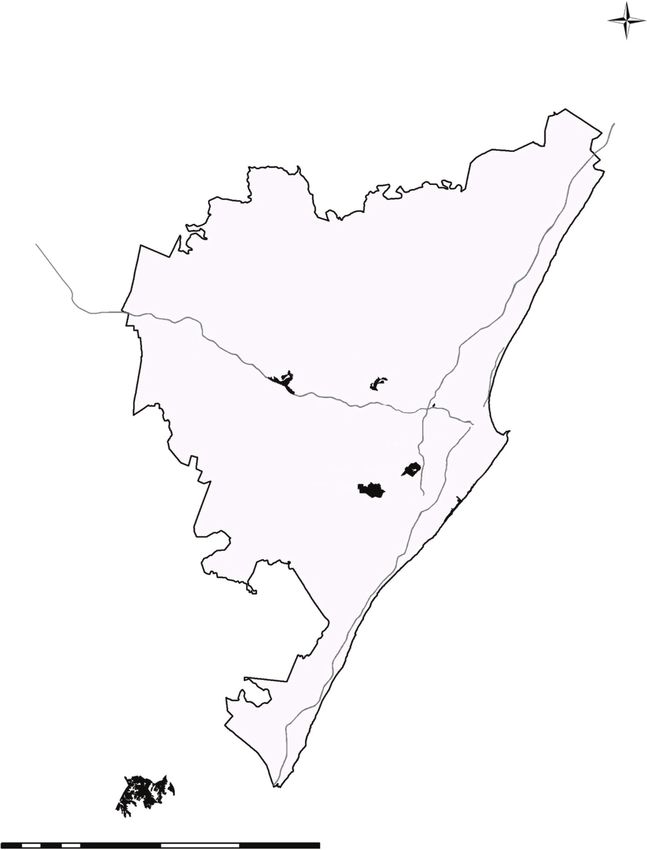
Understanding the primary drivers of species heterogeneity After initial site inspections, seven sites (four formal municipal
within a grassland ecosystem is critical in ensuring the reserves, two formal provincial nature reserves, and one
development of both adequate and accurate conservation municipal managed site) were sampled within the coastal
targets, and associated conservation site selection (Crous region of KZN (Table 1 and Figure 1). Six of the seven
et al. 2013; Pressey et al. 2003; Uys, Hamer & Slotow 2009). sites were located within the eThekwini Municipality (EM)
Scale is an important factor when investigating the while Vernon Crookes, considered a characteristic site for
mechanisms explaining species or ecosystem heterogeneity, primary central KZN grassland in good condition, is located
as various factors have differing levels of influence at approximately 60 km south of the EM’s southern boundary,
different scales (Gonzalez-Megias, Gomez & Sanchez-Pinero within a peri-urban setting, similar to that of outlying areas
2007; Huston, 1999). What may affect a particular site or area of the EM (Figure 1; Rutherford et al. 2006).
may not be as significant at a regional scale; similarly, a
locally dominant species may be rare regionally, or a species A total of 36 plots were sampled across the seven sites
recorded throughout a region may be sporadic in its local (Table 1). At each site, a number of 10 m x 10 m plots were
distribution (Gonzalez-Megias et al. 2007; Honnay & Hermy set out using tape measures and marker pegs. Species
2004; Hanski, 1994). These distributional differences may be accumulation curves were used to determine required
caused by site-specific anthropogenic disturbances, or might sampling effort (Willott 2001). Sampling was undertaken
be explained by environmental heterogeneity. Knowing the between October and March to ensure that seasonal forbs
drivers of plant species abundance (including rarity) will would be conspicuous. The positioning of plots within each
significantly improve SCP output accuracy (Crous et al. 2013). site was done in a manner which covered as many grassland
http://www.abcjournal.org Open AccessPage 3 of 10 Original Research
TABLE 1: Description of the managing agent, altitude, surrounding land uses, geology, location, condition, management period, size, number of plots, species richness,
plot richness range and mean plot richness, of the sampled sites.
Site Managing Mean Surrounding Underlying GPS location Perceived Management Open space Number of Forb species Plot forb Mean plot
agent altitude land uses geology (degrees) condition period‡ (ha) 10 x 10 m richness richness richness
(m.a.s.l.) (degraded sample plots range (95% CI)
1–5 pristine)†
Giba Gorge eThekwini 574 High-income Natal Group -29.80012972 4 Short 323 6 54 13–28 19.0 (±6.40)
environmental Municipality residential, Sandstone 30.76674694
precinct national
(Giba East) freeway
New Germany eThekwini 347 Middle- Natal Group -29.80022389 4 Long 106.6 6 67 20–28 24.0 (±3.70)
Municipality income Sandstone 30.88358028
residential
Sherwood eThekwini 143 Middle – Natal Group -29.83347111 2 None 17.0 4 50 22–28 25.0 (±5.51)
Municipality low-income Sandstone 30.95011417
residential,
national
freeway
Silverglen eThekwini 157 Lower Natal Group -29.91694361 4 Long 458 7 65 22–29 24.6 (±2.44)
Municipality middle- Sandstone 30.86667833
income
residential
Stainbank eKZN Wildlife 113 Middle- Natal Group -29.90026583 3 Long 211 5 55 17–25 21.0 (±4.39)
income Sandstone 30.93337778
residential
Treasure eThekwini 87 Middle- Berea -29.93355306 3 Short 17.8 4 33 14–19 16.8 (±3.53)
Beach Municipality income Formation 30.98346111
residential
Vernon eKZN Wildlife 425 Dense rural Natal Group -30.26670556 5 Long 2189 4 84 30–52 36.5 (±16.56)
Crookes residential Sandstone 30.60019972
†, 1 – severely degraded, 2 – moderately degraded, 3 – intermediate, 4 – good, 5 – pristine. Perceived condition was obtained from the local and provincial systematic conservation plans, and was
based on desktop assessments of condition indicators including basal coverage, erosion, and alien plant infestation.
‡, Long – > 10 years continuous management, Short > 5 years continuous management, None – no or sporadic management only.
patches as possible. Ten 1 m x 1 m subplots (quadrats) measured using the ‘distance tool’ in the ArcGIS v.10.1
were then randomly sampled within the plot. Forb species and EM’s 2012 high-resolution aerial imagery as a reference
presence-absence was recorded for each subplot. Species (Hartebeesthoek94 co-ordinate system).
identifications were confirmed using local field guides (Jeppe
1975; Pooley 2005), local experts, and the KZN Herbarium.
Data analysis
Photographic vouchers were taken for each unique species
found at each site for offsite identification and record keeping. Species frequency
The frequency of each species was calculated across all
Using ArcGIS v.10.1 (ESRI 2011. ArcGIS Desktop: Release 10. seven sites, based on their presence in the subplots. Species
Redlands, CA: Environmental Systems Research Institute), were ranked according to their frequencies within each site
sampling sites were digitised. Environmental, climatic and to understand the general trends of species distribution
disturbance variables for each of the 36 plots were extracted. patterns within and across sites. In order to determine the
Altitude was extracted from EM’s 2 m contour shapefile most frequent species at a site scale, a one-way similarity
(Survey and Land Information Department, eThekwini percentages species contributions (SIMPER) analysis was
Municipality). Aspect was extracted from the EM’s 10 m performed in PRIMER v.6 (Clarke & Gorley 2006) to describe
digital elevation model raster dataset (Corporate GIS the most frequent species, as a percentage of the frequency
Department, eThekwini Municipality). Mean rainfall, mean of occurrence within each plot of a site. Species frequencies
temperature, rainfall seasonality, and temperature seasonality of occurrence were examined at local and regional scales
were extracted from the WorldClim (Hijmans et al. 2005) to determine distribution patterns. ‘Regional distribution’
raster dataset. The size of the contiguous grassland patch in assesses the distribution of species across the different sites
which a plot was located and the size of the total natural in the study (widespread = present in ≥6 sites; restricted =
open spaces (total natural area, regardless of the relative present in >1 and ≤4 sites; highly restricted = present in
composition of vegetation types) were digitised using EM’s only 1 site). ‘Local distribution’ assesses the distribution of
2012 high-resolution aerial imagery (Survey and Land species within the sites by measuring the subplots in which
Information Department, eThekwini Municipality 2012) as they were present (widespread = present in ≥40 subplots;
reference. The areas of these shape files were then calculated restricted = present in ≤10 subplots).
in ArcGIS v. 10.1 using the ‘calculate field’ option in the shape
file attribute table section. The reserve perimeter/area ratio Beta diversity
was calculated initially by utilising the ‘calculate field’ option Shared and unique species between combinations of plots
to determine the boundary perimeter of each reserve, and and subplots were calculated using EstimateS (Colwell 2013).
then by completing a ratio calculation with the area of each Beta diversity was assessed based on the framework proposed
reserve. Distance to the nearest anthropogenic structure by Carvalho, Cardoso & Gomes (2012); where Βcc (value range
(e.g. house, factory, road) and distance to the closest major 0–1) reflects overall beta diversity and comprises components
traditional medicinal market, in this case the Durban of species turnover (β-3, replacement of species between sites)
City Centre Victoria Market (-29.856689°S, 31.015287°E), was and species richness differences (βrich, difference in species
http://www.abcjournal.org Open AccessPage 4 of 10 Original Research
N
N3
N2
Giba Gorge
Environmental
ST
New
FI R
Precinct
Germany
RUTH
Sherwood N3
LI
U
TH
Kenneth
RT LU
Stainbank
Silverglen Treasure
ALBE
Beach
SI
O
NK
I
Vernon
Crookes
Legend
Conserva on Areas
Main Roads
0 5 10 20 30 40
Km Ethekwini Municipality Boundary
FIGURE 1: Map illustrating the location of the different sites sampled in relation to major roads and the eThekwini Municipality boundary.
http://www.abcjournal.org Open AccessPage 5 of 10 Original Research
richness between sites; Carvalho et al. 2012). A Kruskal-Wallis to determine the contribution of multiple variables and
H-test was performed in SPSS (SPSS Inc., 2011) to determine their interactions. A principal coordinate analysis (PCO) was
if the mean of beta diversity measures within a site was employed to investigate patterns of correlations between
significantly different from beta diversity across sites. The environmental distances and species composition. BIOENV
βrich and β-3 values were standardised and compared in a was used in PRIMER to determine the best combination
Mann-Whitney test to determine which of these made a of environmental variables that correlated with the Bray-
greater contribution to Bcc (Gutt & Piepenburg 2003). Curtis species composition similarity matrix. BIOENV
examines patterns within an environmental factor matrix
Nestedness of the plots was assessed using a nestedness and a species composition resemblance matrix, and explores
metric based on overlap and decreasing fill (NODF) run in all the possible combinations of factors to determine what
ANINHADO (Guimarães & Guimarães 2006). In comparison combination of which factors best correlates with the species
with the nestedness temperature metric (which until recently resemblance pattern, and gives a coefficient value related to
had been the most popular nestedness metric used), the this (Clarke 1993).
former metric is not sensitive to matrix shape and size, and
therefore has a low probability for type I and type II error The Bayesian information criterion (BIC) was used to identify
(Almeida-Neto et al. 2008). The maximum level of nestedness the combinations of environmental variables that best explain
is obtained when a matrix has a complete overlap of presence species richness variation, identifiable by comparatively
across columns and rows, and decreasing totals between low BIC values (Schwarz 1978). The variables within this
paired rows and columns. The value range of NODF is 0–100, model were then included in a regression (Schwarz 1978).
where 100 is a completely nested system. Most observed A normality test (Shapiro-Wilk’s test, Shapiro & Wilk 1965)
matrices are known to have a degree of nestedness between was performed, after which a regression commonality analysis
40 and 70 (Almeida-Neto et al. 2008). Observed nestedness (RCA) was used to identify each variable’s unique (the
values were then compared with expected nestedness values amount of variance accounted for by a single variable) and
obtained from Er (the occurrence of a connection is attributed common variance (the amount of variance attributed to a
to a random cell in the matrix) and Ce (the varied placement set of variables). One key aspect of RCA is its ability to
of a connection in a cell based on the relationship between the also identify specific suppressor variables (Ray-Mukherjee
number of ones, denoting the presence of a species, in a et al. 2014). Suppressor variables are variables that suppress
particular row and column in the observed matrix) models irrelevant variance (variance not shared with the dependent
(Jędrzejewska-Szmek & Zych 2013). variable) and improve the predictive capabilities of other
key variables (Ray-Mukherjee et al. 2014).
Environmental variables
Univariate and multivariate analyses of environmental factor Results
effects were performed in Primer v.6 (Clarke & Gorley 2006).
Based on the presence and absence of species, a Bray-Curtis
Species richness and frequency
resemblance matrix (dataset standardised) was generated, A total of 192 native forb plant species was recorded across
and cluster and multi-dimensional scaling (MDS) analyses the seven sites. At a plot scale, forb species richness ranged
were performed in PRIMER. A principle component analysis from 14–52. Mean plot richness across all sites was 23.5 (± 2.4,
(PCA) was performed on the continuous environmental 95% confidence interval (CI)). At a site scale, Vernon Crookes
variables, to identify the key variables contributing most to had the highest total forb species richness with 84 species,
the variability in the species composition dataset (Ringner and Sherwood the lowest with 33 species (Table 1).
2008). PC1 contributed 64.1% and PC2 24.0% to the observed
variation. Variables that displayed eigenvalues (an indicator For the most part, plots within the same site clustered
of significance of the corresponding component) >0.4 together in terms of forb community assemblages (Figure 2).
(the value at which a break was observed in the scree The exceptions to this were in Giba East, where two plots
plot) were selected from PC1 and PC2 for further analysis clustered separately from the other four, in New Germany
(Johnstone 2001). The relationship between the distances where two sets of three plots clustered separately, and in
between sites and site species composition similarity was Stainbank where two plots clustered separately from the
investigated using the RELATE function within PRIMER other three. Interestingly, four Giba East and three New
(Clarke 1993). RELATE examines the correlation between Germany plots clustered together as a separate group, and
the distance dataset and the species composition Bray- the other two Giba East and three New Germany plots
Curtis similarity index, and provides a coefficient and clustered together as a group with Vernon Crookes (Figure 2a
significance value as an output (Clarke & Gorley 2006). and 2b). The Stainbank plots clustered either with Silverglen
or Sherwood. The similarity amongst plots from different
The determination of significant difference between variability sites was relatively low (Page 6 of 10 Original Research
0 a
5
10
15
20
25
30
35
40
% Similarity
45
50
55
60
65
70
75
80
85
90
95
100
Giba East
Giba East
Giba East
Giba East
New Germany
New Germany
New Germany
Giba East
Giba East
New Germany
New Germany
New Germany
Vemon Crookes
Vemon Crookes
Sherwood
Sherwood
Sherwood
Sherwood
Silverglen
Silverglen
Silverglen
Silverglen
Silverglen
Silverglen
Silverglen
Vemon Crookes
Stainbank
Stainbank
Vemon Crookes
Stainbank
Stainbank
Stainbank
Treasure Beach
Treasure Beach
Treasure Beach
Treasure Beach
Samples
Reserve b
11 2D Strees: 0.2 New Germany
Sherwood
Treasure Beach
Giba East
Stainbank
9 Silverglen
14 Vernon Crookes
1
13 10 Similarity
12 20
40
8 7
2 17
5
23
4 20
6 18
25
19
24 21 3
31
15
22 29 36
32
28 30 16
26 35
27 33
34
FIGURE 2: (a) Cluster dendogram and (b) MDS plot of the similarity of plots within sites illustrating that the majority of plots clustered with those within the same site.
plots located on different slope aspects. This observation important drivers in observed forb species composition
reinforces the findings of the analysis of similarities variation.
(ANOSIM) and best subset of environmental variables with
maximum correlation with community dissimilarities Frequency data for plots within each site showed a consistent
(BIOENV) analyses, which indicated aspect and elevation as inverse proportional or hollow curve profile (Figure 3) which
http://www.abcjournal.org Open AccessPage 7 of 10 Original Research
indicates that the majority of forb species present within a turnover, or changes in forb species compositions across
site have average to low frequencies of occurrence, with a sites, is a more important factor in driving beta diversity
limited number of very common species (McGill et al. 2007). amongst these grasslands than species richness differences
The species recorded as common varied between sites. across sites.
Frequency of occurrence of forb species within the local
landscape varied amongst sites (Figure 3), with those which The NODF value of the nestedness of plots was 27.90, which
have been under protection for longer (Table 1) displaying a indicates a medium-to-low level of plot nestedness. Observed
gentler slope with longer tails, suggesting a greater number nestedness was, however, not randomly distributed and the
of rare forb species (lower in frequency) and fewer high null model nestedness value of 19.36 was significantly lower
frequency species. The slopes for Giba East and Sherwood than the expected nestedness (p < 0.05 for both the Er and
were comparatively steeper with shorter tails, indicating a Ce models). The observed nestedness of the pooled site
comparative lack of rare forb species and dominance of a few, species compositions can therefore be attributed to ecological
processes. The NODF value of the nestedness of plots was
common species (although with only three shared species in
40.34, indicating a higher level of nestedness amongst the
the top ten most common species in each site).
sites. This value was statistically significant for the Er model
(p < 0.05), but not significant for the Ce model (p = 0.34),
The majority of forb species were categorised as either
suggesting that the nestedness may be randomly derived
‘restricted in regional distribution’ or ‘restricted in local
(Jędrzejewska-Szmek & Zych 2013).
distribution’ (39 species) or as ‘very restricted in regional
distribution and restricted in local distribution’ (63 species).
Only two species, Tephrosia macropoda (E. Mey.) Harv. var.
Drivers of species composition and species
richness
macropoda (Fabaceae) and Senecio glaberrimus DC. (Asteraceae),
were widespread at both the regional and local scale. Eight Three principle components contributed 92.6% of the forb
species were considered locally common but restricted in species’ composition variability (PC1 = 57.0%, PC2 = 24.3%,
their regional distribution. PC3 = 11.3%). All environmental variables were included
within these three components, and all had eigenvalues
higher than 0.4 (threshold for consideration as an important
Beta diversity contributor) in at least one principle component (Ringner
The means of all three forb beta diversity index values were 2008). Hence, all the continuous environmental variables
significantly higher amongst sites than within sites (Table 2). were used for further analysis.
B-3 had a significantly larger mean rank and sum of ranks
than Brich (654 and 41 1821, compared with 607 and 382 609 Forb species composition differed significantly with altitude,
respectively; Mann-Whitney U-test: p < 0.05), i.e., B-3 was a mean temperature, mean rainfall, temperature seasonality,
larger contributor to Bcc. This suggests that forb species rainfall seasonality, reserve size, contiguous grassland
1.0 New Germany a 1.0 Stainbank b
Giba East Silverglen
Proporonal frequencies
Proporonal frequencies
0.9
0.8 0.8
0.7
0.6 0.6
0.5
0.4 0.4
0.3
0.2 0.2
0.1
0.0 0.0
0 10 20 30 40 50 60 70 0 10 20 30 40 50 60 70
Species frequency rank Species frequency rank
1.0 Vernon Crookes c 1.0 Sherwood d
0.9 Treasure Beach
Proporonal frequencies
Proporonal frequencies
0.8 0.8
0.7
0.6 0.6
0.5
0.4 0.4
0.3
0.2 0.2
0.1
0.0 0.0
0 10 20 30 40 50 60 70 0 10 20 30 40 50 60 70
Species frequency rank Species frequency rank
FIGURE 3: Proportional frequency rank curves illustrating the different profiles of ranked species proportional frequency for each of the sites sampled. The Vernon Crookes
profile is considered the closest to a pristine state. Sherwood and Giba East have a higher proportion of common species with high frequencies. Axis ranges are consistent
to allow ease of comparison.
http://www.abcjournal.org Open AccessPage 8 of 10 Original Research TABLE 2: Assessment of beta diversity across and within sites. Kruskal-Wallis H-test significance values for within site versus between site Bcc (overall beta diversity), B-3 (replacement of species between sites), and Brich (difference in species richness between sites) value comparisons. Index Comparison Mean (std error) Range p Bcc Between 0.874 (±0.0024) 0.594–1.000
Page 9 of 10 Original Research
TABLE 4: An indication of the different contributions of key variables, selected by the Bayesian information criterion, to the variation in species richness across plots.
Variable β† UC‡ CC§ TC¶
Grassland size*** -4.136 0.1730 -0.1626 0.0104
Distance to medicinal market*** 7.338 0.5445 -0.3478 0.1967
Boundary length-area ratio** 2.795 0.0790 -0.0119 0.0671
Temperature Seasonality* -1.862 0.0351 -0.0261 0.0090
Rainfall seasonality*** -5.270 0.2809 -0.2497 0.0312
Significance codes: 0 < ***; 0.001 < **; 0.05 < *.
†, beta coefficient (β) – an indication of the importance of a particular variable.
‡, unique coefficient (UC) – how much variance is unique to an observed variable.
§, common coefficient (CC) – how much variance is common in groups of variables.
¶, total coefficient (TC) – sum of the unique and common effects, giving total variance.
The species frequency curves, however, suggest that these cannot be solely relied on, and urban and peri-urban
grassland systems are not entirely unaffected by urbanisation- systematic conservation plans will need to be developed
associated impacts. The observed higher number of dominant with a focus on finer-scale, local-level variances in ecosystem
species, and the relatively higher frequencies of those types (Knight et al. 2006). Urban and peri-urban systematic
dominant species in Giba East and Sherwood (both subjected conservation plans should consider variables such as
to sporadic management or periods of no management), may aspect, altitude, and climate as potential indicators of fine-
be an outcome of modified disturbance and patch size scale variation in ecosystem types (Crous et al. 2013). These
patterns resulting in the diminishing competitiveness of fine-scale variations will, in turn, provide a more robust
certain species, as well as the entire exclusion of other species basis for development decisions (Crous et al. 2013). Without
from the grassland (as shown by the significant influence of these efforts, urban biodiversity hotspots are likely to
disturbance and size factors on total species richness; suffer continued degradation and associated species losses
O’Conner & Hurt, 2009). These patterns are consistent with (Malcolm et al. 2005).
observations made in other grassland disturbance response
studies (Menge & Sutherland 1987; Pooley et al. 2005; Acknowledgements
Zaloumis & Bond 2011). This research is supported by eThekwini Municipality
through the Durban Research Action Partnership: KwaZulu-
Reserve managers should therefore strive to create an Natal Sandstone Sourveld Programme, together with the
environment where natural disturbance is maintained at South African Research Chairs Initiative of the Department
historical levels, and anthropogenic disturbance is excluded of Science and Technology and the National Research
as far as possible, to ensure maintenance and improvement Foundation of South Africa (grant no. 84157).
of species diversity within these grasslands (Connell 1978;
Roberts & Gilliam 1995; Tilman & Lehman 2001). The size of
a contiguous grassland patch, its distance to the traditional
Competing interest
medicine market, and the shape of the grassland patch, were The authors declare that they have no financial or personal
the biggest drivers of species richness variation. Special relationships which may have inappropriately influenced
management attention should therefore be given to (1) the them in writing this article.
maintenance and expansion of grassland patch size, and the
reduction of perimeter-to-area ratios by controlling bush Authors’ contributions
encroachment and restoring appropriate adjacent areas to
L.G. was the principal author, conceptualised key aspects of
grassland; and (2) managing public access to and activities
the paper, and undertook field work, data analysis, discussion
within grassland sites (O’Conner 2005; O’Conner & Hurt formulation, and the write-up. R.S. undertook the discussion
2009; Scott-Shaw & Morris 2014; Zaloumis & Bond 2011). formulation, conceptual thinking around the paper focus,
Considering the limitations of plant seed dispersal, and participated in the transcript review. J.M. undertook
reintroduction of key species, based on local ecological data analysis and participated in the transcript review.
requirements, would assist in species richness improvement
(Soons & Heil 2002; Soons et al. 2005).
References
The outcomes of the present study highlight the often Almeida-Neto, M., Guimaraes, P., Guimaraes, P., Loyola, R. & Ulrich, W., 2008,
‘A consistent metric for nestedness analysis in ecological systems: Reconciling
underappreciated importance of conservation efforts in concept and measurement’, Oikos 117(8), 1227–1239. http://dx.doi.org/10.1111/
j.0030-1299.2008.16644.x
urban and peri-urban landscapes. Considering that global
Boakye, M., Little, I., Panagos, M. & Jansen, R., 2013, ‘Effects of burning and grazing
biodiversity hotspots often have above average population on plant species percentage cover and habitat condition in the Highland Grassland
of Mpumalanga Province, South Africa’, The Journal of Animal & Plant Sciences
densities, urban and peri-urban conservation, through 23(2), 603–610.
protection of relatively small (when compared with Carvalho, J., Cardoso, P. & Gomes, P., 2012, ‘Determining the relative roles of species
traditional ‘game reserves’ such as Kruger National Park and replacement and species richness differences in generating beta-diversity
patterns’, Global Ecology and Biogeography 21(7), 760–771. http://dx.doi.org/
Hluhluwe Imfolozi Park) high biodiversity areas cannot be 10.1111/j.1466-8238.2011.00694.x
ignored in the pursuit of global conservation goals (Miller & Clarke, K., 1993, ‘Non-parametric multivariate analyses of changes in community
structure’, Australian Journal of Ecology 18, 117–143. http://dx.doi.org/10.1111/
Hobbs 2002). Broad-scale systematic conservation plans j.1442-9993.1993.tb00438.x
http://www.abcjournal.org Open AccessPage 10 of 10 Original Research
Clarke, K. & Gorley, R., 2006, PRIMER v6: User Manual/Tutorial. PRIMER-E, Plymouth. Miller, J. & Hobbs, R., 2002, ‘Conservation where people live and work’, Conservation
Biology 16(2), 3300–3337. http://dx.doi.org/10.1046/j.1523-1739.2002.00420.x
Colwell, R., 2013, EstimateS: Statistical estimation of species richness and shared
species from samples, Version 9, viewed 5 June 2014, from Purl.oclc.org/ O’Conner, T., 2005, ‘Influence of land use on plant community composition and
estimates. diversity in Highland Sourveld grassland in the southern Drakensberg, South
Africa’, Journal of Applied Ecology 42, 975–988. http://dx.doi.org/10.1111/j.1365-
Connell, J.H., 1978, ‘Diversity in tropical rain forests and coral reefs’, Science 2664.2005.01065.x
199(4335), 1302–1310. http://dx.doi.org/10.1126/science.199.4335.1302
O’Conner, T. & Hurt, C., 2009, ‘Medium-term changes in grass composition and
Coppolillo, P., Gomez, H., Maisels, F. & Wallace, R., 2004, ‘Selection criteria for suites diversity of Highland Sourveld grassland in the southern Drakensberg in response
of landscape species as a basis for site-based conservation’, Biological to fire and grazing management’, African Journal of Range & Forage Science 20(1),
Conservation 115, 419–430. http://dx.doi.org/10.1016/S0006-3207(03)00159-9 1–10.
Crous, C., Samways, M. & Pryke, J., 2013, ‘Exploring the mesofilter as a novel Pausas, J. & Austin, M., 2001, ‘Patterns of plant species richness in relation to different
operational scale in conservation planning’, Journal of Applied Ecology 50, environments: An appraisal’, Journal of Vegetation Science 12, 153–166. http://
205–214. http://dx.doi.org/10.1111/1365-2664.12012 dx.doi.org/10.2307/3236601
Dingaan, M. & Du Preez, P., 2013, ‘Grassland communities of urban open spaces
in Bloemfontein, Free State, South Africa’, Koedoe 55(1), 1–8. http://dx.doi. Pressey, R.L., Cowling, R.M. & Rouget, M., 2003, ‘Formulating conservation targets for
org/10.4102/koedoe.v55i1.1075 biodiversity pattern and process in the Cape Floristic Region, South Africa’,
Biological Conservation 112(1–2), 99–127. http://dx.doi.org/10.1016/S0006-
Eeley, H., Lawes, M. & Piper, S., 1999, ‘The influence of climate change on the 3207(02)00424-X
distribution of indigenous forest in KwaZulu-Natal, South Africa’, Journal of
Biogeography 26, 595–617. http://dx.doi.org/10.1046/j.1365-2699.1999.00307.x Pooley, E., 2005, ‘A field guide to wildflowers: KwaZulu-Natal and the eastern region’,
Natal Flora Publications Trust c/o Natal Herbarium, Durban.
Framework Planning, 2013, Spatial development framework report 2013/14,
eThekwini Municipality, Durban. Ray-Mukherjee, J., Nimon, K., Mukherjee, S., Morris, D., Slotow, R. & Hamer, M., 2014,
‘Using commonality analysis in multiple regressions: A tool to decompose
Gabriel, D., Roschewitz, I., Tscharntke, T. & Thies, C., 2006, ‘Beta diversity at different regression effects in the face of multicollinearity’, Methods in Ecology and
spatial scales: Plant communities in organic and conventional agriculture’, Evolution 5(4), 320–328. http://dx.doi.org/10.1111/2041-210X.12166
Ecological Applications 16(5), 2011–2021. http://dx.doi.org/10.1890/1051-
0761(2006)016[2011:BDADSS]2.0.CO;2 Ringner, M., 2008, ‘What is principle component analysis?’ Nature Biotechnology 26,
303–304. http://dx.doi.org/10.1038/nbt0308-303
Gonzalez-Megias, A., Gomez, J. & Sanchez-Pinero, F., 2007, ‘Diversity-habitat
heterogeneity relationship at different spatial and temporal scales’, Ecography 30, Roberts, M., & Gilliam, F., 1995, Patterns and mechanisms of plant diversity in forested
31–41. http://dx.doi.org/10.1111/j.0906-7590.2007.04867.x ecosystems: Implications for forest management. Ecological Applications 5, 969-977.
Guimarães, P.R. & Guimarães, P., 2006, ‘Improving the analyses of nestedness for large Rutherford, M.C., Mucina, L., Lotter, M.C., Bredenkamp, G.J., Smit, J.H.L., Scott-Shaw,
sets of matrices’, Environmental Modelling and Software 21, 1512–1513. http:// R. et al., 2006, ‘Savanna Biome’, in L. Mucina & M.C. Rutherford (eds.), The
dx.doi.org/10.1016/j.envsoft.2006.04.002 Vegetation of South Africa, Lesotho and Swaziland, Strelitzia 19, pp. 510–511,
South African National Biodiversity Institute, Pretoria.
Gutt, J. & Piepenburg, D., 2003, ‘Scale-dependent impact on diversity of Antarctic
benthos caused by grounding of icebergs’, Marine Ecology Progress Series 253, Schneider, R., Hauer, G., Farr, D., Adamowicz, W. & Boutin, S., 2011, ‘Achieving
77–83. http://dx.doi.org/10.3354/meps253077 conservation when opportunity costs are high: Optimizing reserve design in
Alberta’s oil sands region’, PLoS One 6(8), e23254. http://dx.doi.org/10.1371/
Hanski, I., 1994, ‘Patch-occupancy dynamics in fragmented landscapes’, Trends in journal.pone.0023254
Ecology and Evolution 9(4), 131–135. http://dx.doi.org/10.1016/0169-5347(94)
90177-5 Schwarz, G., 1978, ‘Estimating the dimension of a model’, Annals of Statistics 6(2),
461–464. http://dx.doi.org/10.1214/aos/1176344136
Heywood, V. & Iriondo, J., 2003, ‘Plant conservation: Old problems, new perspectives’,
Biological Conservation 113, 321–335. http://dx.doi.org/10.1016/S0006-3207(03) Scott-Shaw, R. & Styles, D., 2012, ‘The florisitics and conservation status of Sandy
00121-6 Coastal Belt Grassland’, Plantlife 41 & 42, 28–39.
Hijmans, R.J., Cameron, S.E., Parra, J.L., Jones P.G. & Jarvis A., 2005, ‘Very high Seibold, D. & Mcphee, R., 1979, ‘Commonality analysis: A method for decomposing
resolution interpolated climate surfaces for global land areas’, International explained variance in multiple regression analyses’, Human Communication
Journal of Climatology 25, 1965–1978. http://dx.doi.org/10.1002/joc.1276 Research 5(4), 355–365. http://dx.doi.org/10.1111/j.1468-2958.1979.tb00649.x
Honnay, B. & Hermy, M., 2004, ‘Scale-dependent frequency distributions of plant Shankaran, M., 2009, ‘Diversity patterns in savanna grassland communities:
species in dune slacks: Dispersal and niche limitation’, Journal of Vegetation Implications for conservation strategies in a biodiversity hotspot’, Biodiversity
Science 15, 321–328. Conservation 18, 1099–1115. http://dx.doi.org/10.1007/s10531-008-9519-9
Huston, M.A., 1999, ‘Local processes and regional patterns: Appropriate scales for Shapiro, S. & Wilk, M., 1965, ‘An analysis of variance test for normality (complete samples)’,
understanding variation in the diversity of plants and animals’, Oikos 86, 393–401. Biometrika 52(3–4), 591–611. http://dx.doi.org/10.1093/biomet/52.3-4.591
http://dx.doi.org/10.2307/3546645 Smith, R., Goodman, P. & Matthews, W.S., 2006, ‘Systematic conservation planning: A
IBM Corp. Released 2011. IBM SPSS Statistics for Windows, Version 20.0. Armonk, review of perceived limitations and an illustration of the benefits, using a case
NY: IBM Corp. study from Maputaland, South Africa’, Oryx 40(4), 400–410. http://dx.doi.
org/10.1017/S0030605306001232
Jędrzejewska-Szmek, K. & Zych, M., 2013, ‘Flower-visitor and pollen transport
networks in a large city: Structure and properties’, Arthropod-Plant Interactions Snyman, H., 2006, ‘Estimating grassland production loss due to fire for a semi-arid
7(5), 503–516. http://dx.doi.org/10.1007/s11829-013-9274-z climate’, South African Journal of Animal Science 36(5), 38–41.
Jeppe, B., 1975, Natal wild flowers, Prunell (S.A.) (PTY) Ltd., Cape Town, South Africa Soons, M. & Heil, G., 2002, ‘Reduced colonisation capacity in fragmented populations
of wind-dispersed grassland forbs’, Journal of Ecology 90, 1033–1043. http://dx.
Johnstone, I., 2001, ‘On the distribution of the largest eigenvalue in principle doi.org/10.1046/j.1365-2745.2002.00729.x
components analysis’, The Annals of Statistics 29(2), 295–327. http://dx.doi.
org/10.1214/aos/1009210544 Soons, M., Messelink, J., Jongejans, E. & Heil, G., 2005, ‘Habitat fragmentation reduces
grassland connecitivity for both short-distance and long-distance wind-dispersed
Knight, R., Crowe, T. & Siegfried, W., 1982, ‘Distribution and species richness of trees forbs’, Journal of Ecology 93, 1214–1225. http://dx.doi.org/10.1111/j.1365-2745.
in southern Africa’, Journal of Southern African Botany 48, 455–480. 2005.01064.x
Knight, A., Driver, A., Cowling, R., Maze, K., Desmet, P., Lombard, A. et al., 2006, Steenkamp Y, Van Wyk B, Victor J, Hoare D, Smith G, Dold T. et al., 2004, ‘Maputaland-
‘Designing systematic conservation assessments that promote effective Pondoland-Albany’, in R.A. Mittermeier, P. Robles-Gil, M. Hoffman, J.D. Pilgrim,
implementation: Best practice from South Africa’, Conservation Biology 20(3), T. Brooks et al., (eds.), Hotspots revisited: Earth’s biologically richest and most
739–750. http://dx.doi.org/10.1111/j.1523-1739.2006.00452.x endangered ecoregions, pp. 219–228, Cemex, Mexico City.
Laliberté, E., Paquette, A., Legendre, P. & Bouchard, A., 2009, ‘Assessing the scale- Tilman, D. & Lehman, C., 2001, ‘Human-caused environmental change: Impacts on
specific importance of niches and other spatial processes on beta diversity: a case plant diversity and evolution’, Proceedings of National Academy of Sciences of
study from a temperate forest’, Oecologia 159, 377–388. http://dx.doi.org/ United States of America 98(1), 5433–5440. http://dx.doi.org/10.1073/pnas.
10.1007/s00442-008-1214-8 091093198
Malcolm, J., Liu, C., Neilson, R., Hansen, L. & Hannah, L., 2005, ‘Global warming and Uys, C., Hamer, M. & Slotow, R., 2009, ‘Turnover in flightless invertebrate species
extinctions of endemic species from biodiversity hotspots’, Conservation Biology composition over different spatial scales in Afrotemperate forest in the
20(2), 538–548. http://dx.doi.org/10.1111/j.1523-1739.2006.00364.x Drakensberg, South Africa’, African Journal of Ecology 47, 341–351. http://dx.doi.
Margules, C.R. & Pressey, R.L., 2000, ‘Systematic conservation planning’, Nature 405, org/10.1111/j.1365-2028.2008.00968.x
243–253. http://dx.doi.org/10.1038/35012251 Uys, R., Bond, W. & Everson, T., 2004, ‘The effect of different fire regimes on plant
Maurer, K., Durka, W. & Stocklin, J., 2003, ‘Frequency of plant species in remnants of diversity in southern African grasslands’, Biological Conservation 118, 489–499.
calcareous grassland and their dispersal and persistence characterisitics’, Basic http://dx.doi.org/10.1016/j.biocon.2003.09.024
Applied Ecology 4, 307–316. http://dx.doi.org/10.1078/1439-1791-00162
Van Wilgen, B., Govender, N., Smit, I. & MacFadyen, S., 2014, ‘The ongoing
McGill, B.J., Etienne, R.S., Gray, J.S., Alonso, D., Anderson, M.J., Benecha, H.K. et al., development of a pragmatic and adaptive fire management policy in a large
2007, ‘Species abundance distributions: Moving beyond single prediction theories African savanna protected area’, Journal of Environmental Management 132,
to integration within an ecological framework’, Ecology letters 10(10), 995–1015. 358–368. http://dx.doi.org/10.1016/j.jenvman.2013.11.003
http://dx.doi.org/10.1111/j.1461-0248.2007.01094.x
Willott, S., 2001, ‘Species accumulation curves and the measure of sampling effort’,
Mclean, C., Ground, L. & Boon, R., 2014, eThekwini Municipality systematic Journal of Applied Ecology 38, 484–486. http://dx.doi.org/10.1046/j.1365-2664.
conservation plan, Unpublished raw data. 2001.00589.x
Menge, B., & Sutherland, J., 1987, Community regulation: variation in disturbance, Zaloumis, N. & Bond, W., 2011, ‘Grassland restoration after afforestation: No direction
competition, and predation in relation to environmental stress and recruitment. home?’ Austral Ecology 36, 357–366. http://dx.doi.org/10.1111/j.1442-9993.
American Naturalist 1, 730–757. 2010.02158.x
http://www.abcjournal.org Open AccessYou can also read