Optimal method of Arctic hydrocarbons production- and-supply system implementation - E3S Web ...
←
→
Page content transcription
If your browser does not render page correctly, please read the page content below
E3S Web of Conferences 266, 01008 (2021)                                 https://doi.org/10.1051/e3sconf/202126601008
TOPICAL ISSUES 2021

      Optimal method of Arctic hydrocarbons production-
      and-supply system implementation
      D.S. Bratskikh, A.M. Schipachev, V.A. Bukov.
      Saint Petersburg Mining University, Department of Transportation and storage oil and gas, St
      Petersburg, Russia

                    Abstract. One of the most important issues in the development of the
                    Arctic shelf is the rationality of transportation. Selection of the optimal
                    method is an integral part of the project, in the framework of which this
                    article is written. Earlier all possible methods and their advantages and
                    disadvantages were evaluated. Within the framework of this article, t
                    optimal method for the development of reserves on the Arctic shelf will be
                    proposed, taking into account the possibilities of development and the
                    effectiveness of subsequent transportation to the importing countries. The
                    risks of gas hydrates were considered. The prospects of development of the
                    Northern Sea Route between Russia and Asian countries are assessed; the
                    cost of transportation of liquefied natural gas and compressed natural gas
                    from the Barents Sea to Central Europe is compared. The hydraulic
                    calculation of the selected section of the gas pipeline network is conducted.
                    The economic calculation of the project as a whole is accomplished. The
                    optimal location of the route in relation to the reserves in the Barents Sea
                    has been chosen. Pressure losses in the selected zone were no more than
                    12.24 MPa with pipeline pressure from 8 to 16 MPa. In this case,
                    condensation and subsequent formation of gas hydrates are not possible.
                    Using only three sections of the network, the profit of the project will be
                    223 billion rubles per year. In accordance with this the best way of
                    hydrocarbons realization in the Arctic is a combined method of
                    transportation with modern methods of extraction and pipelaying laying.

      1 Introduction
      One of the main tasks for our country is the development of the Arctic shelf. The basis of
      the Russia’s economy is the production and export of hydrocarbons. Russia’s main oil and
      gas are located in Siberia and on the Arctic shelf. Most of the gas is concentrated in the
      Barents Sea (about 49%) in small and medium-sized fields [1]. Currently, there are 4
      platforms on the Arctic shelf of Russia, the profitability of the projects of which is a big
      problem. Identification and assessment of the challenges of Arctic development is no less
      important among the economic and technological issues of of existing projects to complete
      and optimally address them n. The global goal of this research work is to identify possible
      ways to develop deposits on the Russian Arctic shelf, choose the optimal method of of
      development and subsequent transportation of the extracted hydrocarbons. To estimate

© The Authors, published by EDP Sciences. This is an open access article distributed under the terms of the Creative Commons
Attribution License 4.0 (http://creativecommons.org/licenses/by/4.0/).
E3S Web of Conferences 266, 01008 (2021)                        https://doi.org/10.1051/e3sconf/202126601008
TOPICAL ISSUES 2021

      recoverable reserves and highlight existing problems and possible solutions, we conducted
      hydraulic and economic calculations to justify the selected method of transportation.
      Depending on various factors, the transportation solution becomes significant, and its cost
      can reach billions of dollars.
           Within the next decades, it will hardly make sense for Russia to switch to other types of
      power production , be it based on hydrogen or renewable energy sources since the country
      still has huge reserves of gas in the Arctic. As Litvinenko V.S. said at the conference: «It is
      necessary to find a way to economically realize the gas concentrated there» [2]. This global
      challenge needs to be broken down into subtasks, and this article raises the question of how
      best to transport and market the gas.
           The purposel of this article is to choose the best way to sell reserves of the Arctic shelf,
      taking into account the possibilities of development and efficiency of subsequent
      transportation to the importing countries with an assessment of the risks of field
      development and economic and technological efficiency.
           Based on the relevance and purpose of the work, we can identify the following
      objectives of this work:
           1) Assess the risks and difficulties of field development on the Arctic shelf
           2) Estimate the reserves of raw materials in the area and the demand for them
           3) Choose the best way to sell and transport hydrocarbons
           4) Evaluate the economic and technological aspects of the feasibility of the project
           5) Conduct appropriate technological calculations for the selected method of
      transportation
           6) Highlight the prospects for the development of the project
           7) Emphasize the economic value of the project.
           Currently, there are several problems associated with the development of the Arctic.
      The main ones are industrial safety and labor protection. The Arctic region has a number of
      specific climatic features. Oil and gas companies have not encountered such conditions
      before, therefore there is no normative document on labor protection, which would regulate
      the activities of workers. Currently, there are no methods to control and eliminate hazards
      associated with these features. Low temperatures and glaciers are the most common.
      Generally, lower temperatures result in very high risks, and icebergs result in critical risks.
      Transportation workers and drillers are at greatest risk. The greatest risk to the transport
      state is from waves up to 10 m high and glaciers, and to the drillers from high reservoir
      pressure [3].
           One of the most cost-effective solutions in offshore development is to use the concept
      of ensuring a constant flow rate. Pipeline transport is statistically necessary, but there are no
      problems with it. This discussion disputes the nature of flow, pressure, and temperature
      distribution in various cases of hydrocarbon transportation. Due to the special
      environmental conditions in Arctic regions such as the Barents Sea, it is important to
      consider the risk of hydrate formation along the pipeline. To ensure reliable service life and
      safe operation when transporting multiphase flow, it is important to predict possible flow
      problems, such as hydrate formation, and to prepare a flow strategy and possible risk
      mitigation actions actions.
           The amount of reserves in this region is amazing. The prospective and forecast
      hydrocarbon reserves of the Russian continental shelf amount to 98.7 billion tons of oil
      equivalent. At the same time, about 70% of reserves are accumulated in the shelf zones of
      the Kara Sea and the Barents Sea (including the Pechora Sea) (Figure 1). The share of oil
      and condensate in the total volume of resources does not exceed 10%. The structure of
      hydrocarbon resource potential is dominated by promising resources (about 90%), which

                                                     2
E3S Web of Conferences 266, 01008 (2021) https://doi.org/10.1051/e3sconf/202126601008
TOPICAL ISSUES 2021
are very unevenly distributed on the shelves of certain seas. 84% of the known reserves of
the entire Russian shelf are concentrated in the Barents and Kara Seas. 95% of the gas
reserves of entire Russian shelf are concentrated on the neighboring shelf. On the shelf
from the Barents and Kara Seas, the two largest oil and gas basins with a total area of 2
million square meters with potential resources of at least 50-60 billion tons of fuel
equivalent and 10 fields were discovered and tested by drilling (Table 1).
Table 1. Initial geological gas reserves of the largest fields [25]
_______________________________________________________
Field Gas reserves
_______________________________________________________
Murmansk 120 billion m 3
Ludlovskoe 211,6 billion m3
Ledovoe 320 billion m3
Rusanovskoe 780 billion m3
Leningrad 3.0billion m3
Harasavey 1.9 billion m3
Kruzenshtern 965 billion m3
Kamennomyssk Sea 534.7 billion m3
Yurkharovskoe 460 billion m3
Antipayutinskoe 320 billion m3
________________________________________________________
Fig. 1. Russian Barents and Kara Sea.
Figure 1 shows that most of the deposits with different reserves are located within a
short distance from each other.
In the context of the realization of hydrocarbons, there are three major problems
associated with gas hydrates, so it is necessary to determine ways to overcome them.
The first problem is, undoubtedly, the formation of hydrates under the Arctic conditions
directly in the gas pipeline. The second problem is the development of fields with
3E3S Web of Conferences 266, 01008 (2021) https://doi.org/10.1051/e3sconf/202126601008
TOPICAL ISSUES 2021
extremely high reservoir pressure and, consequently, possible explosion. The third problem
is the method of hydrocarbons extraction and dehydration for the following transportation.
Gas hydrates play a key role in field development. Both their formation and their
evaporation can be a problem, depending on the context.
The problem of most deposits is the evaporation of gas hydrate interlayers at a depth of
10-15 meters, resulting in abnormally high pressure in the reservoir ly. Also, a large amount
of sedimentary rocks in the upper layers contribute to the threat of soil undermining in the
area of gas transportation. In the development of small and medium deposits this can be
both an advantage and a disadvantage. Saving energy for extraction lead to catastrophic
fracturing. A thorough preliminary assessment of the formation condition is necessary.
The use of electric heating technology together with partial oxidation of gas hydrates is
considered the best option. The main advantages of this method are its simplicity and
compactness. Many technologies have been proposed and are consistently used in the
development of gas hydrates deposits.
The main task in this method is the correctly position the wells around the gas hydrate
deposits. Then, it is necessary to use the technology of gas hydrate oxidation, which is due
to the fact that the radius of impact on the formation is up to 4 meters. This will
immediately make it possible to achieve a significant increase in gas production at the first
stage. Then, when the amount of extracted gas stabilizes, the technology of electric heating
of hydrates is introduced, which will significantly increase the radius of impact on the
reservoir and increase gas production. Later it will be possible introduce depressurization
technology, increase the production rate and increase gas recovery [4]. This method is one
of the simplest, since electrical energy can be easily regulated, and alsothe most
environmentally friendly, since electricity is harmless and does not harm nature, unlike
radiation waste.
An important parameter is the study of these resources, which require careful study to
be successful in operation. This formation of the resource is a result of the regression that
occurred at the end of the Miocene, during the formation of ice masses; the gas deposited in
the ancient ages in this area froze. The layer, permanently frozen, contributed to the
accumulation of this resource and became a reservoir in the late Pliocene. Today, tectonic
structures support a less dynamics. One of the conditions necessary for the crystallization of
gas is the low temperature (0 – 10°C) and high pressure (1 – 10 MPa), and high gas and
water content. The bottom of the oceans, mainly on continental slopes, shelves, and abyssal
plains, is 90% more favorable for hydrate formation due to adequate thermobaric
conditions. In natural waters, the mass of gas is not dispersed, but is almost completely
preserved and passes into the state of gas hydrate from about a depth of 100-250 meters in
the polar regions. Also, for a natural environment with negative temperatures, the pressure
range can be reduced. That is, at lower temperatures, the accumulation of gas hydrates is
more likely to occur closer to the surface than at higher temperatures, this is due to the
natural conditions of increasing pressure from the surface to the interior. These properties
are characteristic of much rt of the Arctic region, so it is very important to study them. On
the other hand, some gas hydrate deposits were found on water slopes in areas where these
conditions are absent. From calculations performed in promising water areas of Arctic
regions, the diagram shows the temperature range below 2˚C, and the corresponding
thermobaric conditions were drawn in the diagram [5].
The problem of transporting gas through the pipeline is the formation of gas hydrates
due to low temperatures. Depending on certain concentrations of gas components,
temperature, pressure, there is a transition from a single-phase liquefied flow to a two-phase
flow and further formation of gas hydrates. The lower the temperature of the gas, the lower
4E3S Web of Conferences 266, 01008 (2021) https://doi.org/10.1051/e3sconf/202126601008
TOPICAL ISSUES 2021
its viscosity and, therefore, the rate of transportation. In offshore unstable temperature
conditions, flow or other external influences on constant flow can significantly affect
performance. Systems and technologies for temperature control are needed to monitor the
transportation condition in real time [6].
Therefore, ensuring the reliable and safe transportation of hydrocarbons requires
special attention and control [7].
2 Methodology
2.1 Resource Development Method
Among the main options for transportation by sea, it is possible to distinguish the
transportation of natural gas both in compressed and in a liquefied state on special gas
carriers. However, if we consider the long-term prospects of the development of the largest
fields, the pipeline will be the most rational from the point of view of economy and
technical equipment.
For the full-scale development of the Arctic shelf, the ideal operation is a network of
gas pipelines for large and medium fields and gas carriers of compressed natural gas for
small deposits.
As optimization of the route for gas transportation, it is proposed to create a link
between large and medium-sized fields.
It is planned to create several key platforms equipped with primary gas treatment and
dehydration units and compressors of different capacities necessary for its transfer to the
next key platform [8].
Such platforms can be installed at the following fields: Ludovskoye, Shtokmanovskoye,
Murmanskoye, Ledovoye, and Severno-Kildinskoye. Moreover, some of the platforms not
only can maintain pressure for gas transportation but also serve as terminals for preparation
of compressed gas to be transportated on vessels in a compressed state.
Medium-sized fields will be connected to key gas pipelines. The development and
supply of gas at the required pressure to the key platform will be carried out directly under-
water using innovative underwater compressor stations and subsea development facilities.
The construction of offshore gas pipelines along the Arctic shelf and their subsequent
operation is assumed guided by the regulatory legal documentation [9].
An offshore gas pipeline network was created in accordance with the selected location
of key platforms and the most potentially profitable small and medium-sized fields.
After the depletion of key platform fields, additional medium and small fields can be
brought into production, which will have positive effect on the economic component of the
project.
The method of developing small and medium deposits - underwater drilling and
subsequent exploitation is already being implemented today, in practice, in Norway.
Although their conditions are different from ours, in a couple of years it will be possible to
implement in an appropriate way.
Another way of efficient production is to use mobile platforms, which can deliver gas to
specialized vessels in the form of liquefied natural gas and/or compressed natural gas [10].
However, the disadvantage of this technology is that most of the deposits of small sizes
have relatively short periods of experimental, while investments in transporting such a
platform are quite substantial. And this already is an economic challenge [11].
5E3S Web of Conferences 266, 01008 (2021) https://doi.org/10.1051/e3sconf/202126601008
TOPICAL ISSUES 2021
2.2 Input data for the calculation
Based on the data obtained, it was concluded that most of the fields have abnormally large
reservoir pressure. More than 100 wells have been drilled in the Barents Sea, which is
marked in pink on the map. On average, the reservoir pressure reaches 50 MPa (Figure 2),
and the coefficient of abnormal pressure is 1.4. The average depth of successful well
drilling was 3000 m [12].
Arctic gas has high water content. Following statistical data, average data were chosen for
hydraulic calculations (Table 2). High wellhead pressure and a large number of small and
medium-sized fields allow efficient use of subsea production, which provides economic
benefits due to the absence of huge platform construction costs.
Fig. 2. The Barents Sea region. Graphs of reservoir temperatures, pressures, and their anomaly
coefficients.
Table 2. Initial data for hydraulic calculations
____________________________________________________________________________________________
Track / Parameter L, km D, m ρ0,kg/m3P1*, MPa Current, m/h T1**, K T2***, K
_________________________________________________________________________________
Ludlovskoye – Ledovoe 66.3 1.42 0.67 8.00 0.1 276 191
Ledovoe – Shtokman 107.7 1.42 0.67 7.77 0.05 278 191
Shtokman – Murmansk 580 1.42 0.67 16.00 0.12 281 191
____________________________________________________________________________________________
Here
L – is the distance to the next platform;
D – is the diameter of pipeline;*P1 is the initial pressure;
**T1 – is the environmental temperature (Bratskikh et al. 2019.);
***T2 – is the critical temperature (Pcr=4,62MPa).
6E3S Web of Conferences 266, 01008 (2021) https://doi.org/10.1051/e3sconf/202126601008
TOPICAL ISSUES 2021
2.3 Method of the hydraulic calculations
Based on the selected route direction “Ludlovskoye - Ledovoe - Shtokman – Murmansk”
(Figure 4), the hydraulic calculation was carried out at 3 sections of the gas pipeline. These
sections were chosen due to their subsequent importance for the transportation of gas from
small and medium fields. The input data for the calculation were selected based on the
pumping performance of the existing Portovaya compressor station. Costs and diameters of
pipelines were calculated based on the thermo baric conditions of the region. The
calculations were carried out in accordance with STO Gazprom 2-3.5-051-2006 [13].
Pressure drop in the gas network can be found by the following formula:
2 2 (1)
Pi - Pj
q = 3,32 × 10 -6 × d 2.5
lDTav z av L
l – is the coefficient of hydraulic resistance of the gas pipeline section;
L – is the pipeline section length, km;
T – is the average temperature of the transported gas along the length of the gas
av
pipeline section, K;
Zav – is the average gas compressibility factor along the length of the gas pipeline;
D – is the relative density of gas to air;
Pi, Pj – is the absolute pressures at the beginning and end of the gas pipeline
section, respectively, MPa;
d – is the pipe inner diameter, mm;
K – is the equivalent pipe roughness.
The coefficient of hydraulic friction λ is determined depending on the mode of gas
flow mode in the pipeline, characterized by the Reynolds number:
(2)
where µ – is the dynamic viscosity of natural gases, Pa·s.
The hydraulic friction coefficient n λ is determined for rough walls at Re> 4000 by the
formula:
0, 2 (3)
æ 2 K 158 ö
l = 0,067ç + ÷
è d Re ø
The average coefficient of gas compressibility along the length of the gas pipeline should
be determined by the formulas:
2 (4)
zav = 1 + A1Ppr + A1Ppr
2,03 3,16 1,09 (5)
A1 = -0,39 + - 2 + 2
Tpr Tpr Tpr
0,1812 0,2124
A2 = 0,423 - +
Tpr Tpr2
Pav T (6)
Ppr = , Tpr = av
Pcr Tcr
Where Tcr, Pcr – critical values of pressure and temperature of the gas mixture.
7E3S Web of Conferences 266, 01008 (2021) https://doi.org/10.1051/e3sconf/202126601008
TOPICAL ISSUES 2021
2.4 Transportation of liquefied natural gas to Asian countries
To implement its interests in the Arctic region, Russia is developing a fleet of atomic
icebreakers, infrastructure for bunkering, including tankers for liquefied gas of the Arctic
class. The disadvantages of the Northern Sea Route (NSR) are the difficulty of passage in
the winter, lack of infrastructure, shortage of icebreakers, and administrative difficulties in
obtaining permits for passage. The remoteness of the fields from the mainland, the high
cost of organization and operation, special requirements for labor and the environmental
protection, as well as increasingly complex and technologically advanced wells are aspects
that must be taken into account.
The main environmental threat to the Arctic Ocean is pollution by spent fuel from
ships passing through the NSR. During the construction of gas wells, a technological
scheme of drilling waste processing by vulcanization with obtaining building material
should be introduced. Meanwhile, the only cost-effective way to develop small deposits is a
floating liquefied natural gas production unit. It can be relocated relatively easily and
cheaply to the next license site anywhere in the world. Offshore production can reduce
costs and minimize the political and environmental risks associated with the construction of
long subsea pipelines and onshore liquefied natural gas plants. It is also an important step
for the global energy industry at a time when the development of problematic deposits is
seen as the most reliable source of energy in the near future. The first projects to deliver
liquefied natural gas to China via the Northern Sea Route have already changed the
geopolitical situation in the world [14].
Today, cooperation between China and Russia in the gas industry is not limited to
gas that runs through the onshore pipeline. New fuel supply channels from Russia are now
being expanded. Therefore, now the North Sea Stream is one of the promising directions
for the development of intercontinental energy relations between Russia and China [15].
2.5 Piping
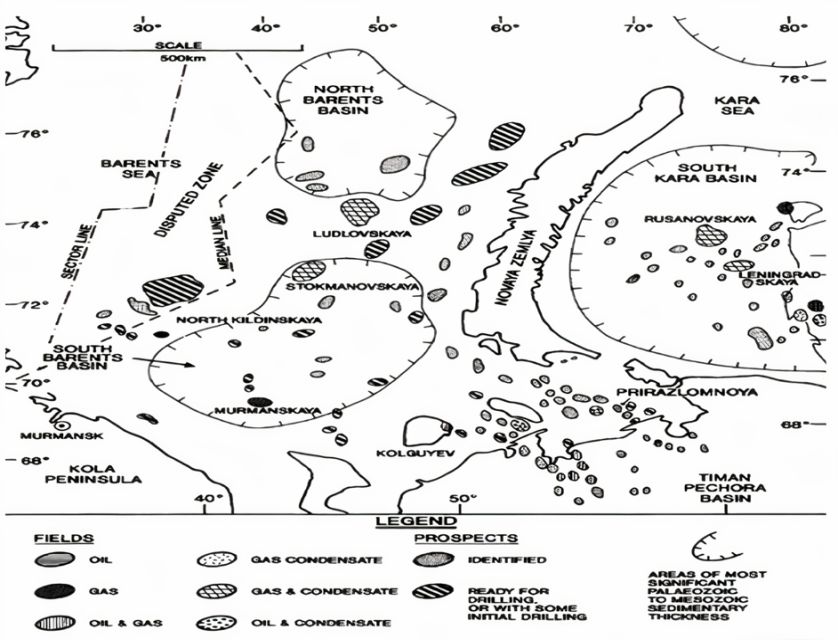
In Arctic and subarctic conditions, the most urgent problem is the construction and laying
of pipelines, since this method is the most profitable and expedient in the future. When
designing those, it is necessary to take into account a number of unique factors: ice
plowing, ice bed erosion, soil type, its shear strength, and environmental conditions, from
temperature to the condition of marine fauna. The risks of economic loss are too high due to
poorly understood necessary technical arrangement and optimal implementation of
technical equipment. Here, more than anywhere else, a set of engineering solutions is
important for many complex issues. There are many ways to lay offshore pipelines, but
given the unique construction conditions (mostly weather conditions), as well as the
experience of successfully implemented projects, the most optimal is the use of J- and S-
laying methods [15].
After analyzing the advantages and disadvantages of these methods, it can be can be
concluded that the J-method (Figure 3) is more optimal in terms of structural safety.
Compressive and tensile stresses play an essential role in selecting the desired method.
Considering the negative temperatures in the laying areas, special attention should be paid
to the choice of steel (optimal parameters of frost resistance, high resistance to brittle
fracture, reliability and compliance with the required service life). At the same time, it is
impossible to exclude the S-method. For example, in places where the pipeline reaches the
shore, it is much more convenient to use the latter method, since the reduction of the
8E3S Web of Conferences 266, 01008 (2021) https://doi.org/10.1051/e3sconf/202126601008
TOPICAL ISSUES 2021
working depth and simplification of control over the shore zone makes the application the
J-method inefficient in terms of costs [16].
Fig. 3 - EMA of pipeline laying by J-method.
2.6 Transportation of compressed / liquefied natural gas to Europe
One of the most promising areas of the Arctic continental shelf for the production of natural
gas is the territory of the Barents Sea with the Shtokmanovskoye, Ludlovsky and Ledovoye
fields. Central Europe is expected to become the main consumer [18, 29]. To decide on
choosing the most profitable technology for transporting natural gas from the Barents Sea
to Central Europe, it is necessary to compare the cost of transporting liquefied natural gas
and compressed natural gas. To do this, we need to perform the following tasks:
1) Compare the technology of transportation of liquefied natural gas and
compressed natural gas in Arctic conditions
2) Using the proposed methodology, calculate the required number of ships and
voyages for transportation of both types of gas to transport the same volume of natural gas
from the Barents Sea to the port of Rotterdam
3) Estimate the cost of fuel for the transportation of liquefied natural gas and
compressed natural gas.
As the research method to do this, the authors used comparative analysis of
existing projects and study of natural gas transportation technology for liquefied and
compressed natural gas [19, 23].
The whole data for economic calculation is presented in the paper The
construction of offshore gas pipeline systems in the Arctic zone [20, 24, 28] along with the
comparison of the cost for LNG and CNG transportation from Barents Sea to Central
Europe.
9E3S Web of Conferences 266, 01008 (2021) https://doi.org/10.1051/e3sconf/202126601008
TOPICAL ISSUES 2021
3 Results and discussion
3.1 Hydraulic calculation
One of the most significant and more reliable solutions to this problem is the creation of a
gas pipeline system connecting large and medium-sized fields. This solution provides for
ongoing gas supplies to Central Europe.
In selecting right pipeline network (Figure 4), large fields were taken as the basis since
more accurate data on the reservoir and topographic data on the possibility of their
exploitation are available for them. The map shows geological zones and structures that
have undergone seismic surveys, which are also a guarantee of subsequent potential
implementation, but for which there is currently no accurate information.
The Murmanskoye, Shtokmanovskoye, and Ludlovskoye fields were chosen as collection
points.
Compressor stations will be installed at assembly points as needed. In the event of
insufficient pressure and/or throughput in the pipeline, additional compressor stations will
have to be installed.
Fig. 4. Pipeline networks
3.2 Results of hydraulic calculation of pressure losses in the 3 selected
sections of the pipeline
The pressure drop in local resistances (elbows, tees, stop valves, etc.) can be compensated
by increasing the actual length of the gas pipeline by 5-10%. In general, after carrying out
calculations (Table 3), it has been established that in these conditions losses are not so
essential and are optimal for the given flow rate
10E3S Web of Conferences 266, 01008 (2021) https://doi.org/10.1051/e3sconf/202126601008
TOPICAL ISSUES 2021
Table 3. Results of hydraulic calculation
____________________________________________________________________________________________
Track / Parameter Q0•105, m3/h Re× 106 λ P1,MPa P2,MPa ∆P, MPa
_________________________________________________________________________________
Ludlovskoye – Ledovoe 0.40 1.09 0.03 8.00 7.77 0.23
Ledovoe – Shtokman 0.76 2.05 0.03 7.77 6.17 1.60
Shtokman – Murmansk 1.04 28.08 0.03 16.00 5.58 10.41
____________________________________________________________________________________________
The meanings of parameters are presented in section 2.3.
Thus, the total losses on the gas pipeline from the Ludlovskoye field to the city of
Murmansk will be:∆P = 12.24 MPa. As result, at the section from Shtokmanovskoye field
to the city of Murmansk the initial pressure should be increased from 6.17 MPa to 16.00
MPa, i.e., by 9.83 MPa.
3.3 Results of economic calculation
In a simplified economic calculation, the profitability of the project was calculated without
taking into account passive costs, taxes, discount rates over time and, approximately, with
them. In both cases, the profitability of the project is positive. The main buyers of Russian
gas transported through the pipeline will be the countries of Western Europe. The main
buyers of compressed natural gas delivered by gas carriers along the Northern Sea will be
Asian countries.
According to the calculations (Table 4), it will take 2 vessels to transport liquefied
natural gas from the port of Murmansk to the port of Rotterdam, and 8 vessels for
compressed natural gas, but it is worth considering that the cost of one liquefied natural gas
tanker is higher due to complex construction of liquefying facilities. Although the fuel
consumption and cost per voyage for compressed natural gas tankers is lower than for
liquefied natural gas tankers, when transporting the same volume of natural gas the fuel
cost per year for compressed natural gas tankers is 17% higher due to the higher number of
voyages. In addition, it should be taken into account that 65% of the cost of transporting
liquefied natural gas is spent on liquefaction, storage and regasification at the liquefied
natural gas plant. Meanwhile, compressed natural gas vessels can receive and return gas on
their own, the process does not require pre-treatment, filters and compressors are placed on
the vessel. This advantage will save on infrastructure costs that are typical for liquefied
natural gas transportation. From an environmental point of view, the use of compressed
natural gas technology is preferable due to the low losses of gas during transportation.
Thus, to make the final choice between liquefied natural gas and compressed natural gas
technologies for transporting natural gas from the fields of the Barents Sea to the European
market, it is necessary to continue research on this issue and make an economic assessment
with the account of depreciation, operating and freight costs, port charges, and customs
duties.
The possibility of combining the gas pipelines with the Nord Stream simplifies the task
and guarantees gas supplies to European countries up until 2100.
With stable deliveries to Europe by the three sections described in 3.2, the profit will be
about 3.24 trillion rubles a year (Table 5). The project implementation time is 10 years.
11E3S Web of Conferences 266, 01008 (2021) https://doi.org/10.1051/e3sconf/202126601008
TOPICAL ISSUES 2021
Table 4. Calculation results for the case of transportation to the port of Rotterdam
_____________________________________________________________________
Parameter LNG CNG Unit
_________________________________________________________
The estimated number 2 8
of the carrier ship
The cost of fuel
for one voyage 96.4 41.07 Thsnd Euro.
The estimated number
of the voyages 56 160
The estimated annul
fuel cost 5.4 6.5 Mln Euro
Table 5. Results of economic calculation
____________________________________________________________________________________________
Parameter Result Unit Parameter Result Unit
_________________________________________________________________________________
___________
The cost of laying 900 Bln rub Profit on export 50-223 BlnRub
all gas pipelines to Europe per year****
to the shore**
The amount of initial 607 Bln rub Payback period 15.8 years
costs for the creation
of 3 platforms***
Price per 1 km 100 Mln rub Total cost 1.70 tril rub
in a marshy area
Construction cost 120 Bln rub Payback period 2.5 times
to reach the nearest gas pipeline will increase in*
___________________________________________________________________________________________*
*All additional costs included
** 10 Bln Euros were spent on the construction of the Nord Stream. [27] The length under
consideration is about the same.
*** Based on the cost of the Prirazlomnaya platform
**** Depends on the year of the project development. The peak profitability point of for the 15th year
of the project implementation is 223 billlion rub
4 Conclusion
Thus, in the course of this work, the requirements to design, construction, operation, and
environmental safety necessary for organization of pipeline gas transportation on the Arctic
shelf were studied; a rough estimation of structural parameters of the gas pipeline was
made; , the scheme for its construction was proposed taking into account open gas fields,
and hydraulic calculation and economic analysis were carried out.
Offshore gas pipelines in the Russian Federation are designed mainly for special
technical conditions with due consideration of many design features. In this project, it is
necessary to use a J-type pipe laying vessel. In coastal zones, the pipeline is laid in
trenches, and the sections remote from the shore are on the bottom.
The pipe must be steel, seamless, with an inner diameter of 1420 mm, with epoxy
coating on both inner and outer surfaces, and have a concrete casing of 60-110 mm for
ballasting. Total losses of pressure along the gas pipeline from the Ludlovskoye field to the
city of Murmansk will be 12.24 MPa. As a result of the economic analysis, the
12E3S Web of Conferences 266, 01008 (2021) https://doi.org/10.1051/e3sconf/202126601008
TOPICAL ISSUES 2021
following values were obtained that characterize the profitability and prospects of this
project. Profit per year for deliveries to Europe via the Nord Stream amounts to 223 billion
rubles (excluding taxes). Initial costs (excluding cleaning units, electricity, time elongation,
and production costs) amount to 600 billion rubles. The payback period is 15.8 years.
According to the work, we can conclude that the project is not only realistic but also
profitable. At the same time, according to the TESCIMP-methodology, the project is
profitable for everyone [21, 22, 26]. Difficulties in both development and transportation in
such conditions are many, but everything is realistic to be accomplished.
As a conclusion about the long-term work in the framework of the Arctic project, the
following proven arguments can be highlighted:
1. Economic and technological aspects confirm the success of the combined
method of transporting hydrocarbons, namely a network of gas pipelines with key platforms
that serve as terminals, to transport compressed natural gas from platforms in the Barents
Sea around the world.
2. Gas hydrates are a big problem, both during development and during
transportation. The most reliable way to develop gas hydrates is partial oxidation. The
solution to the problem of gas hydrates in the pipeline is digital technology and reliable
pipe laying
3. The payback period of the project is confirmed by economic calculation and
calculations of transportation to Rotterdam
4. According to calculations, promising opportunities for development of the
project taking into account the depletion of reserves – is the development of methods of
underwater drilling of smaller fields
5. Average pressure losses during transportation along the selected route due to the
presented thermodynamic conditions amount to 12.24 MPa.
6. There are a wide range of threats to humans and surrounding countries.
References
1. D.S. Bratskikh, K.D. Parfenchik, E.I. Krapivsky, Transportation of Arctic Gas
GHGs to Central Europe, St. Petersburg Mining University (SPB), 1-4. (2019).
2. V.S. Litvinenko, P.S. Tsvetkov, M.V. Dvoinikov, G.V. Buslaev, Obstacles to
hydrogen initiatives in the context of sustainable global energy development, Journal of
Mining Institute, 244, 428-438 (2020)
3. A.S. Khodyreva, E.B. Gridina, Industrial and labor safety during the extraction
and transportation of natural gas on the Arctic shelf, St. Petersburg University of the State
Fire Service of the Ministry of Emergency Situations of Russia, 1-10 (2020)
4. Joo Yong Lee. Review on the Gas Hydrate Development and Production as a New
Energy Resource, KSCE Journal of Civil Engineering (2011).
5. A.K. Fernandez, Formation of gas hydrates in Artic, SPMU, 1-8 (2020)
6. M.V. Ilinykh, M.N. Nazarova, E.V. Akimova, A.G. Palaev, Assessment of the
technical condition of underwater crossings of trunk pipelines in real terms, IOP
Conference Series: Earth and Environmental Science, 194 (7) (2018)
7. O.Bychkova, A. Khrulenko, F. Domanyuk et al., Challenges and solutions for the
development of arctic petroleum resources, Gubkin Russian State University of Oil and
Gas, University of Stavanger, 22-27 (2009).
8. Set of Regulations 369.1325800.2017. Stationary offshore platforms. Design
13E3S Web of Conferences 266, 01008 (2021) https://doi.org/10.1051/e3sconf/202126601008
TOPICAL ISSUES 2021
Regulations, (2017)
9. Set of Regulations. Offshore pipelines. Design and Construction Regulations.
(Moscow, 2016).
10. E.G. Katysheva, The role of the Northern Sea Route in Russian LNG Project
Development, IOP Conference Series: Earth and Environmental Science, 180(1), 012008
(2018)
11. I.V. Stepanov et. al.. Environmental and economic assessment of offshore
transportation of compressed gas. (M., 2017).
12. V.I. Bogoyavlensky, T.A. Budagova, A.V. Bezhentsev, Termobaric conditions of
the Barents-Kara Region, IPG RAS (Moscow), Geotrace (Tyumen): 1-12. (2016).
13. TO Gazprom 2-3.5-051-2006 Standards for technological design of trunk gas
pipelines, (2006).
14. V.I. Bogoyavlensky, Oil and gas production in the World Ocean and the potential
of the Russian shelf. FEC development strategy, 6, 44-52 (2012)
15. V.I. Nochvai, Efficiency of Russian LNG and CNG transportation to Asia via the
Northern Sea Route, SPMU, 1-23 (2020)
16. SNiP 412-81, Recommendations for the design and construction of underwater oil
and gas pipelines, (2009).
17. A.M. Kirilov, Offshore pipelaying in the Arctic. Digitalization and new ways of its
development, SPMU, 1-6 (2020)
18. A.G. Aksyutin, V.A. Ishkov, Grachev, environmental and economic assessment of
marine transportation of compressed gas, Gas Industry, 4 (767) , 114-122 (2018)
19. E.A. Gushchina, Comparison of transportation costs for LNG and CNG from the
Barents Sea fields to Central Europe, SPMU, 1-18. (2020)
20. D.S. Bratskikh, K.D. Parfenchik, A.V. Menshenina, D.A. Kalashnikova, F.V.
Meryashev, V.A. Negrova The construction of offshore gas pipeline systems in the Arctic
zone: 54 p. (2017).
21. A.F. Chanysheva, A.A. Ilinova, V.M. Solovyova, A.E. Cherepovitsyn, Long-term
forecasts of oil and gas shelf development in the Arctic: the existing methodical approaches
and assessment of the possibility of their application, IOP Conference Series: Earth and
Environmental Science, 302(1), 012068, (2019)
22. A.T. Bakesheva, V.G. Fetisov, V.V. Pshenin, Refined algorithm for localization of
leaks in gas pipelines with the determination of quantitative parameters International
Journal of Engineering Research and Technology, 12 (12), 2867-2869 (2019)
23. N.I. Braghnikov, Innovative technologies for the development of offshore gas
hydrate deposits, SPSBU, 1-13 (2020)
24. M. Bulakh, A.B. Zolotukhin, O.T., Gudmestad Fedyn, Arch as a promising zone
for HC reserves in the Barents Sea. An agreement between Russia and Norway, SPE paper
(2011)
25. Yu.N. Grigorenko, E.A. Margulis, Yu.N. Novikov, V.S. Sobolev, Russia’s
offshore hydrocarbon base and prospects for its development, Oil and Gas Geology. Theory
and Practice.5-7 (2007)
26. A. Minikeyeva, Parametric Study of Multiphase Flow in the Fedyn Arch Pipelines
of the Barents Sea (University of Stavanger – Norway, 2012)
14E3S Web of Conferences 266, 01008 (2021) https://doi.org/10.1051/e3sconf/202126601008
TOPICAL ISSUES 2021
27. Ju. Wettengel, Gas pipeline Nord Stream 2 links Germany to Russia, but splits
Europe, Clean Energy Wire, (2020).
28. N. Babyr, A. Karpikov, R. Aliev. An analysis of the effectiveness of hydraulic
fracturing at YS1 of the Northern field IOP Conference Series: M.S.E 952 (2020).
29. V. Fetisov et. all. Evaluation of Pollutant Emissions into the Atmosphere during
the Loading of Hydrocarbons in Marine Oil Tankers in the Arctic Region J. Mar. Sci. Eng.
917 (2020).
15You can also read