Goldman Sachs Seventh Annual European Chemicals Conference - London, 16 March 2018 - K+S Aktiengesellschaft
←
→
Page content transcription
If your browser does not render page correctly, please read the page content below
K+S Aktiengesellschaft

Goldman Sachs
Seventh Annual European Chemicals Conference

London, 16 March 2018

Thorsten Boeckers, CFO
Martin Heistermann, Senior Investor Relations Manager
K+S Group
Disclaimer

No reliance may be placed for any purpose whatsoever on the information or opinions contained in the Presentation or on its completeness, accuracy of fairness. No
representation or warranty, express or implied, is made or given by or on behalf of the Company or any of its respective directors, officers, employees, agents or advisers
as to the accuracy, completeness or fairness of the information or opinions contained in the Presentation and no responsibility or liability is accepted by any of them for
any such information or opinions. In particular, no representation or warranty, express or implied, is given as to the achievement or reasonableness of, and no reliance
should be placed on any projections, targets, ambitions, estimates or forecasts contained in this Presentation and nothing in this Presentation is or should be relied on as a
promise or representation as to the future.

This presentation contains facts and forecasts that relate to the future development of the K+S Group and its companies. The forecasts are estimates that we have made
on the basis of all the information available to us at this moment in time. Should the assumptions underlying these forecasts prove not to be correct or should certain risks
– such as those referred to in the Annual Report – materialise, actual developments and events may deviate from current expectations. Given these risks, uncertainties and
other factors, recipients of this document are cautioned not to place undue reliance on these forecasts.

This Presentation is subject to change. In particular, certain financial results presented herein are unaudited, and may still be undergoing review by the Company’s
accountants. The Company may not notify you of changes and disclaims any obligation to update or revise any statements, in particular forward-looking statements, to
reflect future events or developments, save for the making of such disclosures as are required by the provisions of statue. Thus statements contained in this Presentation
should not be unduly relied upon and past events or performance should not be taken as a guarantee or indication of future events or performance.

This presentation has been prepared for information purposes only. It does not constitute an offer, an invitation or a recommendation to purchase or sell securities issued
by K+S Aktiengesellschaft or any company of the K+S Group in any jurisdiction.

                                                                                                                                                           K+S Group          2
K+S Group
Content

 A   K+S’ Unique Strategic Position

 1   Potash and Magnesium Products

 2   Salt

 B   Current Trading

 C   Outlook

                                      K+S Group   3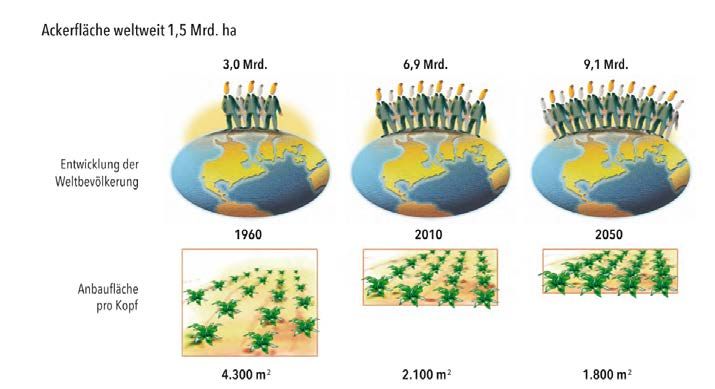
K+S Group
A fresh perspective on our existing portfolio
  Production                                            Customer
     focus                                                focus
                                                                                Key financials 2017
                                                           (€m)

                                 • MOP                            1,428                    39%
               1                 • Premium Fertilizers                     225
                                                                                                            16%

                   Agriculture
                                 • Fertigation
                                                                                          Revenue          EBITDA-
                                                             Revenue      EBITDA
                                                                                           share           Margin

                                 •   Chemical
                                                                  1,176                    32%
Potash Salt    2                                                                                            20%
                                 •   Pharma
                                 •   Ind. Specialties                      238

                     Industry    •   Food Processing
                                                             Revenue      EBITDA          Revenue          EBITDA-

     +
                                                                                           share           Margin

                                                                  566                      16%              18%
               3                 • De-Icing                                104

                   Communities                               Revenue      EBITDA          Revenue
                                                                                           share
                                                                                                           EBITDA-
                                                                                                           Margin

               4                 • Consumers                      454      57              13%              12%

                   Consumers                                 Revenue      EBITDA          Revenue
                                                                                           share
                                                                                                           EBITDA-
                                                                                                           Margin

                                                                                                      K+S Group      4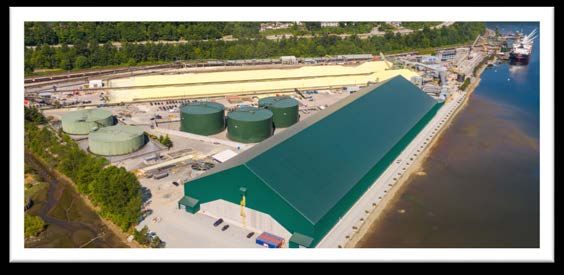
K+S Group
'One K+S' creates the most value for all stakeholders

                                     • "Customer first" approach reflected in new
                                       business cut along customer segments
                      Customers      • Spotlights on our hidden champions

                                     • Measureable synergies from leveraging our
                                       scale
                      Shareholders   • Ample growth and profitability opportunities
                                       identified

                                     • Reduced complexity, less overhead
                                     • More attractive career options in integrated
                      Employees        business
                                     • Clear commitment to our production sites

                                     • Clear commitment to sustainability
                                     • Continued, value-adding investments in
                      Society
                                       Germany and abroad

                                                                                 K+S Group   5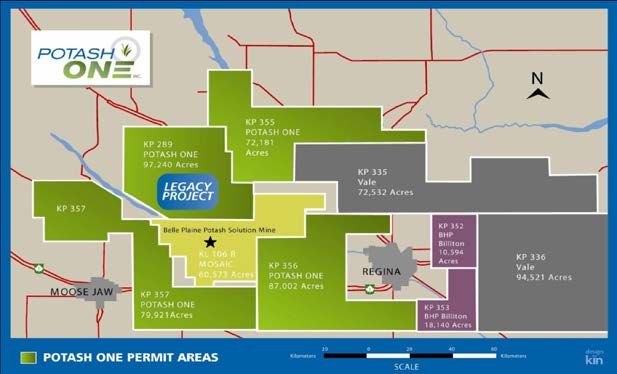
K+S Group
We will implement our new strategy in two phases

       Phase 1: Transformation                                    Phase 2: Growth

2017                                         2020                                                      2030
          Reduce indebtedness                          Tapping the full potential of our existing
                                                       assets
          Realize synergies
                                                       Exploring new adjacent growth areas

          Advance corporate culture                         Increased share of specialties

          Shaping the organization
          and focusing towards our clients

                       Net debt/        halved       Investment grade rating
                                                                                    EBITDA-Ambition     €3bn
                       EBITDA          vs. H1/2017   achieved in 2023
                                                                                    ROCE                >15%
                       Synergies        >€150m                                      Revenue growth
                                                                                                        >4%
                                                                                    beyond 2030

                                                                                                      K+S Group   6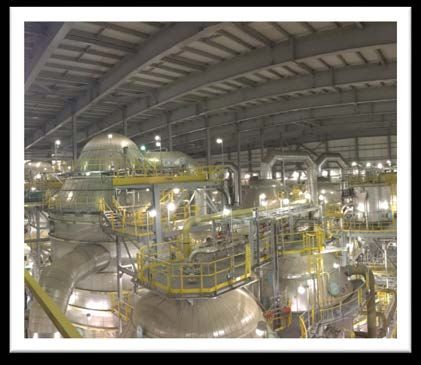
K+S Group
Phase 1: We will transform ourselves and create a solid financial base

               Strengthen                                              Shaping the
               financial base                                          organization
   Realize Synergies                                         Customer first: Lift our potential
      Operations: Lean management
                                                              • Focus on customer segments
                                                                Agriculture, Industry,
        Operations: Digital mining                              Communities and Consumers to
                                                                better penetrate high-margin,
               Procurement                                      non-commodity business
                                           > € 150m
    Evaluate tailings piles optimization    p.a. run rate
                                           after inflation   Increase financial transparency
                                             by 2020 YE
             Sales excellence                                  • Make performance transparent
                                                                 along new customer segments
        Supply chain and logistics

            G&A optimization                                 Build ‘One Company’
                                                              • Commit to existing portfolio
   Reduce indebtedness                                        • Break up silos and create the
                                                                 foundation to generate synergies

                                                                                                    K+S Group   7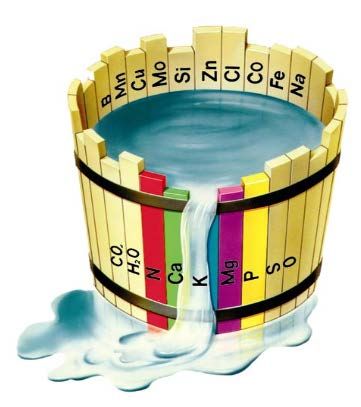
K+S Group
   We aim for a positive free cash flow in 2019
                                Phase 1: Transformation                          Phase 2: Growth

                        Free cash flow bridge approximation 2016-2020
                    Based on current portfolio – inorganic growth not included      Ambition

                                         + CapEx                                 Investment grade rating
                                         + Werra
                                         + Bethune                               achieved in 2023
                                         - FX
Fully invested in                        - WC
best class assets                                                                EBITDA        €3bn
  like Bethune
                                                                                 ROCE          >15%

                       Actual     2017      2018e 2019e 2020e                        2030
                        2016

                                Massive positive swing in free cash flow

                                                                                                  K+S Group   8
K+S Group
Phase 2: Growth opportunities in our Customer Segments

         Revenue shares and CAGR 2016-2019-2030                   Growth initiatives from 2020
                                    7%
                                    5%
                                  Organic     ~€11bn
                                    2%
                                  Inorganic            • Tapping the potential of existing assets and
                                                         expansion options
                                                       • Expand offering of specialty fertilizers
                                               45%
                                                       • Develop strong position in fertigation
                                                       • Develop advanced business models (e.g. agro-
                                                         platform in Africa)
                                       8%
                                                       • Strengthen portfolio of specialty industrial products
                                                       • Expand offering for the pharma industry
                                               35%
               €3.5bn
                            43%
                                                       • Grow into Asia
 Agriculture    37%                    9%

                            28%
                                                       • Leverage branding capabilities in consumer salt
    Industry    33%
                                       6%
                                               10%     • Grow into Asia
                            12%
  Consumers     13%
                                               10%     • Strengthen position in existing markets
Communities     17%         17%        4%

               2016       2019                2030

                                                                                                           K+S Group   9
K+S Group
 What we’ve done – what our next steps are

                        Update on Shaping 2030

                    !   Setting up project management

                    !   Preparing to decide on new organization and reporting lines
    Ongoing tasks

                    !   Start of bottom-up validation of synergies (> €150 m by 2020)

                    !   Management remuneration (LTI) linked to share price performance

                    !    First concept about future organization and KPIs

                    !   Bottom-up validation of synergies done – confident to reach at least € 150 m

                    !   Projects to lift synergies are starting
    Next to come

                    !   Final concept about future organization incl. KPIs done

                    !   Sustainability targets and KPIs defined. Possible use of solid residues clarified

We will keep you posted with updates on our Strategy in H1/2018 and at a CMD at 5 Sept 18
                                                                                                            K+S Group   10
K+S Group
Content
A K+S’ Unique Strategic Position
1 Potash and Magnesium Products
2 Salt
B Current Trading
C Outlook
K+S Group 11Potash and Magnesium Products
Long-Term Dynamics Positive for Fertilizer
Less arable land –
Potash is indispensable for plant growth
but more protein consumption per capita
Jahr 1960 2010 2050
Global population
development
3.0 billion 6.9 billion 9.7 billion
Arable Land
per capita
4.300 m2 2.100 m2 1.800 m2
Protein
per capita
60 g/ day 80 g/ day 130 g/ day1
“The growth and yield of plants are limited by the
nutrient which is in shortest supply”
Sources: UN, World Population Prospects, 2012 Revision, UNDP, 2013; FAOStat 2014
Justus von Liebig, 'The Natural Laws of Husbandry', 1863
FAO 2014 - forecasts based on the expected increase in animal protein
K+S Group 12Potash and Magnesium Products
Unique Portfolio Makes us More Robust
Health Care &
Industrial Nutrition Broad portfolio of specialty products
products
0.8 Industrial potash Flexibility
KCL (MOP)
3.2 6.7 Kieserite Stability
Specialties
2.7 Korn-Kali
Partly following different trends
and seasons
SOP
Basis: 2017 Sales volumes in million tons
South
America
Close proximity to our main customers
Europe
16% provide logistical advantages
59%
Asia
17%
Shipments to overseas customers at
competitive costs from Hamburg harbor
Other
8% Strong and long-standing customer
Basis: 2017 Revenues
relationships
K+S Group 13Potash and Magnesium Products
Potash Price Comparisons
MOP gran. Europe vs. Brazil (Source: FMB)
US$/t €/t
600 600
Brazil
500 (US$/t, Granular, cfr)
500
400 400
300 300
Europe
(€/t, Granular, cfr)
200 200
2012 2013 2014 2015 2016 2017 2018
K+S average selling price versus selected peers (local currencies)
K+S
K+S
Basis: Q1 2014
Basis: Q1 2012
Peers
Peers
Q1 Q1 Q1 Q1 Q1 Q1 Q1 Q1 Q1 Q1
2012 2013 2014 2015 2016 2017 2014 2015 2016 2017
K+S Group 14Potash and Magnesium Products
New approach to environmental challenges works
Track Record Saline wastewater significantly reduced
! Implementation of measures to limit the Amount in million
cubic meter
risk of outage days
20
! KCF 1 commissioned (reduction of saline
wastewater by 20%)
! K+S mandated advisor K-UTEC to carry 14
out a concept to further reduce saline
wastewater
7 7
! Expansion of tailings pile capacity
5.5
Hattorf (Werra): ‘Early commencement’
granted
! K+S reaches settlement with BUND
! Thuringian municipality of Gerstungen 1997 2006 2016 2017 2018
and K+S end their long-lasting dispute
Discharge Deep-well Measures Gap
! Preparing for future approval procedures
and further wastewater reductions
1) Kainite Crystallization and Flotation Facility K+S Group 15Potash and Magnesium Products
Bethune … up and running
"With Bethune, the most modern potash facility in the world, we are pushing into a new
dimension. We are now producing potash on two continents,“
said Dr. Burkhard Lohr (CEO of K+S).
K+S Group 16Potash and Magnesium Products
Bethune - Strengthening our Global Presence
Expanding our current production portfolio in
Germany with a North American production site
Second source supplier
Securing a good asset base with competitive
production costs
Sales and distribution through existing distribution
structures of the K+S Group
Exclusive outline agreement with Koch Fertilizer
about supply and sales of Potash fertilizers in the US
China
India North America Regional growth projects in China and SEA
South East Asia Flexible multi-product strategy
South America
K+S Group 17K+S Group
Content
A K+S’ Unique Strategic Position
1 Potash and Magnesium Products
2 Salt
B Current Trading
C Outlook
K+S Group 18Salt
Long-Term Dynamics in Salt Demand
Demand driven by … Product category
Winter weather conditions De-Icing
Infrastructure development
Consumer
Increasing standard of living
Food processing
Population growth
Economic growth and Industrial
industrialisation
Urbanization Chemical
Low single-digit demand growth p.a. to 2018 1
1 Source: Roskill
K+S Group 19Salt
Inevitable for life
De-Icing Consumer Food processing Industrial Chemical
Main Applications: Main Applications: Main Applications: Main Applications: Main Applications:
Winter road Table salt Food processing Water treatment Chemical industry
maintenance Dishwasher care industry Drilling fluids Chlor-Alkali
services Baking industry Animal feed processes (→ PVC)
Water softening
Commercial users Condiment and Infusion, dialysis Polycarbonates ,
Pool chlorination
Private preservative agent solutions MDI (Isocyanat)
Body care
households Pharmaceuticals (→ plastics,
synthetic resin)
Preserving of fish
Dyeing works Synthetic Soda Ash
(→ glass)
Leather treatment
K+S Group 20Salt
Unrivalled Global Production Network
Potential Expansion
into
Asia-Pacific
More than 30 assets on 3 continents allow close proximity to
Competitive edge: customers in a business that is highly freight-cost sensitive
Unique natural hedge
Unrivalled global Broad range of products due to variety of production methods
production network Best in class supply chain assets and competence
Industry best cost production in Chile
K+S Group 21Salt
Diverse Regional and Product Portfolio
Salt for
chemical use
Food
processing
Normalized
Revenue Industrial
Distribution
Consumer
1 De-icing adjusted to normal winter
K+S Group 22Salt
Presence in Attractive De-Icing Markets
Eastern Canada
Scandinavia
US East Coast Central Europe
Great Lakes
Indicative regional strength of winter
2011/12 2012/13 2013/14 2014/15 2015/16 2016/17
Europe North America
K+S Group 23K+S Group
Content
A K+S’ Unique Strategic Position
1 Potash and Magnesium Products
2 Salt
B Current Trading
C Outlook
K+S Group 24K+S Group P&L € million Q1/16 Q2/16 Q3/16 Q4/16 FY/16 Q1/17 Q2/17 Q3/17 Q4/17 FY/17 Revenues 1,096 732 688 941 3,457 1,126 742 723 1,032 3,627 EBITDA 285 83 56 94 519 211 102 77 187 577 Margin 26% 11% 8% 10% 15% 19% 14% 11% 18% 16% EBIT I 218 15 -31 28 229 137 29 12 93 271 Financial result -13 -15 -9 -15 -52 -9 -4 -9 -5 -26 EBT, adjusted 205 0 -41 13 177 129 25 3 87 244 Tax rate, adjusted 28% 29% 34% 23% 26% 27% 24% 33% 66% 41% Net income, adjusted 148 0 -27 10 131 95 19 2 30 145 EPS, adjusted 0.77 0.00 -0.14 0.05 0.68 0.49 0.10 0.01 0.16 0.76 Tangibly improved operating earnings EBITDA and EBIT I, despite €43m effect for Sigmundshall closure Potash pricing continues to recover, SOP prices have bottomed out Higher product availability at the integrated Werra plant; no days of outages in Q4/17 Higher volumes in Salt in Q4 The adjusted key figures only include realized operating forecast hedges of the respective reporting period in EBIT I. In addition, related effects on deferred and cash taxes are also excluded. K+S Group 25
K+S Group
Cash Flow and Balance Sheet
€ million Q1/16 H1/16 9M/16 FY/16 Q1/17 H1/17 9M/17 FY/17
Operating cash flow 294 359 390 445 267 384 383 307
- Investing cash flow
-243 -537 -847 -1,222 -212 -410 -623 -697
(pre sale/ purchase of securities)
Adjusted free cash flow 50 -178 -456 -777 55 -26 -241 -390
CapEx 280 643 904 1,171 277 410 568 811
Net debt (-) -2,367 -2,860 -3,180 -3,584 -3,614 -3,745 -3,939 -4,141
t/o Net financial debt (-) -1,315 -1,761 -2,052 -2,401 -2,440 -2,592 -2,780 -2,974
Net debt/ EBITDA (LTM) 2.5 3.6 4.9 6.9 8.1 8.1 8.1 7.2
Equity ratio 52% 49% 48% 47% 48% 45% 44% 43%
Operating cash flow lower than last year due to higher Working Capital and FX
CapEx came down as high investments at Bethune in Canada came to an end; FCF improved significantly
Net Debt/ EBITDA peaked in 2017
K+S Group 26K+S Group
Potash and Magnesium Products
€ million Q1/16 Q2/16 Q3/16 Q4/16 FY/16 Q1/17 Q2/17 Q3/17 Q4/17 FY/17
Revenues 461 371 302 399 1,532 474 387 358 485 1,704
EBITDA 137 50 5 -8 185 81 71 42 74 269
Margin 30% 14% 2% -2% 12% 17% 18% 12% 15% 16%
EBIT 102 15 -49 -35 34 42 31 2 6 81
Avg. selling price (€/t) 272 250 239 246 253 260 252 253 250 254
Sales volumes (million tons) 1.69 1.48 1.26 1.62 6.06 1.82 1.54 1.41 1.94 6.71
Cash Unit Costs 1 192 217 236 251 222 216 205 224 212 214
Demand remains strong across all regions
ASP slightly up in Q4 (YoY) due to higher product availability and better market pricing; sequentially
down as Bethune volumes came in
Adverse FX-effect
Cash unit costs peaked
Production problems at Werra plant addressed
1 (Revenues – EBITDA) / Sales volumes
K+S Group 27K+S Group
Salt
€ million Q1/16 Q2/16 Q3/16 Q4/16 FY/16 Q1/17 Q2/17 Q3/17 Q4/17 FY/17
Revenues 595 319 346 502 1,762 611 316 329 507 1,762
EBITDA 150 33 47 93 322 135 29 37 124 325
Margin 25% 10% 14% 18% 18% 22% 9% 11% 24% 18%
EBIT 123 5 18 58 204 106 0 17 100 223
Sales volumes (million tons) 7.1 2.9 3.5 5.8 19.4 7.5 2.8 3.5 6.5 20.3
De-icing 4.9 0.6 1.0 3.5 10.1 5.1 0.6 1.0 4.0 10.7
Non de-icing 2.2 2.3 2.5 2.3 9.3 2.4 2.3 2.5 2.5 9.7
Average selling prices (€)
De-icing 64 53 52 59 60 61 54 50 55 58
Non de-icing 122 123 113 124 120 120 122 109 110 115
Non de-icing: Vols up in Q4 (YoY), but prices down due to higher share of chemical/industrial salt
De-icing: Better demand in Europe more than offsets weak US-pricing in Q4/17
On track to reach SALT 2020 EBITDA-target of at least € 400m
K+S Group 28K+S Group
Debt Instruments (as of Dec. 31, 2017)
Bonds Bank loans, Schuldschein Syndicated credit
Leasing, others loans line1
€ 2.1 about € 765
billion million € 1 billion
€ 220
avg. maturity: million avg. maturity: expires in 2020
3.75 yrs 2.75 yrs
1 As an alternative instrument a Commercial Paper program is in place
K+S Group 29K+S Group
Debt Profile
Debt Instruments
Bond IV € 500 million
(mat. 2018; coupon 3.125%)
Schuldschein € 325 million
3.000
(mat. 2019)
Loan € 45 million
(mat. 2020)
2.500 Schuldschein € 335 million
(mat. 2021)
Bond III € 500 million
2.000 (mat. 2021; coupon 4.125%)
Bond II € 500 million
(mat. 2022; coupon 3.000%)
Schuldschein € 65 million
1.500
(mat. 2022)
Bond I € 625 million
(mat. 2023, coupon 2.625%)
1.000 Schuldschein € 40 million
(mat. 2023)
500
0
2017 2018 2019 2020 2021 2022 2023
As further liquidity source a syndicated credit line facility amounting to € 1 billion and a
Commercial Paper program are in place until 2020
K+S Group 30K+S Group
NetDebt/EBITDA development
8,0
7.2
6.9
7,0
6,0
5,0
X-fach
4,0
3.2 3.3
3,0 2.6
2.3
1.8 1.8 1.8
2,0 1.6
1.1 1.0 1.2 0.4 0.8 1.1
0.7 0.8 0.5 0.8
1,0
Legacy
0,0
K+S Group 31K+S Group
Dividend Policy
50% 10%
Target payout ratio of 40-50% Earnings-based dividend
45% policy
40% 8%
Payout ratio of 40 – 50% of
35%
adjusted net profit
30% 6%
25%
Dividend proposal for 2017:
€ 0.35 per share
20% 4%
15%
10% 2%
5%
0% 0%
1
2013 2014 2015 2016 2017
Payout ratio (lhs) Dividend yield (rhs) 2
1 Proposal to the AGM.
2 Based on year-end share prices
K+S Group 32K+S Group
Currency Management
Transaction Translation
Freight/
other costs
CAD/EUR
USD/EUR USD/CAD USD/EUR
K+S Group 33K+S Group
Currency Management
2018
1,25 1,45
Limitation of risk Worst Case Limitation of chance
1,20 1,40
Planned EUR/USD
USD/CAD
EUR/USD
1,15 1,35
Best Case
Best Case
1,10 1,30
Planned USD/CAD Worst Case
1,05 1,25
Limitation of chance Limitation of risk
1,00 1,20
Q1 Q2 Q3 Q4 Q1 Q2 Q3 Q4
2017: Realized average exchange rate: 1.12 EUR/USD (incl. premium) 2017: no operational hedging transactions
2018: Anticipated average exchange rate: 1.15 EUR/USD (incl. premium)¹ 2018: Anticipated average exchange rate: 1.31 USD/CAD (incl. premium)²
Hedging of transaction risks, basis USD budget net position
Cash flow view: most of anticipated net position hedged
Hedging is used if an underlying transaction exists or is expected with
great probability
¹ Premise: based on planned rate of 1.20 EUR/USD for 2018; ² Premise: based on planned rate of 1.25 USD/CAD for 2018
K+S Group 34K+S Group
Content
A K+S’ Unique Strategic Position
1 Potash and Magnesium Products
2 Salt
B Current Trading
C Outlook
K+S Group 35K+S Group
Guidance 2018: EBITDA1
Significant
increase2
€ million
Main effects: Main effects:
- Planning assumption: + Sigmundshall
1.20 EUR/USD
Main effects:
Main effects: + Potash volumes
+ Potash prices (outage days)
(slight increase) + Tangibly higher salt
volumes
577
Main effects:
+ Higher sales
+ Cost improvement
Actual Bethune Price Volume Currency Other 2018e
2017 effects
(net)
1 The basis for EBITDA is EBIT I, that only includes the realized result from operating forecast hedges.
2 Based on average weather conditions in both business units.
K+S Group 36K+S Group
Guidance: Housekeeping items
FY 2016 FY 2017 FY 2018e
Group
Revenues € 3.5bn € 3.6 bn tangible increase
EBITDA € 519m € 577m significant increase
EBIT I € 229m € 271m significant increase
significantly more
Financial result € -52m € -26m
negative
Significant
Free cash flow, adjusted € -777 € -390
improvement
CapEx € 1.2bn € 811m significant decrease
Average fx-rate (EUR/USD) 1.11 1.13 1.20
Production Outage Days (Werra) ~200 days ~25 days 0 days
Potash and Magnesium Products
Global sales volumes1 ~ 66m tons ~ 69m tons At least stable
K+S sales volumes 6.1m tons 6.7m tons significant increase
Average selling price 253 €/t 254 €/t slight increase
Salt
K+S sales volumes 19m tons 20m tons tangible increase
t/o de-icing 10m tons 11m tons tangible increase
1 Incl. ̴ 4mt of potassium sulphate and potash grades with lower mineral content
K+S Group 37K+S Group
IR Contact Details
K+S Aktiengesellschaft
Bertha-von-Suttner-Str. 7
34131 Kassel (Germany)
E-mail: investor-relations@k-plus-s.com
Homepage: www.k-plus-s.com
IR-website: www.k-plus-s.com/ir
Lutz Grüten Katharina Volkmar
Head of Investor Relations Roadshow Management
Phone: +49 561 / 9301-1460 Phone: +49 561 / 9301-1100
Fax: +49 561 / 9301-2425 Fax: +49 561 / 9301-2425
lutz.grueten@k-plus-s.com katharina.volkmar@k-plus-s.com
Laura Schumbera Martin Heistermann Alexander Enge
Junior Investor Relations Manager Senior Investor Relations Manager Investor Relations Manager
Phone: +49 561 / 9301-1607 Phone: +49 561 / 9301-1403 Phone: +49 561 / 9301-1885
Fax: +49 561 / 9301-2425 Fax: +49 561 / 9301-2425 Fax: +49 561 / 9301-2425
laura.schumbera@k-plus-s.com martin.heistermann@k-plus-s.com alexander.enge@k-plus-s.com
K+S Group 38K+S Group
Financial Calendar
CFO Roadshow Frankfurt, MainFirst 15 March 2018
Goldman Sachs 7th European Chemicals Conference with CFO, London 16 March 2018
Non Deal Fixed Income Roadshow Frankfurt, DZ Bank 21 March 2018
Non Deal Fixed Income Roadshow London, Goldman 22 March 2018
Roadshow Paris, Bank of America Merrill Lynch 6 April 2018
Roadshow Zurich, UBS 11 April 2018
Solventis Aktienforum with CFO, Frankfurt 12 April 2018
Roadshow Middle East with CFO, Bankhaus Lampe 19 April 2018
Bankhaus Lampe Deutschlandkonferenz, Baden-Baden 20 April 2018
Quarterly Report Q1/18 14 May 2018
Annual General Meeting 15 May 2018
Half-yearly Financial Report H1/18 14 August 2018
Capital Markets Day in Bethune, Canada (save-the-date) 5 September 2018
K+S Group 39K+S Group
K+S Group

K+S Share              K+S ADR                K+S Bond 12/2018       K+S Bond 12/2021       K+S Bond 06/2022       K+S Bond 04/2023
• WKN: KSAG88          • CUSIP: 48265W108     • WKN: A1Y CR4         • WKN: A1Y CR5         • WKN: A1P GZ8         • WKN: A2E 4U9
• ISIN: DE000KSAG888   • ADR Ticker-Symbol:   • ISIN: XS0997941199   • ISIN: XS0997941355   • ISIN: DE000A1PGZ82   • ISIN: XS1591416679
• Ticker-Symbols:        Bloomberg: KPLUY /
  Bloomberg SDF /        Reuters: KPLUY.PK
  Reuters SDFG

             K+S Aktiengesellschaft · Bertha-von-Suttner-Straße 7 · 34131 Kassel | Germany · Internet: www.k-plus-s.com
       Investor Relations · phone: +49 (0)561 / 9301-1100 · fax: +49 (0)561 / 9301-2425 · email: investor-relations@k-plus-s.com

                                                                                                                        K+S Group
You can also read