APEC Study Centre The Chinese University of Hong Kong
←
→
Page content transcription
If your browser does not render page correctly, please read the page content below
APEC Study Centre
           The Chinese University of Hong Kong

    Air Connectivity in APEC:
  Development and Challenges

By Clement K.W. Chow, Cheung-kwok Law,
   Michael C.M. Leung, Michael K.Y. Fung, An-
   drew C.L. Yuen and Ting-hin Yan

                       CUHK-APEC Study Centre
                   2018-11 Working Paper Series - 04
                www.cuhk.edu.hk/hkiaps/apecsc
Professor Clement K.W. Chow is the Head of Department of Mar-
keting and International Business, Lingnan University; both Dr.
Cheung-kwok Law and Professor Michael K.Y. Fung are the Co-
Directors of the APEC Study Centre of the Hong Kong Institute of
Asia Pacific Studies, CUHK; Dr. Michael C.M. Leung is an Assis-
tant Lecturer of Economics Department, CUHK; Dr. Andrew C.L.
Yuen is the Associate Director of the APEC Study Centre, CUHK
and Mr. Ting-hin Yan is a Research Assistant of Economic Re-
search Centre, CUHK. This was the paper submitted to the 2018
APEC Study Centres Consortium Conference, held on 14-15 May,
2018 in Port Moresby, Papua New Guinea.

Copyright c 2018. All right reserved

P UBLISHED BY H ONG KONG APEC S TUDY C ENTRE
T HE C HINESE U NIVERSITY OF H ONG KONG

O FFICIAL WEBSITE : https://www.cuhk.edu.hk/hkiaps/apecsc/

                                  Contact person: Dr. Cheung-kwok Law
                                                               Co-director
                                   APEC Study Centre of the Hong Kong
                                          Institute of Asia Pacific Studies
                                   The Chinese University of Hong Kong
                                   Email: cheungkwok.law@cuhk.edu.hk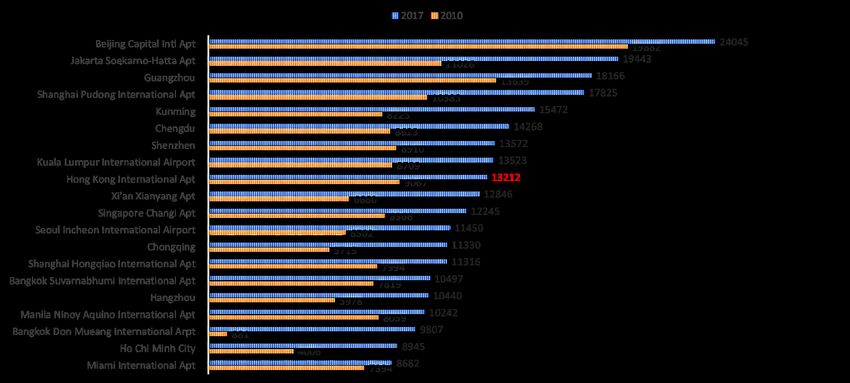
Contents

1     Introduction . . . . . . . . . . . . . . . . . . . . . . . . . . . . . . . . 1

2     The NetScan Model . . . . . . . . . . . . . . . . . . . . . . . . . 3

3     Analysis of Air Connectivity of APEC . . . . . . . . . 5
3.1   Connectivity of APEC Airports to APEC Destinations                          5
3.2   Connectivity of APEC Economies to APEC Destinations 13
3.3   Connectivity of APEC Economies to Selected Continents19
3.4   Connectivity of Hong Kong                                                 21
3.5   Econometric Analysis—Connectivity and Economic Indi-
      cators                                           27

4     Policy Recommendations for APEC . . . . . . . . . 31

      Bibliography . . . . . . . . . . . . . . . . . . . . . . . . . . . . . . . 33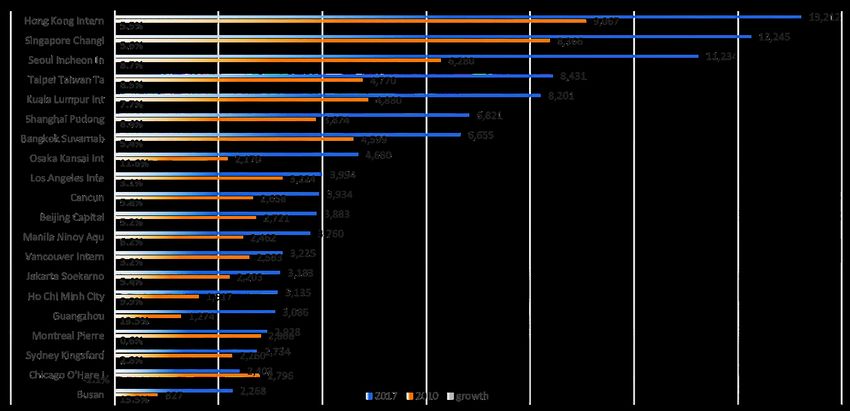
Abstract

This study aims at investigating the air connectivity among APEC economies
and also in the context of the global aviation network. In the APEC Leaders’
2013 Declaration, APEC leaders affirmed their vision of reaching a seamlessly
and comprehensively connected and integrated Asia-Pacific balanced on three
pillars – physical connectivity, institutional connectivity and people-to-people
connectivity. Further, in 2014, an APEC Connectivity Blueprint for 2015 –
2025 was developed to guide the region’s efforts to better integrate the region.
The study will use the NetScan model to measure the connectivity of major
airports of APEC economies in the period between 2009 and 2017. The
results will show the changes in the connectivity of the airports in the study
period. Thus, the results may shed lights on the strategies and policies on how
to establish a seamlessly and comprehensively connected aviation network
among APEC economies.
CHAPTER
                                                                  1
Introduction

Owing to the geography, the Asia Pacific region is separated by the vast Pacific
Ocean. Air transport is an indispensable mode of transportation providing
efficient and speedy flows of passengers and cargoes within the region. Under
globalization and rapid technological progress in communication and trans-
portation, international trade has been growing rapidly since the end of World
War II. Air cargo transport has also been growing rapidly for the past three
decades. However, air cargoes are commonly reported mainly in terms of
volume or weight rather than value and it has substantially under-estimated the
importance of air cargo transport in the international trade (Hummels, 2007).
According to Arvis and B. (2016), although air cargo transport accounted for
only 0.5 per cent of international trade by volume, it accounted for 35% of
international trade by value. Goods moved by aeroplanes are typically of high
value. They are supporting the just-in-time global supply chain system.
     According to the APEC Connectivity Blueprint published in 2014, de-
veloping connectivity among APEC members is crucial for the long-term
successful integration of trade, investment and related economic activities. It
proposes to achieve three levels of connectivity: physical connectivity, institu-
tional connectivity and people-to-people connectivity. In fact, improving the
connectivity of economies in the Asia Pacific region is a major driving force
for facilitating faster and speedier flows of goods, services and people. Air
transport networks have been rapidly developed and linked up to various cities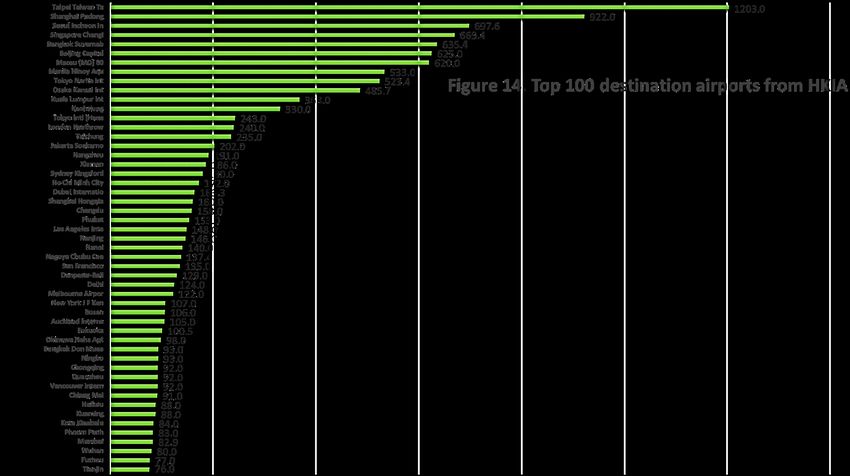
2                                                     Chapter 1. Introduction
in the Asia Pacific region in the past decades.
     In order to properly capture the performance of the quality of these net-
works, an air connectivity index could be developed to measure the importance
of a country or a city as a node within the regional or global air transport
system. An airport or a city is considered to be better connected if it has more
direct flight links or shortens waiting time in transfer to other nodes of the air
transport networks. In other words, a city’s or a country’s connectivity index
score will be higher if the time cost of moving people or cargoes is lower.
Hub-and-spoke networks have been an essential feature in most regional or
global air transport networks since the deregulation of the domestic American
air transport market in 1978. A spoke city, e.g., Wenzhou in China, Daegu
in Korea, etc., with a good connection to only a few cities will not have a
high connectivity score. However, a regional hub city, e.g, Guangzhou, Osaka,
etc. with a good connection to a moderate number of cities will receive an
intermediate connectivity score. A global hub city or country, e.g., Hong
Kong or Singapore, with strong connections to a large number of cities or
countries will receive high connectivity score. We aim at investigating the air
connectivity among APEC economies in the context of the global aviation
network.
     In Chapter 2, we shall discuss the NetScan model used for measuring the
air connectivity of APEC airports and regions. In Chapter 3, we will report
development and pattern of air connectivity of APEC economies and with
other regions. In Chapter 4, we will discuss strategies and policies on how
to enhance a seamlessly and comprehensively air connectivity among APEC
economies.
CHAPTER
                                                                    2
The NetScan Model

The NetScan model was first developed by Veldhuis (1997) for the mea-
surement of air connectivity, which was further developed and applied by
Burghouwt and R. (2013) for the study of the trans-Atlantic market. Boonekamp
and G. (2017) used the NetScan model to study air cargoes connectivity. The
NetScan model considers both direct and indirect connections from origin
airport A to destination airport B. The basic idea is to assign a quality-adjusted
index, ranging from zero to one, to every flight connection. This quality-
adjusted index measures the quality of relative travel time to every flight
connection. If the flight is a non-stop direct flight from airport A to airport B,
the index equals 1. If there are multiple stops and indirect flights from airport
A to airport B, the index will be less than 1. This is the case as a multi-stop
flight takes more time to arrive at airport B from airport A compared with a
non-stop flight. If the additional travel time of an indirect connection exceeds a
certain threshold, the index of connection equals zero. In general, the threshold
of a certain indirect connection between two airports depends on the travel
time of a theoretical direction between these two airports. Therefore, if the
theoretical direct travel time between two airports is longer, the maximum
indirect travel time will also be longer as well. For example, the maximum in-
direct travel time is three hours for a direct flight of an hour. On the other hand,
the maximum indirect travel time is 24 hours for a direct flight of 12 hours.
As a result, the total number of connections or connectivity units (CNUs) is
4                                            Chapter 2. The NetScan Model
derived from the product of the index and the frequency of the connection
per time unit e.g., day, week and year. The NetScan model consists of the
following equations:

       MAXT = (3 − 0.075∗NST ) ∗ NST                                       (2.1)

       PT T = FLY + (3 ∗ T RF)                                             (2.2)


                   PT T − NST
       QUAL = 1 −                                                          (2.3)
                  MAXT − NST

       CNU = QUAL ∗ FREQ                                                   (2.4)

where MAXT is the maximum perceived travel time, NST is the non-stop
travel time, PTT is perceived travel time, FLY is the flying time, TRF is
transfer time, QUAL is the index of an individual connection, FREQ is the
flight frequency, let say, per week and CNU is the number of connectivity units.
In case of a direct connection between airport A and B, PTT = NST as TRF =
0 and QUAL = 1 in equation (2.3). If the PTT reaches the maximum perceived
travel time, MAXT, QUAL=0 in equation (2.3). For any given airport, we sum
up all individual routes operating in that airport,
                 N
       CNU j = ∑ QUALi j ∗ FREQi j                                         (2.5)
                 i=1

      CNUs can also be interpreted as the number of quality-adjusted direct
flights from one airport to a specific destination. For a given country, we sum
up the CNUs of all airports to all destinations within that country to obtain the
CNU for that particular country.
      For our analysis below, we could employ the OAG database which consists
of flight information on March at a route level from 2008 to 2017. OAG is an air
travel intelligence company based in the United Kingdom. It provides digital
information and applications to the world’s airlines, airports, government
agencies and travel-related service companies. OAG is best known for its
airline schedules database which holds future and historical flight details for
more than 900 airlines and over 4,000 airports. OAG maintains an extensive
flight status and day-of-travel database in the aviation market and provides
analytical tools to assess air travel trends.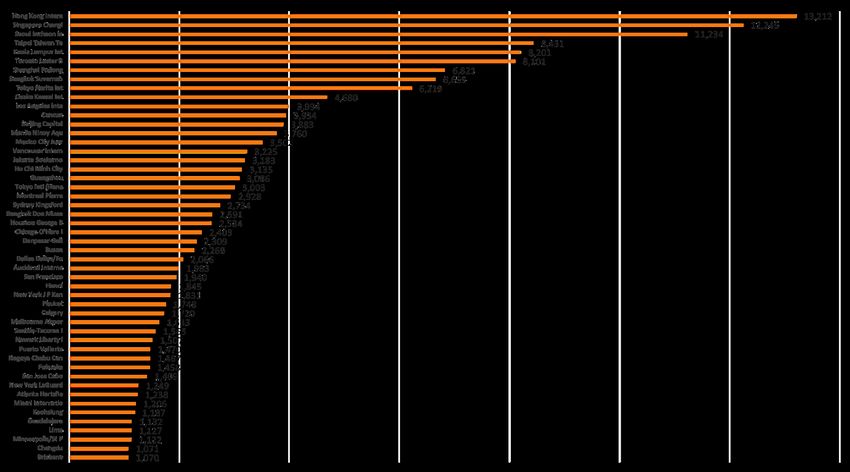
CHAPTER
                                                                        3
      Analysis of Air Connectivity of APEC

3.1   Connectivity of APEC Airports to APEC Destinations
      Let us consider the computed CNUs of airports, which is equivalent to the num-
      ber of quality-adjusted direct flights from an airport to a destination. Fig. 3.1
      reports Top 50 APEC airports to APEC destinations (excluding domestic
      flights) in March 2017. Hong Kong International Airport (HKIA) has the high-
      est score, 13,212, followed by Singapore with a score of 12,245 and Incheon
      Airport in Seoul, Korea, with a score of 11,234. The rest of top ten airports are
      Taoyuan Airport in Taipei (8,431), Kuala Lumpur Airport (8,201), Lester Pear-
      son Airport in Toronto (8,101), Shanghai Pudong Airport (6,821), Bangkok
      International Airport (6,655), Tokyo Narita Airport (6,219) and Osaka Kansai
      Airport (4,680). Interestingly, among these top ten airports, six of them are
      located in the North Asia region (among them three are in the Greater China
      region (China, Hong Kong and Taiwan)) and another three are located in the
      ASEAN region. Hong Kong and Singapore are the top performers as they fly
      to a large number of international airports and recorded very high scores.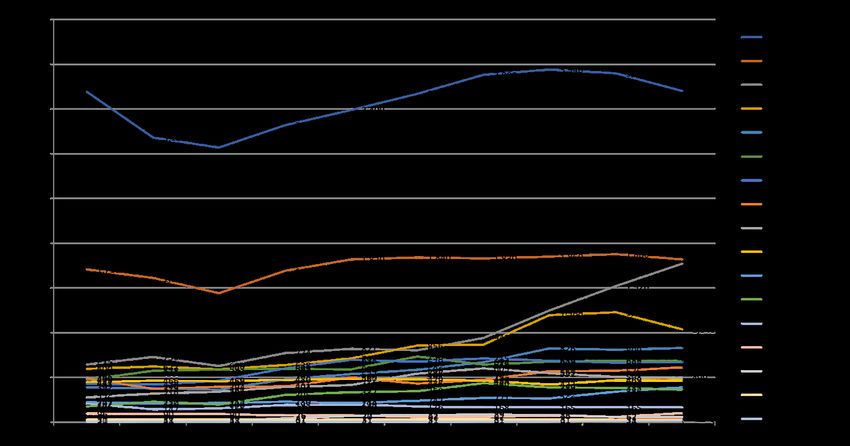
6
Figure 3.1 Top 50 APEC Airports to APEC Destinations
      (excluding domestic flights) in March 2017
                                                       Chapter 3. Analysis of Air Connectivity of APEC
Figure 3.2 Top 20 Selected APEC Airports (with positive growth rate) to APEC Destinations (excluding
domestic flights) from 2010 to 2017
3.1 Connectivity of APEC Airports to APEC Destinations
78 Chapter 3. Analysis of Air Connectivity of APEC
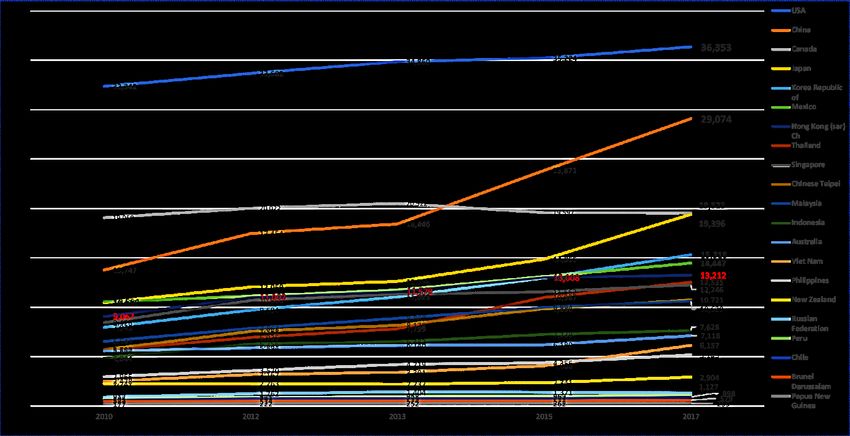
Fig. 3.2 reports the top 20 selected APEC airports (with positive growth)
to APEC destinations (excluding domestic flights) from 2010 to 2017. The top
5 airports all command relatively strong growth in their air connectivity scores,
especially for Singapore Airport and Incheon Airport whose scores ranked the
second and the third respectively. Kuala Lumpur Airport also performed well
as its score was more than doubled from 2010 to 2017. Similarly, the scores
of Osaka Kansai Airport in Japan, Ho Chi Minh City Airport in Vietnam and
Guangzhou Airport in China were also more than doubled from 2008 to 2017.
On the other hand, airports in North America had the lowest increases as the
aviation market in North America was saturating. Indeed, Chicago O’Hare
Airport experienced a decline during the same period. Among these top 20
airports, six of them are in the ASEAN region, five of them are in the Greater
China region and another five are in the North American Free Trade Area
(NAFTA) region (two in Canada, two in Mexico and one in the US).Figure 3.3 APEC Airports to APEC Destinations
(excluding domestic flights) by Departure Regions
3.1 Connectivity of APEC Airports to APEC Destinations
910
Figure 3.4 Top 20 APEC Airports (with positive growth) to APEC Destinations (including domestic flights)
from 2010 to 2017
Chapter 3. Analysis of Air Connectivity of APEC3.1 Connectivity of APEC Airports to APEC Destinations 11
Fig. 3.3 reports the APEC airports to APEC destinations (excluding do-
mestic flights) by departure regions. The US ranked the first and followed
by China, Canada and Japan. Most countries’ scores were increasing. China
expanded at the fastest rate, while the US increased at a slower rate. Canada
experienced no growth during the period. In addition, Japan expanded at a
relatively high rate as well.
Fig. 3.4 reports the top 20 APEC airports (with positive growth rate) to
APEC destinations (including domestic flights) from 2010 to 2017. Among the
top 20 APEC airports, 11 are from China and Hong Kong, and 7 are from the
ASEAN region. Fig. 3.5 reports the annual growth rate of CNUs from the Top
20 APEC airports to APEC destinations (including domestic flights) from 2008
to 2017. In terms of the growth rate, Bangkok Don Mueang Airport had the
highest rate (41.1%) and followed by Ho Chi Minh City (12.2%), Chongqing
Airport (10.3%), Xian Airport (9.8%) and Kunming Airport (9.4%). Miami
Airport had the lowest growth rate.
Fig. 3.4 and 3.5 also highlighted the outstanding performance of airports
in the ASEAN region. This may be due to the implementation of an Open
Sky Agreement among the ASEAN members and the rapid growth of low-cost
carriers in this region. The first stage of the ASEAN Open Sky Agreement was
implemented at the end of 2008, with full implementation since 1 Jan 2016.12
Figure 3.5 Annual Growth Rate of CNUs from the Top 20 APEC Airports to APEC Destinations (including
domestic flights)
from 2008 to 2017
Chapter 3. Analysis of Air Connectivity of APEC3.2 Connectivity of APEC Economies to APEC Destinations 13
3.2 Connectivity of APEC Economies to APEC Destinations
Fig. 3.6 reports the CNUs of APEC economies to APEC destinations based
on the country level air connectivity index for the whole period. The US and
China ranked the first and second respectively and followed by Canada and
Japan. These countries ranked high because they are having a large number of
airports connecting to various destination airports in the APEC region. Thus,
small countries such as Brunei and Papua New Guinea ranked at the bottom.14
Figure 3.6 APEC Departure Economies to APEC Destinations
(including domestic flights) in March 2017
Chapter 3. Analysis of Air Connectivity of APECFigure 3.7 APEC Departure Economies to APEC Destinations
(including domestic flights) from 2008 to 2017
3.2 Connectivity of APEC Economies to APEC Destinations
1516 Chapter 3. Analysis of Air Connectivity of APEC
Fig. 3.7 reports APEC departure economies to APEC destinations (in-
cluding domestic flights) from 2008 to 2017. Both the US and Canada were
declining over time while China and Japan were increasing. Most countries’
CNUs were increasing and China’s was increasing the fastest compared with
other countries. Both Fig. 3.6 and 3.7 showed that there had been an increasing
trend of air connectivity within the APEC region, especially within the East
Asian region.
Fig. 3.8 reports the CNUs of APEC economies to non-APEC destinations
in March 2017. Again, the US ranked the first and now Russia ranked the
second, followed by China, Thailand and Canada. The US is well connected to
European and South American destinations. Russia is also very well connected
to European destinations. However, New Zealand, Brunei and Papua New
Guinea ranked at the bottom. Fig. 3.9 reports APEC departure economies to
non-APEC destinations from 2008 to 2017. There was no growth for the US,
Russia and Canada, while China and Thailand were increasing at a much faster
rate. Other East Asian and ASEAN countries experienced growth as well.Figure 3.8 APEC Departure Economies to Non-APEC Destinations
in March 2017
3.2 Connectivity of APEC Economies to APEC Destinations
1718
Figure 3.9 APEC Departure Economies to Non-APEC Destinations from 2008 to 2017
Chapter 3. Analysis of Air Connectivity of APEC3.3 Connectivity of APEC Economies to Selected Continents 19
3.3 Connectivity of APEC Economies to Selected Conti-
nents
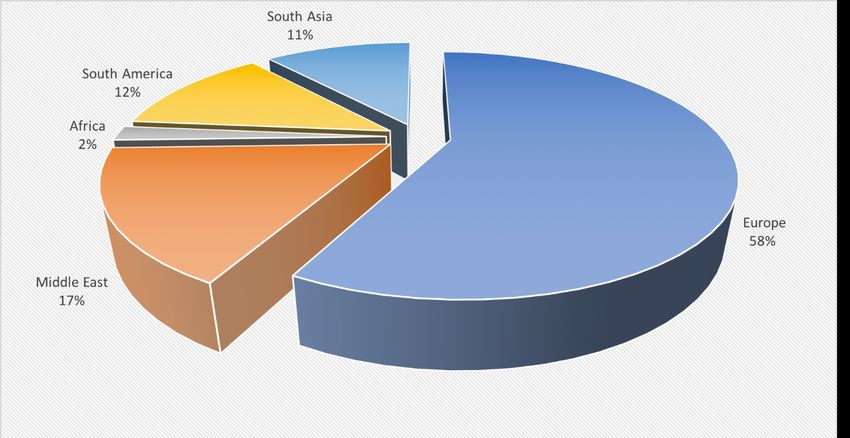
Fig. 3.10 reports the CNUs from APEC economies to selected continents,
including South Asia, South America, Africa, the Middle East and Europe.
About 58% of the destinations leaving from APEC were located in Europe.
17% of destinations were in the Middle East, 12% in South America and 11%
in South Asia.Figure 3.10 Non-APEC Destinations from APEC Economies
20
in March 2017
Chapter 3. Analysis of Air Connectivity of APEC3.4 Connectivity of Hong Kong 21
3.4 Connectivity of Hong Kong
Fig. 3.11 reports the distribution of destinations of CNUs from the Hong Kong
International Airport, among which 89% were within the APEC economies.Figure 3.11 Distribution of Destinations of CNUs from HKIA
22
Chapter 3. Analysis of Air Connectivity of APEC3.4 Connectivity of Hong Kong 23
Fig. 3.12 reports APEC destinations from HKIA from 2008 to 2017. China
ranked the top and followed by Chinese Taipei, Japan, Thailand, Korea and the
Philippines. The air connectivity to China first declined in 2008 then increased
again in 2010. There were some declines in recent years. However, the air
connectivity to Thailand was increasing rapidly in recent years.Figure 3.12 APEC Destinations from HKIA from 2008 to 2017
24
Chapter 3. Analysis of Air Connectivity of APEC3.4 Connectivity of Hong Kong 25
Fig. 3.13 reports the top 50 destination airports from Hong Kong Interna-
tional Airport. Taipei Taoyuan Airport, Shanghai Pudong Airport and Seoul
Incheon Airport were the top three destinations. They followed by Singapore
Changi Airport, Bangkok Airport and Beijing International Airport.26 Chapter 3. Analysis of Air Connectivity of APEC Figure 3.13 Top 50 Destination Airports from HKIA
3.5 Econometric Analysis—Connectivity and Economic Indicators               27
3.5   Econometric Analysis—Connectivity and Economic In-
      dicators
      By analysis the country level CNU in conjunction with data from the World
      Bank from 2008 to 2016, we are able to investigate the possible correlation
      of connectivity of a country with its economic indicators, such as GDP per
      capita and its growth rate, foreign direct investment, trade as a percentage
      of GDP and in particular high tech export as a percentage of manufactured
      goods. Also, other development indicators could include the penetration of
      mobile phone usage per 1,000 persons, and the number of tourist arrivals. The
      OAG dataset, along with the World Development Indicators (WDI) penal data,
      would consist of more than 1,600 observations for our analysis.
           The regression analyses reported in both Table 3.1 and 3.2 show the
      following results:
          i. Income is a significant determinant of the world CNUs, particularly
               for the middle income and low-income countries, as well as APEC.
          ii. FDI is a significant determinant of the world CNUs, particularly for
               the middle income and low-income countries, as well as APEC.
          iii. Mobile connectivity plays a significant role in the air connectivity in
               APEC.
          iv. Population size is a significant determinant of the world CNUs, partic-
               ularly for the high and middle-income countries, as well as OECD.
          v. Investment (capital formation) is a significant determinant of the air
               connectivity.
          vi. Tourism always has a significant correlation with the air connectivity.
Table 3.1 Correlation between CNU with
28
Selected Development Indicators
Chapter 3. Analysis of Air Connectivity of APEC3.5 Econometric Analysis—Connectivity and Economic Indicators 29 Table 3.2 The Determinants of Air Connectivity
CHAPTER
                                                               4
Policy Recommendations for APEC

 i.   Expanding airport capacity and related-infrastructures—For many of
      the APEC cities, the provision of aviation infrastructure (e.g., runways,
      passengers and freight terminals, road linkages, railways linking to
      greater catchment areas, etc.) has been very much behind the demand
      for aviation services. This is true for developing economies, as well as
      for developed economies. Better planning, coordination and exchange
      of experiences would be essential for the enhancement of connectivity
      within APEC and between APEC and non-APEC economies.
 ii. Achieving financing sustainability for aviation development—Improving
      air connectivity would require substantial financial resources. There
      are many funding sources to support the investment in aviation infras-
      tructure, including non-aeronautical revenue, passenger tax, foreign
      direct investment, bond financing, loan financing, etc. APEC is the
      appropriate platform for providing the expertise and sources for such
      funding support. For every APEC economy, a sustainable financing
      arrangement would be necessary for the healthy development of the
      aviation industry. A designated special fund could be established under
      APEC for the purpose as well.
 iii. Striving open skies liberalization—ASAs between respective APEC
      members are still restrictive to various extents, for different reasons.
      5th Freedom Rights have rarely been granted. In order to enhance air
32 Chapter 4. Policy Recommendations for APEC
connectivity, APEC should focus more on open skies liberalization
among APEC members.
iv. Deregulating the aviation industry—There have been many monopo-
listic and anti-competitive elements in the aviation industry, including
the domination of one major airline, unfair competition with foreign
airlines, unnecessary regulations against LCCs, direct and hidden sub-
sidies, a single supplier of certain airport services, etc. It is important
for every APEC member to review and de-regulate the aviation indus-
try, permitting a level playing field for new entrants and international
participants.
v. Assessing and providing aviation manpower—Based on ICAO’s as-
sessment on “NextGen Aviation Professionals”, there will be a severe
shortage of skilled personnel in the aviation industry in the next 20
years. The rapid development of aviation technology and the trend
of retirement are two of the major reasons. Developing countries, in
particular, would be in a disadvantageous position because of lacking
resources and expertise. This should be the responsibility of advanced
economies to provide the leadership for training and supplying the
aviation manpower within the APEC family.
vi. Enhancing airspace management—With rapid aviation development
within APEC, more airspace congestions and flight delays would result.
It is important to consider establishing a multinational institution, sim-
ilar to Eurocontrol in the EU, to rationalize the airspace management
within APEC.
vii. Introducing slot trading—There are many Level-3 airports in APEC,
with capacity constraints could not be mitigated, even in the long–term.
Slot trading could improve the operational efficiency of congested
airports. APEC, probably with the assistance of IATA, could provide a
platform for facilitating the introduction of slot trading in APEC.Bibliography APEC Policy Support Unit (2014). APEC Connectivity Blueprint. URL: www.apec.org/About-Us/Policy-Support-Unit. Arvis, J-F. and Shepherd, B. (2016). “Measuring connectivity in a globally networked industry: the case of air transport”. The World Economy, 39.3, 369–385. Boonekamp, T. and Burghouwt, G. (2017). “Measuring connectivity in the air freight industry”. Journal of Air Transport Management, 61, 81–94. Burghouwt, G. and Veldhuis, J. (2006). “The competitive position of hub airports in the transatlantic market”. Journal of Air Transportation, 11.1, 106–130. Burghouwt, G. and Redondi, R. (2013). “Connectivity in air transport networks: an assessment of models and applications”. Journal of Transport Economics and Policy (JTEP), 47.1, 35–53. Hummels, D.L. (2007). “Transportation costs and international trade in the second era of globalization”. Journal of Economic Perspectives, 21.3, 131–154. Veldhuis, J. (1997). “The competitive position of airline networks”. Journal of Air Transport Management, 3.4, 181–188. World Tourism Organization (2014). Air Connectivity and Its Impact on Tourism in Asia and The Pacific.
APEC Study Centre
 The Chinese University of Hong Kong

  Air Connectivity in APEC:
Development and Challenges
    This study aims at investigating the air connectivity
    among APEC economies and also in the context of the
    global aviation network. In the APEC Leaders’ 2013
    Declaration, APEC leaders affirmed their vision of
    reaching a seamlessly and comprehensively connected
    and integrated Asia-Pacific balanced on three pillars
    — physical connectivity, institutional connectivity and
    people-to-people connectivity. Further, in 2014, an
    APEC Connectivity Blueprint for 2015-2025 was
    developed to guide the region’s efforts to better integrate
    the region. The study will use the NetScan model to
    measure the connectivity of major airports of APEC
    economies in the period between 2009 and 2017. The
    results will show the changes in connectivity of the
    airports in the study period. Thus, the results may shed
    lights on the strategies and policies on how to establish a
    seamlessly and comprehensively connected aviation
    network among APEC economies.

    CUHK-APEC Study Centre, Economic Research Centre,
            Hong Kong Institute of Asia-Pacific Studies,
                 The Chinese University of Hong Kong
                          Email: econrc@cuhk.edu.hk
                 Web: www.cuhk.edu.hk/hk;aps/apecsc

                                                          CUHK-APEC Study Centre
                                                          Copyrights c 2018. All rights reserved.
You can also read