Original Article Identification and authentication of Eurycoma longifolia root extract from Zingiber officinale rhizome using FTIR spectroscopy ...
←
→
Page content transcription
If your browser does not render page correctly, please read the page content below
Original Article
Identification and authentication of Eurycoma longifolia root extract
from Zingiber officinale rhizome using FTIR spectroscopy and
chemometrics

Liling Triyasmono1*, Isni Munisa1 , Khoerul Anwar1, Totok Wianto2 and Heri Budi Santoso3
1Department of Pharmacy, Faculty of Mathematics and Natural Sciences, Lambung Mangkurat University,
Banjar Baru 70713, Indonesia
2Department of Phsyic, Faculty of Mathematics and Natural Sciences, Lambung Mangkurat University, Banjar

Baru 70713, Indonesia
3Department of Biology, Faculty of Mathematics and Natural Sciences, Lambung Mangkurat University, Banjar

Baru 70713, Indonesia
*Corresponding author: Liling Triyasmono | Email: liling2382imeru@gmail.com

Received: 1 Maret 2021; Revised: 19 Mei 2021; Accepted: 27 Juni 2021; Published: 28 Juli 2021

Abstract: Pasak bumi (Eurycoma longifolia) is one of the plants with androgenic effect having high price in the
herbal medicine market. This study was aimed to apply FTIR spectroscopy in combination with
chemometrics for identification and authentication of Eurycoma longifolia root extract (ELRE) from Zingiber
officinale rhizome (ZOR). Identification of ELRE was performed by determining the functional groups
responsible for infrared absorption, while the authentication of ELRE was carried out by measuring a mixture
of ELRE and ZOR with different concentrations (0-100% of ELRE) using FTIR spectroscopy combined with
principal component analysis (PCA) for classification between ELRE and ELRE adulterated with ZOR and
partial least square regression (PLSR) for quantification of adulterants. The results indicated that ELRE could
be identified at slected fingerprint wavenumbers of 1500 -1300 cm-1, by the presence of several functional
groups including O-H, C=O, C=C, C-O, and C-H. PCA could succesfully ELRE and ELRE adulterated with
ZOR with a total of 99% varations could be described by two principle componnets. In addition, PLSR using
second derivative spectra succesfully predict ZOR levels with coefficient of determination (R 2) of 0.993, root
mean square error of calibration of 2.563% and root mean square error of cross validation (RMSECV) of
5.057%. The combination of FTIR spectroscopy and chemometrics was an ideal method for identification and
authentication of ELRE adulterated with ZOR..

Keywords: authentication, Eurycoma longifolia, Zingiber officinale, FTIR spectroscopy, PLS,PCA

1. INTRODUCTION
     Pasak bumi (Eurycoma longifolia) is one of the plants found in Kalimantan which has an
androgenic effect [1]. The efficacy of E. longifolia root as an aphrodisiac is well known to public so
that its uses as a traditional medicine is growing [2]. In the market, E. longifolia powder is relatively
expensive so that it tends to be falsified with lower priced of herbal plants. Falsification can occur
by mixing E. longifolia with other ingredients such as ginger (Zingiber officinale). The product named
with "Pasak Bumi Plus Toga" revealed that Z. officinale extract is used as a mixture because it has
synergistic effect and relatively cheap. Red ginger (Z. officinale var. Rubrum) extract is less potential
as an aphrodisiac effect compared to E. Longifolia root extract [3]. Because of the expensive price of

Indonesian.J.Chemom.Pharm.Anal. 2021, 1(2), 70-78                               www.journal.ugm.ac.id/v3/IJCPA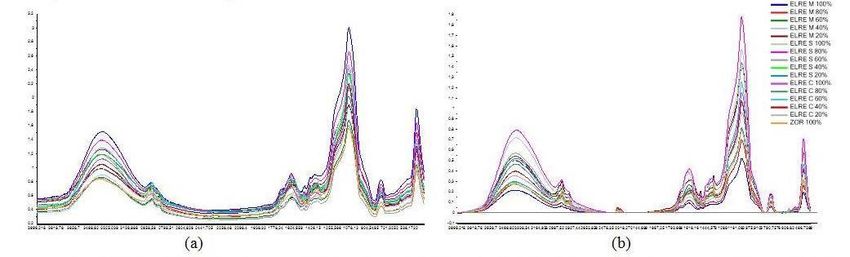
Indonesian.J.Chemom.Pharm.Anal. 2021, 1(2), 70-78                                                 71

E. longifolia roots in the market of herbal industries, manufacturers may substitute intentionally or
unintentionally with raw herbal materials with cheaper components [4].
     Adulteration of herbal medicines is a common practice to gain economical profits.
Adulteration poses a serious problem because it is related to the efficacy, safety, and quality of
products [5]. Therefore, it is very important to develop fast and reliable method to detect the
adulteration of herbal medicines. Several methods have been reported for authentication of E.
longifolia roots. The various conventional analytical techniques such as organoleptic, microscopic
and macroscopic analyses with their own advantages and disadvantages have been reported for
authentication of herbal components [6]. Instrumental methods used are High Resolution Melting
(HRM) analysis combined with DNA barcode [7], high performance liquid chromatography [8].
     FTIR spectroscopy, due to its property as fingerprint technique, can be an ideal method for
authentication of E. longifolia roots [9].     Combined with chemometrics, FTIR spectroscopy have
been used for the authentication of for authentication of Sedum sarmentosum bunge, S. lineare
Thunb., S. erythrostictum migo, and S. aizoon L [10], distinguishing of American and Asian
ginsengs from two morphological fakes [11], authentication of Radix astragali and authentication
Greek pennyroyal (Mentha punigeum L) samples according to their origin [12] and authentication of
Mentha pulegium L. (Pennyroyal) [13]. In this study, FTIR spectroscopy combined with
chemometrics for authentication of Eurycoma longifolia root extract (ELRE) from Zingiber officinale
rhizome.

2.   MATERIALS AND METHODS
     The samples of E. longifolia root used were obtained from 3 different places in Kalimantan,
namely Mandiangin Village in South Kalimantan Province, Sabuai Village in Central Kalimantan
Province and Condong Village in West Kalimantan Province. The rhizome samples of Z. officinale
variant Rubrum were obtained from Pengaron Village, South Kalimantan Province. The other
chemicals and solvents used were of pro-analytical grade.

2.1. Preparation of extract
      The samples was sorted wet and washed, then they was chopped and oven at temperature 60 oC
for E. longifolia root and 50 oC for the Z. officinale rhizome until their constant weight was obtained.
The dried samples was sorted dry and then smoothed and sieved through 25 mesh for E. longifolia
root and 40 mesh for Z. officinale rhizome [3,14-16]

2.2. Extract E Longifolia and Z officinalle
     A-150 grams of E. longifolia root powder of and 100 grams of Z. officinale rhizome powder
were macerated by 70% ethanol, their ratio 1:25 and 1:15 respectively for 3x24 hours. Then,
macerate was filtered by filter paper and concentrated by vacuum rotary evaporator at 60 °C and
then evaporated by water bath at 60 °C [17-18]. The thick extract was dried by aerosil with ratio (1:
0.8 and 1: 0.9) for E. longifolia root and (1: 0.5) for Z. officinale rhizome. Homogeneous extract
mixture and aerosil was oven at 50 °C for 1 hour until the extract was dried [19].

2.3. FTIR-ATR spectroscopic analysis
      A-50.0 mg of each extract mixture model was mixed with 950.0 mg of KBr powder for IR
crushed until homogeneous. The sample was analyzed by FTIR-ATR spectrophotometry at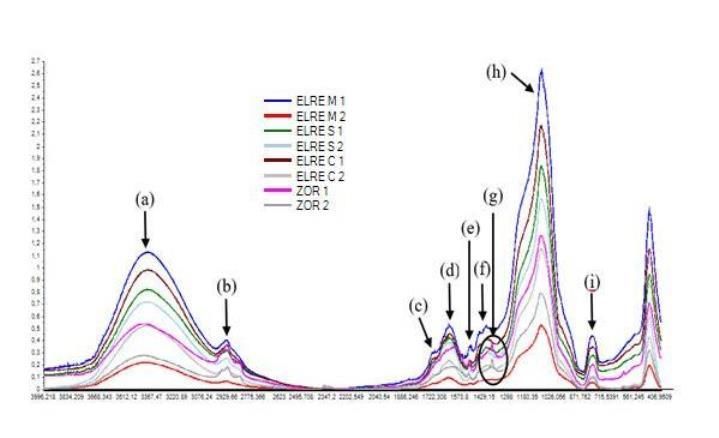
Indonesian.J.Chemom.Pharm.Anal. 2021, 1(2), 70-78                                                           72

wavenumber 4000-400 cm-1 with resolution of 2 cm-1 and 32 scans [20]. The quantification model
based on multilevel concentrations of 20,40,60,80 and 100%.

2.4. Data analysis
     Qualitative analysis based on spectra data interpretation, it observed absorption peaks in
spectra that referred the particular functional groups. Besides that, it also used Principal
Component Analysis (PCA) for data classification. [21-22]. The quantitative analysis used Partial
Least Square Regression (PLSR). The Validation data whereas the accuracy of the prediction model
for determined total flavonoid extract of Pasak Bumi root using PLSR was by the correlation value
and the RMSE value obtained. The total flavonoid prediction model can be used if the RMSEC and
RMSECV values are close to 0 and the R2 value is close to 1.

3. RESULTS AND DISCUSSION
3.1. Extraction of E.longifolia Root and Z. Officinale Rhizome
      Table 1 is the result of the extraction of E. longifolia from 3 regions namely Mandiangin, Sabuai
and Condong. This regional selection is based on a study of where to grow and empirically the
community uses it for traditional medicine.

                               Table 1. The extraction result of E. longifolia root

   Sample                         Powder (g)                  Extract (g)               Rendement (%)

   Mandiangin Village             150.0                       10.24                     6.82

   Sabuai Village                 150.0                       7.83                      5.22

   Condong Village                150.0                       7.88                      5.25

Extraction of 100 gram of Z. officinale rhizome powder obtained 3.8 gram thick extract with yield of
of 3.8%. The extract was dried by aerosil as an adsorbent. Aerosil was used because it only had
absorption at wavenumber region 970 cm-1 so that it would not interfere the absorptions in other
wavenumber regions [23]. The results of dry extract can be seen in Table 2.

                          Table 2. The results of E. Longifolia dried root extract

     Sample                     Thick extract (g)    Aerosil (g)      Dry extract (g)   Water Content (%)

     Mandiangin Village         6.50                 5.80             11.14             0

     Sabuai Village             6.38                 5.10             10.90             0

     Condong Village            6.16                 4.93             10.87             0

The Z. officinale dried rhizome extract was obtained 5.062 gram. The dried extract produced in the
form of fine powder with brown color that is brighter, smells typical and tastes bitter.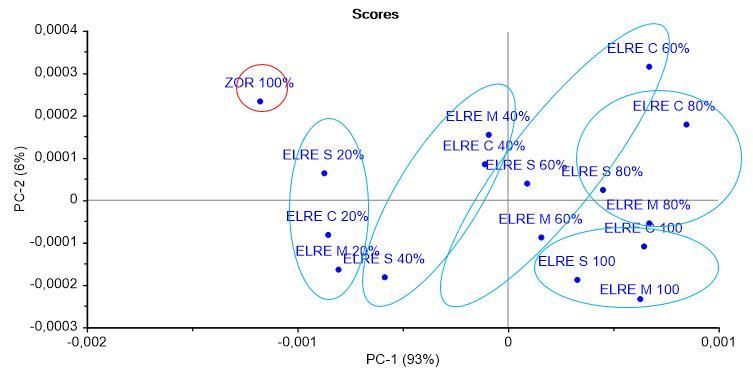
Indonesian.J.Chemom.Pharm.Anal. 2021, 1(2), 70-78                                                            73

3.2. Analysis of Extracts by FTIR Spectrophotometry
     FTIR spectra were scanned at the mid-infrared region corresponding to wavenumber range of
4000-400 cm-1. The results of FTIR spectra of E. longifolia root and Z. officinale rhizome extract were
shown in Figure 1.

Figure 1.    FTIR spectra of E. longifolia root and Z.officinale rhizome extracts (a) at wavenumber 4000-400 cm-1
             E. longifolia (ELRE) from Mandiangin Village 1st and 2nd replications, 1 and 2: E. longifolia (ELRE)
             from Sabuai Village 1st and 2nd replications, 1 and 2: E. longifolia (ELRE) from Condong Village 1st
             and 2nd replications, and J 1 and 2 : Z. officinale (ZOR) 1st and 2nd replications.

The absorption peaks corresponding to functional groups responsible for the presence of specipic
components at certain wavenumbers can be seen in Table 3.

   Table 3. The functional groups from FTIR spectra of E. longifolia root and Z. officinale rhizome extract [24]

  Codes                         E. longifolia                                  Z. officinale           Vibration
                                                                                                          type
                 Frequency (cm ) -1     Functional group         Frequency (cm )   -1     Functional
                                                                                               group
    (a)                3392                     O-H                     3419                   O-H        Free
    (b)                2931                     C-H2                    2928                   C-H2     Stretch
    (c)                1733                     C=O                     1710                   C=O      Stretch
    (d)                1635                     C=C                     1603                   C=C      Stretch
 (e) & (f)         1418 & 1518                  C-H2                    1518                   C-H2      Bend
    (g)                1397                     C-H3                    1385                   C-H3      Bend
    (h)                1097                     C-O                     1099                   C-O      Stretch
    (i)                 798                     C-H                      798                   C-H       Bend

     The difference between the E. longifolia root and Z. officinale rhizome extracts could be
observed at peak (g) due to CH3 bending vibration. The absorption intensity of the Z. officinale
rhizome spectra was stronger than the E. longifolia root spectra. Both extracts had the same
Indonesian.J.Chemom.Pharm.Anal. 2021, 1(2), 70-78 74
functional groups but their absorption peaks had different intensities and exact wavenumbers. This
difference was influenced by atomic masses and the bond between atoms according to Hookes' law
[24]. The wavenumber regions of 1500-1300 cm-1 was included in the fingerprint region. Each
compound had different pattern in this region, therefore it was difficult to analyze the bond types
because its absorption was usually very complex. This wavenumber region also had a lot of
bending vibration of methyl groups (-CH3) and methylene groups (-CH2) [25]. Based on the
chemical structure of eurycomanone, an active compound present in E. Longifolia had more methyl
and methylene groups than the other components. It might also affect the absorption intensity
result as intensity is directly proportional with the concentration of functional groups.
3.3. Principal component analysis of FTIR spectra of extracts
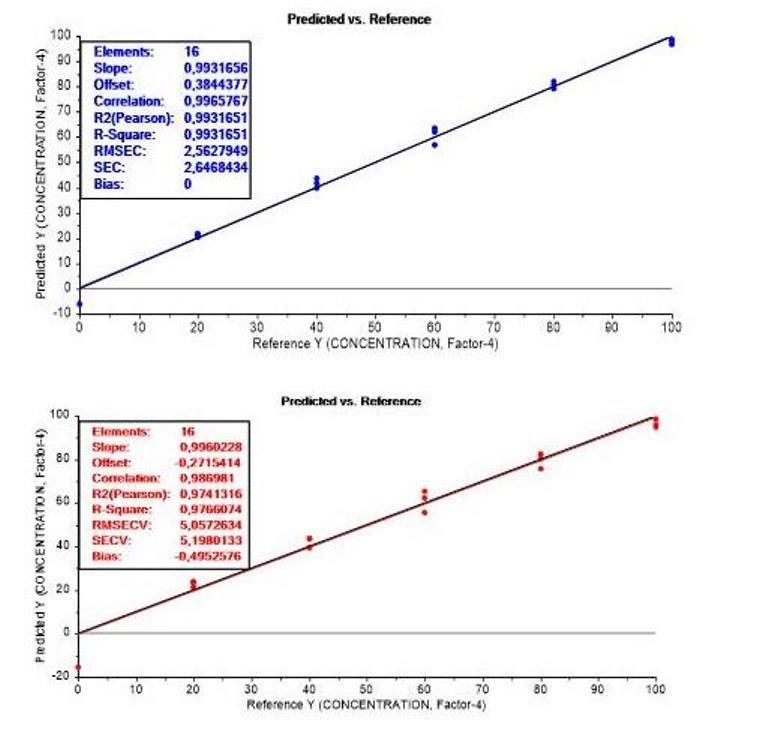
The combined spectra of series concentrations of evaluated samles at wavenumber range of
4000-400 cm-1 using 1st and 2nd were shown in Figure 2. Optimization of wavenumber regions in
PCA analysis using 1st and 2nd derivatves could be be seen in Table 4. The selected segment
optimization was R2 segmentation spectra data with preliminary process because there was
distinctly difference between the spectra of E. longifolia root and Z. officinale rhizome extracts [23].
The result of score plot in this segment could also clearly classify among pure of E. longifolia root
and Z. officinale rhizome extracts and their mixed extracts. Their plot score results can be seen in
Figure 3.
Figure 2. FTIR spectra mixed between E. longifolia root and Z. officinale rhizome extracts with level
concentration (0-100%) at wavenumber range 400-4000 cm-1 (a) 1st replication (b) 2nd replication
3.4. Analysis using partial least square calibration
Determination of the contents of E. longifolia root and Z. officinale rhizome extracts in the mixture
based on the wavenumber range which had best separation and high total variation from the PCA
analysis result, it was R2 segmentation spectral data with preliminary process [26]. The combined
spectra of the concentration series in the characteristic wavenumber (1500-1300 cm-1) can be seen in
Figure 4.Indonesian.J.Chemom.Pharm.Anal. 2021, 1(2), 70-78 75
Figure 3. Score plot PCA R2 on level concentration (0-100%) at wavenumber 1500-1300 cm-1 with preliminary
process
Figure 4. FTIR spectra mixed extract of E. longifolia root with Z. officinale rhizome with level concentration
(0-100%) at wavenumber region 1500-1300 cm-1. (a) normal spectra, (b) spectra with preliminary
process (B and N), (c) spectra derivative 1, (d) spectra of derivative 2 (B dan N)
The results of the PLSR calibration and validation model between normal spectra, with the
preliminary process, and derivative spectra can be seen in Table 5. The model selected in this studyIndonesian.J.Chemom.Pharm.Anal. 2021, 1(2), 70-78 76
was derivative spectra 2 because it had higher R2 value calibration and lower RMSEC and RMSECV
values compared to other spectral models [21,27]. The relationship graph between the reference
value (x-axis) and predictited value (y-axis) extract of E. longifolia root and Z. officinale rhizome
based on calibration and validation analysis sample can be seen in Figure 5.
The model obtained in this study was the calibration model y = 0.993x + 0.384 with R 2 of 0.993
and the RMSEC of 2.563. Validation based on the calibration model was obtained by cross
validation method. It result was obtained y = 0.996x - 0.272 with R2 of 0.977 and the RMSECV of
5.057. According to [28-29] calibration model can be accepted if R2 was greater than 0.99. The
smaller the RMSEC and RMSECV values obtained from model, indicated the less error.
Figure 5. The partial least square regression (PLSR) which model correlates between reference with predicted
value in mixture E. longifolia root extract with Z. officinale rhizome extracts using derivative spectra 2
at wavenumber range (1500-1300 cm-1) (a) calibration (b) validation.
4. CONCLUSION
Identification of infrared spectrum pattern of E. longifolia root extract obtained functional
groups O-H (3392 cm-1), C=O (1733 cm-1), C=C (1635 cm-1), C-O (1097 cm-1), C-H stretch (2931 cm-1)
and C-H bend (1418 cm-1 dan 798 cm-1). The FTIR spectrophotometry combined with chemometrics
at wavenumber region 1500-1300 cm-1 is able to classify the mixture of E. longifolia and Z. officinale
root extracts with total score of 99% PC and can be used for their mixture authentication. The model
is obtained y = 0.993x + 0.384 with R2 of 0.993 and the RMSEC of 2.563 and RMSECV of 5.057.Indonesian.J.Chemom.Pharm.Anal. 2021, 1(2), 70-78 77
Funding: This research was funded by Ministry Research Technology and Higher Education
Republic of Indonesia, for funding PTUPT 2018.
Acknowledgments: The authors would like to thank Ministry of Technology and Higher Education
Republic of Indonesia (Kemenristekdikti) for funding PTUPT 2018 this research, LPPT UGM
Conflicts of interest: The authors declare no conflict of interest
References
1. Bogar, B.C.A.; Tendean, L.; Turalaki, G.L.A. Pengaruh Pemberian Ekstrak Pasak Bumi (Eurycoma longifolia
Jack.) Terhadap Kualitas Spermatozoa Tikus Wistar (Rattus norvegicus). Jurnal e-Biomedik (eBm), 2016, 4,
205-209.
2. Siburian, J.; Marlinza, R. Efek Pemberian Ekstrak Akar Pasak Bumi (Eurycoma longifolia Jack.)
pada Tahap Prakopulasi Terhadap Fertilitas Mencit (Mus musculus L.) Betina. Biospesies, 2009, 2, 24-30
3. Anandita, D.W.; Nurlaila.; Pramono, S. Pengaruh Minyak Atsiri dan Ekstrak Etanolik Bebas Minyak Atsiri
dari Rimpang Jahe Merah (Zingiber officibake Rosc. klon merah) Terhadap Efek Aprodisiaka pada Tikus
Jantan. Majalah Obat Tradisional, 2012, 17, 8-14.
4. Bhat, R.; Karim, A.A. Tongkat Ali (Eurycoma longifolia Jack): A review on its ethnobotany and
pharmacological importance. Fitoterapia, 2010, 81, 669–679.
5. Mok, D.K.W.; Chau, F.T. Chemical information of Chinese medicine: a challenge to chemist. Chemometrics
and Intelligent Laboratory Systems, 2006, 82, 210-217.
6. Smillie T.; Khan I. A comprehensive approach to identifying and authenticating botanical products. Clin
Pharmacol Ther, 2010, 87, 175–186.
7. Nur Fadhila Fadzil .; Alina Wagiran.; Faezah Mohd Salleh.; Shamsiah Abdullah.; Nur Hazwani Mohd
Izham. Authenticity Testing and Detection of Eurycoma longifolia in Commercial Herbal Products Using
Bar-High Resolution Melting Analysis. Genes, 2018, 9, 408.
8. Bashir Mohammed Abubakar.; Faezah Mohd Salleh.; Mohd Shahir Shamsir Omar.; Alina Wagiran
Assessing product adulteration of Eurycomalongifolia (Tongkat Ali) herbal medicinal product using DNA
barcoding and HPLC analysis, Pharmaceutical Biology, 2018, 56:1, 368-377.
9. Irfanita, N.; Jaswir, I.; Mirghani, M.E.S.; Sukmasari, S.; Ardini, Y.D.; Lestari, W. Rapid Detection of Gelatin
in Dental Materials Using Attenuated Total Reflection Transform Infrared Spectroscopy (ATR-FTIR).
Journal of Physics, Conference Series, 2017.
10. Xu, R.; Chen, Y.; Wan, D.; Wang, J. Identification of four Sedum plant medicines by Fourier transform
infrared spectra. Pharmacogn. Mag., 2012, 8 (30), 107–110.
11. Yap, K.Y.-L.; Chan, S.Y.; and Sing Lim, C.S. Infrared-based protocol for the identification and
categorization of ginseng and its products. Food Res. Int., 2007, 40, 643–652.
12. Zhang, L.; Nie, L. Discrimination of geographical origin and adulteration of Radix astragali using Fourier
transform infrared spectroscopy and chemometric methods. Phytochem. Anal., 2010, 21 (6), 609–615.
13. Kanakis, C.D.; Petrakis, E.A.; Kimbaris, A.C.; Pappas, C.; Tarantilis, P.A.; Polissiou, M.G. Classification of
Greek Mentha pulegium L. (Pennyroyal) samples, according to geographical location by Fourier transform
infrared spectroscopy. Phytochem. Anal., 2012, 23 (1), 34–43.
14. Najmuldeen, G.F.; Fatmanathan, H.; Faisal, G.G.; Hassan, Z. Characterization of Eurycoma longifolia
(Tongkat Ali) Essential Oils Extracted by Microwave Assisted Extraction. Journal of Applied
Pharmaceutical Science, 2017, 7, 62-68.
15. Supriyanto.; Cahyono, B. Perbandingan Kandungan Minyak Atsiri Antara Jahe Segar dan Jahe Kering.
Chem. Prog, 2012; 5, 81-85.
16. Sunaryo, H.; Siska, Dwitiyanti.; Arcinthya R. Kombinasi Ekstrak Etanol Rimpang Zingiber officinale Roscoe
dengan Zn Sebagai Hipolipidemia pada Mencit Diabetik Diet Tinggi Kolesterol. Media Farmasi, 2014, 11,
62-72.
17. Varghese, C.P.; Ambrose, C.; Jin, S.C.; Lim, Y.J.; Keisaban, T. Antioxidant and Anti-inflamatory Activity of
Eurycoma longifolia Jack. A Traditional Medicinal Plant ini Malaysia. International Journal of Pharmaceutical
Sciences and Nanotechnology, 2013, 5, 1875-1878.
18. Novianti, S. Pemberian Ekstrak Etanol Akar Pasak Bumi (Eurycoma longifolia) Secara Oral dapat
Meningkatkan Kadar Hormon Testosteron pada Tikus (Rattus norvegicus) Wistar Jantan Tua. Denpasar:
Tesis Program Pasca Sarjana, Universitas Udayana, 2015Indonesian.J.Chemom.Pharm.Anal. 2021, 1(2), 70-78 78
19. Saputra, A. Formulasi Kapsul Ekstrak Etanol Daun Alpukat (Persea Americana Mill). Menggunakan
Aerosil dan Magnesium Karbonat Sebagai Pengering. Skripsi Program Studi Farmasi, Fakultas
Matematika dan Ilmu Pengetahuan Alam, Universitas Indonesia, 2012.
20. Triyasmono, L.; Noor Cahaya1.; DodonTurianto.; Heri Budi Santoso.; Abdul Rohman. Application of FTIR
Spectroscopy and Chemometrics PLSR Of the Determination of Total Flavonoid of Kalimantan’s Kasturi
(Mangifera casturi). RJPBCS, 8(3), 855-858.
21. Rohman, A.; Che Man, Y.B. Analysis of Lard in Cream Cosmetics Formulation Using FTIR spectroscopy
and chemometrics. Middle-East J.Sci. Res, 2011, 7, 726-732.
22. Terouzi, W.; Oussama, A. Evaluation of Ginger Adulteration with Beans Using Attenuated Total
Reflectance Fourier Transform Infrared Spectroscopy and Multivariate Analysis. International Journal of
Engineering and Applied Sciences (IJEAS), 2016, 3, 42-46.
23. Wulandari, L.; Retnaningtyas, Y.; Nuri.; Lukman, H. Analysis of Flavonoid in Medicinal Plant Extract
Using Infrared Spectroscopy and Chemometrics. Journal of Analytical Methods in Chemistry, 2016, 1-6.
24. Rohman, A. Spektroskopi Vibrasional Teori dan Aplikasinya untuk Analisis Farmasi. Yogyakarta: Gadjah Mada
University Press, 2014.
25. Adib MA.; Abdullah Z. Rapid discrimination of Eurycoma longifolia extractc by Fourier Transform infrared
spectroscopy and two dimensional correlation infrared spectroscopy. Vibrational Spectroscopy, 2018, 96, 1-9.
26. Siregar, Y.D.I.; Heryanto, R.; Riyadhi, A.; Lestari, T.H.; Nurlela. Karakterisasi Karbon Aktif Asal
Tumbuhan dan Tulang Hewan Menggunakan FTIR dan Analisis Kemometrika. Jurnal Kimia Valensi: Jurnal
Penelitian dan Pengembangan Ilmu Kimia, 2015, 1, 103-116.
27. Miller, J.N.; Miller, J.C. Statistics and Chemometrics for Analytical Chemistry sixth edition.. England: Person
Education Limited, 2010.
28. Head, J.; Kinyanjui, J.; Talbott, M. FTIR-ATR Characterization of Commercial Honey Samples and Their
Adulteration with Sugar Syrups Using Chemometric Analysis. Shimadzu Excellence in Science, 2015.
29. Rohman, A.; Sismindari.; Erwanto, Y.; Man, Y.B.C. Analysis of Pork Adulteration in Beef Meatball Using
Fourier Transform Infrared (FTIR) Spectroscopy. Meat Science, 2011, 88, 91-95.
© 2021 by the authors. Submitted for possible open access publication under the terms
and conditions of the Creative Commons Attribution (CC BY) license
(http://creativecommons.org/licenses/by/4.0/).You can also read