Validity and reliability of the Turkish version of the self-perceived food literacy scale
←
→
Page content transcription
If your browser does not render page correctly, please read the page content below
Progress in Nutrition 2020; Vol. 22, N. 2: 671-677		    DOI: 10.23751/pn.v22i2.9662				                           © Mattioli 1885

                                                       Orignal article

      Validity and reliability of the Turkish version of the self-
      perceived food literacy scale
      Kevser Tarı Selçuk1, Celalettin Çevik2, Hakan Baydur3, Reci Meseri4
      1
       Bandirma Onyedi Eylul University Faculty of Health Sciences, Department of Nutrition and Dietetics, Bandirma, Balikesir,
      Turkey - E-mail: kevser_tari@hotmail.com; 2Balıkesir University Faculty of Health Sciences, Nursing Department Balikesir,
      Turkey; 3Celal Bayar University Faculty of Health Sciences, Social Work Department, Manisa Turkey; 4Ege University Faculty
      of Health Sciences, Department of Nutrition and Dietetics, İzmir, Turkey

      Summary. Purpose: The present study was aimed at adapting the Self-Perceived Food Literacy Scale into
      Turkish and investigating its psychometric properties. Methods: This study was conducted with 391 adults
      aged ≥18 years living in a provincial center. This five-point likert scale consists of 29 items and 8 sub-scales.
      In the analysis of the study data, cronbach’s alpha values, ıntraclass correlation coefficient and item-total and
      inter-scale correlation coefficients were calculated, and the confirmatory factor analysis and linear regression
      analysis were performed. Results: The cronbach’s alpha value was 0.84, 0.70, 0.76, 0.61, 0.89, 0.69, 0.90, 0.92
      for the subscales respectively (food preparation skills, resilience and resistance, healthy snack styles, social
      and conscious eating, examining food labels, daily food planning, healthy budgeting, healthy food stockpil-
      ing) and 0.83 for the overall scale. The test-retest intraclass correlation coefficient is between 0.80 and 0.96.
      The goodness of fit values of the confirmatory factor analysis are between 0.062-0.93. Conclusion: The Self-
      Perceived Food Literacy Scale adapted to Turkish society is a valid and reliable scale.

      Key Words: literacy, food literacy, validitiy, reliability

Introduction                                                       between food literacy and dietary quality and health
                                                                   outcomes might stem from the lack of measurement
     Food literacy defined by Vidgen and Gallegos                  tools used to measure food literacy (5-7).
as “the scaffolding that empowers individuals, house-                    Although improvement of the nutritional status
holds, communities or nations to protect diet quality              of the general population is the leading target of the
through change and strengthens dietary resilience over             health policy in Turkey, there are a limited number of
time” (1) is a platform that supports the development              studies on food literacy (8, 9). There are measurement
and maintenance of healthy eating behaviors (2). In                tools focusing on nutritional knowledge and nutrition
other words, food literacy is expressed as “a set of in-           literacy level in Turkey (10,11). In addition, in Turkey,
terrelated skills and abilities that are key to properly           there is one study in which the reliability and validity
planning, managing, selecting, preparing and eating                of the short-form of the one-dimensional food literacy
food in order to achieve a balanced diet and to improve            questionnaire was tested with university students (12)
psycho-physical well-being” (3). In a limited number               but there is no comprehensive measurement tool used
of studies conducted on the issue, high food literacy is           to assess food literacy adapted to Turkish in the com-
shown to be related to healthy dietary behaviors such              munity sample. Self-Perceived Food Literacy (SPFL)
as consuming vegetables and fruits, but avoiding con-              Scale was developed by Poelman et al. in 2018 in order
suming fast food meals, sugar-sweetened drinks and                 to determine individuals’ food literacy levels including
salt (3,4). In addition, it is reported that the limited           knowledge, skills and behavior to plan, manage, select,
number of studies aimed at revealing the relationship              prepare and eat food healthily (13).
672 K. T. Selçuk, C. Çevik, H. Baydur, et al.
Unhealthy diet is the main cause of a significant SPFL Scale, Barratt Impulsiveness Scale Short Form
proportion of deaths related to chronic diseases (14) and (BIS-11-SF), and Brief Self-Control Scale (BSCS)
interventions aimed at gaining society healthy dietary through face-to-face interviews.
habits are considered as one of the priority attempts to The SPFL Scale consists of 29 items in the follow-
reduce the burden of chronic diseases (5). In addition, ing 8 subscales: food preparation skills, resilience and
in the literature, it is stated that food literacy is one of resistance, healthy snack styles, social and conscious eat-
the most important dimensions used to assess the ef- ing, examining food labels, daily food planning, healthy
fectiveness of public health nutrition policy interven- budgeting and healthy food stockpiling. The items are
tions (3). Adapting the SPFL Scale, which enables the rated on a five-point likert type scale. The sum of the
assessment of the food literacy level of the society, to scores obtained from all the items of the scale shows
Turkish is important in terms of its use in the planning the level of SPFL and the higher the score is the higher
and assessment of public health nutrition interventions level of food literacy is. Cronbach alpha coefficient is re-
aimed at gaining the society healthy diet habits. ported 0.83 for the overal scale and between 0.58-0.90
The present study was aimed at adapting the for the subscales (13). Adaptation of the SPFL scale
SPFL Scale into Turkish and investigating its psycho- into Turkish language was performed by implementing
metric properties. standardized international methods (15).
The BIS-11-SF was developed by Patton et al. in
1995 (16) to assess impulsiveness and it was adapted to
Methods Turkish by Tamam et al. in 2013. The scale consists of 15
items in the 3 subscales (non planning, motor impulsivity
Study design and sample and attention impulsivity). The items are rated on a four-
This methodological study was conducted in point likert type scale. The higher the score is the higher
Balıkesir, a province in northwestern Turkey. The sam- level of impulsiveness (Cronbach’s alpha=0.83) (17).
ple size of the study was planned to be at least ten fold The BSCS was developed by Tangney et al. in
the number of the items in the scale. The population 2004 (18) and it was adapted to Turkish by Nebioğlu
of the study consists of ≥18 year-old adults living in a et al. in 2012. This scale is the single-factor self-report
neighborhood in the city center of Balıkesir. To deter- scale. The items are rated on a five-point likert type
mine the research group in the cluster sampling meth- scale. The higher the score is the higher level of self-
od, the streets in the neighborhood were accepted as control is (Cronbach’s alpha=0.87). (19).
clusters, and 391 adults aged 18 and over, who were
living in four randomly selected streets, had the cogni- Statistical analysis
tive competence to answer the questions and agreed to The floor and ceiling effects of the subscale scores
participate in the study were included in the study. Of were calculated. In the reliability analysis, the Cron-
the participants of the study, thirty selected randomly bach’s alpha values were calculated which is the inter-
were given a retest two weeks after data collection. nal consistency coefficient of the scores for the overall
scale and its subscales (20). Intraclass Correlation Co-
Data collection tools efficients (ICC) obtained from the test-retest analysis
Prior to data collection, ethical approval was re- performed for each subscale and the overall scale used
ceived from Balıkesir University Clinical Research as an indicator of the stability of the scale over time
Ethics Committee (Decision date and no: 30.01.2019- were also given in results section (20).
2019/17). The present study followed the principles In the validity analysis, Confirmatory Factor Anal-
outlined in the Declaration of Helsinki for Human ysis (CFA), convergent-divergent validity and discri-
Studies. The study data were collected using the Per- minant validity were investigated. Because the present
sonal Information Form developed by the researchers study is a scale adaptation study, it was only tested to
based on the relevant literature and questioning the so- what extent the existing structure produced was com-
ciodemographic and dietary habits of the participant, patible with the conceptual structure. To achieve this,Validity and reliability of the Turkish version of the self-perceived food literacy scale 673
the CFA was performed. After the analysis, the error Results
variance of each item and the item-subscale coefficient
were investigated and of the CFA results, the Root Mean Descriptive characteristics of the participants
Square Error of Approximation (RMSEA), Compara- The mean age of the participants was 36.9±15.1.
tive Fit Index (CFI), Standardized Root Mean Square Of the participants, 7.0% were in the 18-34 age group,
Residuals (SRMR) and Chi square/degree of freedom 50.6% were women, 47.3% were married, 46.8% were
(χ2/df ) were given in results section. The correlation co- university graduates, 46.3 worked at a paid job, and
efficient between the subscales of the SPFL Scale and 59.6% had a moderate income. The average height, body
correlation coefficients for the BSCS and BIS-11-SF weight and BMI of the participants was 169.3±9.4cm.
were examined for the convergent and divergent validity (min:150, max:198cm.), 72.4±13.9kg (min:40, max:120
(20). While correlation coefficients whose magnitude kg.), 25.2±4.3kg/m2 (min:15.0, max:37.2kg/m2) respec-
ranged between 0.10 and 0.30 were accepted to have tively. According to their statements, of the participants,
low correlation and those between 0.31 and 0.50 to have 28.6% had a low physical activity, 40.2% were smok-
moderate correlation, and correlation coefficients whose ers, 19.2% drank alcohol, 65.5% mostly ate white bread,
magnitude was ≥0.51 were accepted to have high cor- 51.2% mostly consumed olive oil, and 17.1% and 35.3%
relation (21). Of the indicators of healthy eating, lev- did not consume fruits or vegetables respectively.
els of fruit and vegetable consumption, type of bread
consumed, salt use, the number of main meals, adding Reliability analysis
salt to food without tasting, drinking tea with sugar, The ceiling effects was 17.4%, 24.3% and 27.9%
smoking and alcohol consumption were compared with for the social and conscious eating, healthy budgeting
the mean score obtained from the SPFL Scale. In this and healthy food stockpiling subscales respectively.
comparison, the univariate analysis and multivariate lin- The floor effects was 27.4% for the examining food
ear regression analysis adjusted for age, sex, educational labels subscale. Both the floor and ceiling effect was
status, Body Mass Index (BMI), BIS-11-SF and BSCS less than 15.0% for the other subscales and the overall
were used. The results obtained were given both with scale. The Cronbach’s alpha value between were 0.61
Beta coefficients and significance levels, and with effect to 0.92 in the subscales, and 0.83 for the overall scale.
sizes (21). The ICC analysis results for the test-retest consistency
Analysis of the descriptive characteristics, reli- of the scale between were 0.80 to 0.96 (Table 1).
ability and validity analysis were performed in the
SPSS 25.0 and Stata 14 statistics programs, the CFA Validity analysis
employed to confirm construct validity was performed According to the results of the CFA, the scale has
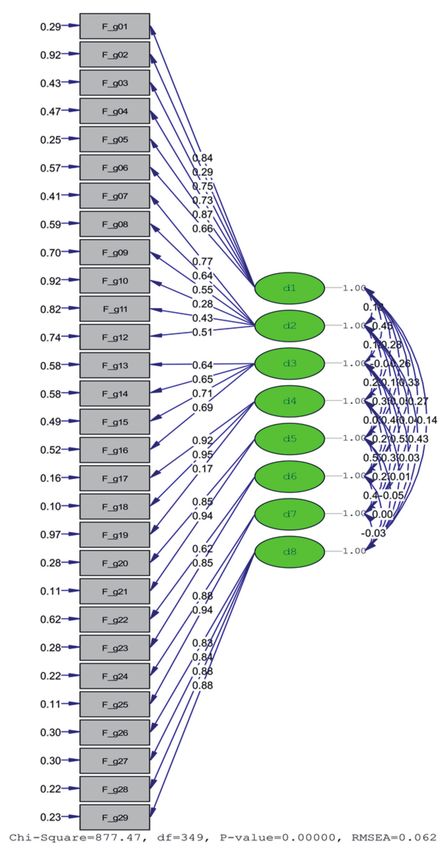
in the LISREL 9.1 program. an acceptable level of fit (χ2/df=2.51). In addition, the
Table 1. Reliability analysis results of the SPFL Scale
Subscales Floor % Ceiling % Cronbach’s Alfa ICC
1.Food preparation skills 0.8 7.4 0.84 0.95
2.Resilience and resistance 1.5 0.8 0.70 0.96
3.Healthy snack styles 2.3 7.9 0.76 0.94
4.Social and conscious eating 0.8 17.4 0.61 0.85
5.Examining food labels 27.4 9.2 0.89 0.86
6.Daily food planning 10.5 14.1 0.69 0.87
7.Healthy budgeting 9.0 24.3 0.90 0.89
8.Healthy food stockpiling 3.6 27.9 0.92 0.80
Overall scale 0.3 0.0 0.83 0.95
ICC: Intraclass Correlation Coefficients.674 K. T. Selçuk, C. Çevik, H. Baydur, et al.
RMSEA value (RMSEA=0.062), an indicator of the the lowest correlation (0.309). While the correlation
approximation error levels of a measurement model, between the SPFL scale and BIS-11-SF was negative
was within acceptable limits. The CFI (CFI=0.93) was (r=-0.437), the correlation between the SPFL scale
within acceptable limits. The SRMR value was 0.069. and BSCS was positive (r=0.427) (Table 2).
Error variances and factor loads were extreme in some The analysis of the variables affecting the total
items (Figure 1). SPFL Scale score revealed that there was a signifi-
The correlation between the subscales and the cant correlation between the total SPFL Scale score
overall SPFL Scale ranged from moderate to high. and the BIS-11-SF score, BSCS score, low physical
While the food preparation skills subscale had the activity, obesity and unhealthy diet habits (pValidity and reliability of the Turkish version of the self-perceived food literacy scale 675
Table 3. Discriminant validity analysis results of the SPFL Scale
Variables Crude analyses Adjusted Model 1 Adjusted Model 2
β η2 β η2 β η2
Physical activity (low) -5.31*** 0.03 -6.96*** 0.06 -5.76*** 0.05
Smoking -6.02*** 0.05 -3.18* 0.01 -0.86 0.001
Alcohol consumption -4.40** 0.01 -1.97 0.001 0.73 0.001
White bread consumption -6.83*** 0.06 -4.66*** 0.03 -3.45** 0.02
Olive oil consumption Ref 0.04 - 0.02 - 0.01
Sunflower, corn, etc. oil consumption -3.47* - -2.26 - -1.29 -
Butter-margarine consumption -9.50 ***
- -6.31 *
- -2.74 -
Fruit (≥2 servings a day) Ref 0.04 - 0.03 - 0.01
1 day / serving -0.06 - 0.30 - 0.20 -
Never -5.47 **
- -4.36 **
- -2.43 -
Vegetables (≥2 servings a day) Ref 0.09 0.06 - 0.04
1 day / serving -2.38 - -2.18 - -0.61 -
Never -11.5*** - -9.42*** - -6.76*** -
Adding salt to food without tasting -5.05 **
0.03 -3.67 *
0.02 -1.97 0.01
Drinking tea with sugar -7.26*** 0.07 -6.81*** 0.07 -5.15*** 0.05
The number of main meals (1 or >3) -10.07 ***
0.03 -9.56 ***
0.03 -7.18 **
0.02
Body Mass Index (676 K. T. Selçuk, C. Çevik, H. Baydur, et al.
versions developed in the Switzerland and Nether- methods were used for the adaptation of the scale, clas-
lands (6,13). In this study ICC was within the range sical psychometric methods were used for the analysis.
of 0.80-0.96. According to these results, respondents’ In addition, the test-retest methodology, an important
responses given to the scale items at a two-week inter- criterion indicating whether a scale is consistent, was
val were consistent with each other. used in this study.
The results of the CFA (χ2/df=2.51) and the results
of the CFI were within the acceptable limits (0.93). It
was found that the scale was acceptable in terms of the Conclusion
indicators showing residual error, and that the RM-
SEA value (0.062) was below the accepted limit value The SPFL Scale adapted to Turkish society is a
(Validity and reliability of the Turkish version of the self-perceived food literacy scale 677
tanbul: Marmara University; 2018. Archives of Neuropsychiatry 2013; 50: 130-134.
11. Cesur B, Koçoğlu G, Sümer H. Evaluation instrument of 18. Tangney JP, Baumeister RF, Boone, AL. High self-control
nutrition literacy on adults (EINLA) A validity and reli- predicts good adjustment, less pathology, better grades, and
ability study. Integr Food Nutr Metab 2015; 2(3): 174-177. interpersonal success. J Pers. 2004; 72(2): 271-324.
12. D urmuş H, Enes Gökler M, Havlioğlu S. Reliability and 19. Nebioglu M, Konuk N, Akbaba S, Eroğlu Y. The Investiga-
validity of the Turkish version of the short food literacy tion of validity and reliability of the Turkish version of the
questionnaire among university students. Progress in Nutri- Brief Self-Control Scale. Bulletin of Clinical Psychophar-
tion 2019; 21(2): 333-338. macology 2012; 22(4): 340-351.
13. Poelman MP, Dijkstra SC, Sponselee H. Towards the 20. Price LR. Psychometric methods theory in to prac-
measurement of food literacy with respect to healthy eating: tice, The Guilford press: New York, USA, 2017. ISBN
the development and validation of the Self-Perceived Food 9781462524778.
Literacy Scale among an adult sample in the Netherlands. 21. Cohen RJ, Swerdlik ME. Psychological testing and assess-
Int J Behav Nutr Phys Act 2018; 15(1): 54. ment: An introduction to tests and measurement, 9th ed,
14. Ares G, Machin L, Girona A, et al. Comparison of mo- McGraw-Hill Education: London, England, 2018. ISBN
tives underlying food choice and barriers to healthy eating 1259870502
among low medium income consumers in Uruguay. Cad
Saúde Pública 2017; 33(4): e00213315.
15. Arafat S. Cross cultural adaptation & psychometric valida-
tion of instruments: Step-wise description. Int J Psychiatry Correspondence:
2016; 1(1): 1-4. Kevser Tarı Selçuk, MPH, PhD
16. Patton JH, Stanford MS, Barratt ES. Factor structure of Bandirma Onyedi Eylul University Faculty of Health Sciences,
the Barratt impulsiveness scale. J Clin Psychol 1995; 51: Department of Nutrition and Dietetics
768-774. Bandirma, Balikesir, Turkey, 10200.
17. Tamam L, Güleç H, Karataş G. Short form of Barratt Im- Phone: +90 (506) 133 69 92
pulsiveness Scale (BIS-11-SF) Turkish adaptation study. E-mail: kevser_tari@hotmail.comYou can also read