www.alineanutrition.com - Alinea Nutrition
←
→
Page content transcription
If your browser does not render page correctly, please read the page content below

JANUARY 2021

www.alineanutrition.com
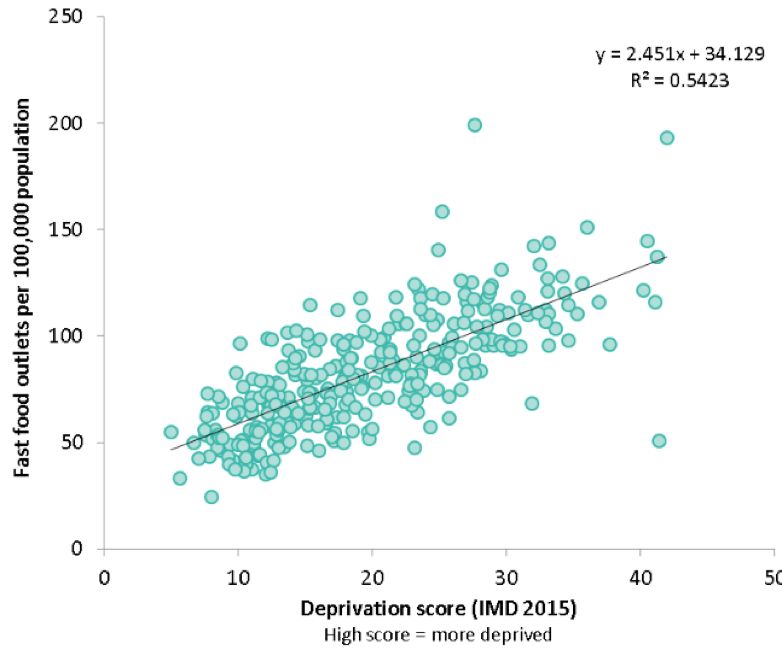
TABLE OF
           CONTENTS
           What We Know, Think We Know, or Are Starting to Know   03

           *Geek Box: Disability-Adjusted Life Years (DALYS)      04

           The Study                                              05

           Results                                                05

           The Critical Breakdown                                 06

           Key Characteristic                                     07

           Interesting Finding                                    07

           Relevance                                              08

           Application to Practice                                08

           References                                             09

02   www.alineanutrition.com
Burgoine T, Sarkar C, Webster CJ, Monsivais P. Examining the
interaction of fast-food outlet exposure and income on diet and
obesity: evidence from 51,361 UK Biobank participants. Int J Behav
Nutr Phys Act. 2018;15(1):71.
What We Know, Think We Know, or Are Starting to Know
In the London Borough of Kensington and Chelsea, life expectancy in the lowest income area
of the borough is 22yrs shorter than in the richest areas (1). Let that sink in.
While there are myriad social, economic, and environmental factors which add up to create
such an appalling discrepancy within the very same geographic area of one of the richest
cities and countries in the world, it is now recognised that diet is the major driver of non-
communicable disease mortality and disability-adjusted life years*, surpassing tobacco
smoking (2). Globally, the main dietary risk factors identified by the 2017 Global Burden of
Disease Study included high sodium, low whole grains, low fruit, low nuts and seeds, low
vegetables, and low omega-3 fatty acids (2).
In developed countries like the UK, it is unequivocal that the burden of chronic disease is
disproportionately borne by people living in conditions of social deprivation (1)
. In recent
years, more attention has been placed on the food environment and the influence of the food
environment on dietary choices. While many of these factors are broadly considered“social
determinants”of health, the term“structural determinants”has been used to describe the
effects of the food environment on shaping eating behaviour (1).
For example, an analysis by Public Health England which modelled the numbers of fast food
outlets by local authority district throughout the UK demonstrated a correlation between
higher levels of social deprivation and greater density of fast food outlets (3)
. Fraser et al.
demonstrated that the density of McDonald’s, Pizza Hut, Burger King, and KFC, were each
linearly associated with increasing social deprivation, i.e., the more socially deprived the area,
the more of each of these fast food outlets were located in the area (4). This is not without
potential consequence for diet, as exposure to fast food outlets correlates with intake, among
other variables (4).
Indeed, research in this area remains in relative infancy, and various methodology have been
utilised to try to more accurately characterise the relationship between the food environment
and dietary intake. The present study investigated the effects of exposure to fast food outlets
and household income on processed meat intake in a UK cohort.
www.alineanutrition.com 03Figure from (R) illustrating the relationship between social deprivation index
(bottom X axis, increasing deprivation from left to right) and density of fast
food outlets per 100,000 population (left Y axis, increasing fast food outlets from
bottom to top). Local authority areas with a higher social deprivation score tended to
have a greater density of fast food outlets.
*Geek Box: Disability-Adjusted Life Years (DALYS)
While epidemiology tends to focus on ‘hard’ outcomes in terms of events, e.g., myocardial
infarction or lung cancer, these events may only represent the endpoint of a long disease process.
With chronic lifestyle diseases, it is common for individuals to be treated for the disease before
an event occurs. Thus, it is important to not only be able to quantify the incidence of events,
but the amount of years a person lives disease-free. If people are diagnosed with a disease at a
younger age, this means a greater number of the lifespan is spent combating a disease. Disability-
adjusted life years [DALYs] are a method of quantifying the burden of disability associated with a
disease, and reflect the number of years spent dealing with an illness or disability, and premature
death, within a population. DALYs are calculated by adding the number of years of life lost to
the number of years spent living with an illness or disability. Thus, DALYs estimate the sum of
both premature death and years spent with illness. The life years lost is based off average life
expectancy in the population. By using the reference standard life expectancy, it is possible to
use DALYs to summarise population health, because DALYs can reflect a gap in health, i.e., the
actual state of population health compared to the ideal goal [which is for people to live the full
life expectancy with full health]. It is possible to quantify DALYs by age, sex, and location, to
provide absolute measures of the years of healthy life lost due to illness and death and provide
meaningful comparisons across different populations and groups.
04 www.alineanutrition.comThe Study
40-69yrs, registered with the National Health Service [NHS] in the United Kingdom. Participants
were recruited between 2007 and 2010. The present study focused on the Greater London
centre of the Biobank cohort, which had data on neighbourhood fast food outlets [FFO]
accurate up to 1-meter. Proximity to FFO was assessed as a 1-mile radius from a participants
address. FFO were defined as“outlets selling food and/or drink for consumption off the
premises (excluding general and convenience stores, coffee shops and supermarkets)”. The
number of FFO was expressed as a proportion (as percentage) of all food outlets (including
FFO, supermarkets, restaurants, convenience stores, cafes, and specialist stores). Household
income was self-reported by participants in the following income brackets:
• £31,000-£51,999
• £52,000-£100,000
• >£100,000
The two primary exposures were:
• Proportion of neighbourhood FFO
• Household income
The primary outcomes were processed meat consumption, Body Mass Index [BMI] and body
fat. The analysis examined the relationship between each exposure with odds of frequent
processed meat consumption [defined as more than once per week] and of obesity [defined
as BMI >30 and percentage of body fat], and also examined the interaction between both
exposures and each outcome. 51,000 participants were included in the final analysis.
Results: The mean age of participants was 56yrs [range 38-72yrs], 56% female, and 80%
white ethnicity. Mean BMI and body fat were 26.9 and 30.8%, respectively. 27.7% consumed
processed meat >1/week. FFO accounted for 18.4% of neighbourhood food retail, an average
of 39.2 outlets. Participants with greater exposure to FFO were more likely to be Black or Asian
Minority Ethnic [BAME], lower income, with less educational qualifications. In the top quarter
of FFO exposure, between 24-45% of neighbourhood food vendors were FFO.
• Association of FFO with Processed Meat, BMI and Body Fat: Participants with the
highest proportion of FFO had a 28% greater odds [95% CI 1.19-1.38] of being a frequent
processed meat consumers, compared to the lowest proportion exposure group. There
was a linear association between increasing proportion of neighbourhood FFO and odds
of frequent processed meat intake. The highest proportion of FFO was associated with a
0.99 heavier BMI and 1.37% higher body fat [after adjusting for income, education, and
other food outlets].
www.alineanutrition.com 05• Association of Household Income with Processed Meat, BMI and Body Fat: Participants
in the lowest income bracket [once per week’, which given that a food frequency
questionnaire was used to assess diet, may have artificially biased results toward FFO even
if foods like bacon or ham were consumed in the home, i.e., processed meat may be a poor
proxy for fast-food. The odds of being a‘frequent’consumer makes no distinction between
twice per week and once per day, despite this range of frequencies being expected to have
quantitatively different outcomes. Given that ultra-processed foods, i.e., foods concomitantly
high in refined starch, added fats and sugars, and sodium, constitutes up to 50% of energy
intake in the UK population, focusing on processed meat seems overly reductionist and likely
omits important related exposures, e.g., sugar-sweetened beverages and foods like French
fries. Given the correlations between ethnicity and the relevant exposures, the overall lack
of BAME representation in the cohort is a limitation.
06 www.alineanutrition.comKey Characteristic
The method of quantifying FFO, a a measurement of the food environment, is an ongoing
subject of debate within this research area (5). It is possible that many of the methods
commonly used may mischaracterise the food environment. The classification of food
stores is often arbitrary: FFO are often classified as‘unhealthy’while a supermarket may be
classified as‘healthy’, despite the availability for purchase of many unhealthy foods and
beverages (5). The present study used proportions to reflect the food environment, i.e., the
number of FFO relative to total food vendors. The risk with this approach is that certain food
stores are excluded, depending on what classification the researchers used. In the present
study, the other food vendors included supermarkets, restaurants, convenience stores, cafes,
and specialist stores. This seems broad enough to more accurately reflect the proportion of
FFO relative to total food vendors, rather than over or underestimate the true proportion
[although this can not be ruled out entirely]. However, issues may still arise: for example,
the proportion of FFO in an area would be the same if there were 3 FOO vs. 3 restaurants
as if there was 12 FOO vs. 12 restaurants, but these food environments would likely be
qualitatively different. The present study clearly defined FFO, included a broad classification
of all other neighbourhood food vendors, and thus may provide a representative measure
of the density of FFO in a neighbourhood. However, there is clearly scope to expand and
improve on methodology for characterising the food environment (5).
Interesting Finding
The additive effect of both low income and greater neighbourhood FFO exposure provides
an important addition to the general evidence on the geography of fast food outlets. While
previous analyses have demonstrated a strong correlation between level of social deprivation
and density of FFO (3,4), the present study adds to this literature by demonstrating relationships
between both income and FFO exposure with processed meat intake and adiposity. As the
percentage of FFO increased, both the odds of obesity and higher body, and the odds of higher
processed meat consumption, increased linearly. The fact that these associations remained,
albeit attenuated in strength of association, after adjusting for socio-economic factors and the
total of neighbourhood food outlets, strongly implicates the convergence of low income and
greater exposure to FFO in diet quality and adiposity.
www.alineanutrition.com 07Relevance
Dietary choices remain primarily viewed through the lens of a behavioural risk factor, i.e., it is
a behavioural choice at the level of the individual. However, the research demonstrates that
structural factors are strongly tied to agency (1). For example, people on low incomes are more
likely to demonstrate price consciousness and budgeting, which dictates food choices and
may increase reliance on FFO as sources of cheap energy (1,6). In the Tower Hamlets Study,
schoolchildren demonstrated that it was more cost effective for them to save school meals
money and use it on fast food later in the day, and felt that school meals were poor value
compared to FFO (6).
Normative influences may also be important, as research from the Netherlands indicated
that fast food intake correlated with the neighbourhood social norms regarding fast food
consumption, i.e., when eating from FFO is normalised within the neighbourhood it correlates
with odds of consumption (7). Conversely, an intervention which altered the display of drinks
in a convenience store to more readily display non-calorically sweetened beverages reduced
purchase of sugar-sweetened beverages by 25% over a month, demonstrating the potential
for behavioural‘nudges’to influence outcomes (8).
However, the issue of bottom-line purchasing power remains: a cross-sectional analysis in
Scotland which investigated diet quality patterns relative to social deprivation indicated that
the most unhealthy dietary patterns related linearly to levels of social deprivation (9).
Potential limitations of the methodology used to quantify the food environment aside, and
the difficulty of making inferences regarding choice, the reality is that both structural and
social determinants - the built environment and income levels - exhibit strong influences on
diet and health. There is a need for multilevel, multi-sector prevention strategies at the level
of policy, environment and practises, and local communities.
Application to Practice
Perhaps one of the deepest rooted tropes about diet and health is that everything boils
down to“personal responsibility”. This creates false equivalence with regard to the choices
available both at the community and individual level. This is an area of research that is often
overlooked, and we can all benefit from giving more consideration to the challenges, barriers,
and potential solutions to the gross disparities in access to good nutrition and health.
08 www.alineanutrition.comReferences
1. Marmot M. Health equity in England: the Marmot review 10 years on. BMJ. 2020;:m693.
2. GBD 2017 Diet Collaborators. Health effects of dietary risks in 195 countries, 1990–
2017: a systematic analysis for the Global Burden of Disease Study 2017. The Lancet.
2019;393(10184):1958-1972.
3. Public Health England. Density of fast food outlets. PointX Data; 2016 p. 1-2.
4. Fraser L, Edwards K, Cade J, Clarke P. The Geography of Fast Food Outlets: A Review.
International Journal of Environmental Research and Public Health. 2010;7:2290-2308.
5. Thornton L, Lamb K, White S. The use and misuse of ratio and proportion exposure measures
in food environment research. International Journal of Behavioral Nutrition and Physical
Activity. 2020;17(1).
6. Caraher M, Lloyd S, Madelin T. The school food shed: a report on schools and fast food outlets
in Tower Hamlets. British Food Journal. 2014;116(3):472-493.
7. van Rongen S, Poelman M, Thornton L, Abbott G, Lu M, Kamphuis C et al. Neighbourhood
fast food exposure and consumption: the mediating role of neighbourhood social norms.
International Journal of Behavioral Nutrition and Physical Activity. 2020;17(1).
8. Thorndike A, Sonnenberg L, Riis J, Barraclough S, Levy D. A 2-Phase Labeling and Choice
Architecture Intervention to Improve Healthy Food and Beverage Choices. American Journal
of Public Health. 2012;102(3):527-533.
9. Whybrow S, Craig L, Macdiarmid J. Dietary patterns of households in Scotland: Differences by
level of deprivation and associations with dietary goals. Nutrition and Health. 2017;24(1):29-
35.
www.alineanutrition.com 09You can also read