A COMPREHENSIVE ANALYSIS OF DISTRACTED DRIVING USING A DRIVING SIMULATOR - Ijtte
←
→
Page content transcription
If your browser does not render page correctly, please read the page content below
International Journal for Traffic and Transport Engineering, 2020, 10(2): 252 - 265
DOI: http://dx.doi.org/10.7708/ijtte.2020.10(2).10                                                      UDC: 004.94:656.13

A COMPREHENSIVE ANALYSIS OF DISTRACTED DRIVING
USING A DRIVING SIMULATOR
Samira Ahangari1, Mansoureh Jeihani2, Behrouz Salahshour3, Martin Ndegwa4
    Department of Transportation and Urban Infrastructure Studies, Morgan State University,
1, 2, 4

    Baltimore, MD 21251, USA
3
  Department of Civil Engineering, Old Dominion University, Norfolk, VA 23529, USA
Received 26 February 2020; accepted 31 March 2020

Abstract: Studies have examined the detrimental impact of distracted driving on safety;
however, the effect of different types of distraction accompanied by different road classes
has not been investigated. This study used a high-fidelity driving simulator to examine the
driving behavior of young participants while engaged in various distractions – no cell phone,
hands-free call, hand-held call, voice commands text, text, clothing, eating or drinking – on
different road classes: rural collector, freeway, urban arterial, and local road in a school zone.
Some 92 participants drove a simulated network in Baltimore County with seven scenarios
(one base scenario without any distraction and six different types of distraction). Participants
also completed questionnaires documenting demographics and driving behavior before and
after the driving simulator experience. The descriptive and statistical analysis revealed the
negative impact of distraction on safety, such that participants exhibited greater fluctuations
in speed, changed lanes significantly more times, and deviated from the center of the road
when they were distracted while driving. The results indicated that drivers reduced their
speed up to 33% while distracted with hands-free/voice command cell phone usage, which
is inconsistent with the current cell phone usage policies in most states.

Keywords: distracted driving, driver behavior, driving simulator.

1. Introduction                                                           the tasks vary as a function of time, place
                                                                          and speed (Lee, 2017). Driver distraction
Distracted drivers are involved in about 9%                               occ u r s w hen a d r iver “ i s del ayed i n
of all crash fatalities, accounting for 3,166                             recognition of information needed to safely
deaths including 497 pedestrians in 2017                                  accomplish the driving task because some
(Neale et al., 2005). With the prevalence                                 event, activity, object or person within or
of cell phones and their various uses, these                              outside the vehicle compelled or tended
numbers may potentially arise. Therefore,                                 to include the driver’s shifting attention
more in-depth knowledge of accepted safe                                  away from the driving task,” and is the
driving behaviors is needed.                                              major cause of driver inattention (Stutts
                                                                          et al., 2001). Stutts et al., simply being
Driving safely consists of performing a                                   “lost in thought” is another category of
collection of visual-motor tasks involving                                inattention which is distinguished from
a vehicle and ever y thing else in which                                  extrinsic distraction.

1
    Corresponding author: saaha1@morgan.edu

                                                                                                           252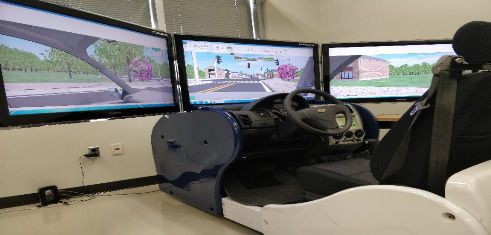
Ahangari S. et al. A Comprehensive Analysis of Distracted Driving Using a Driving Simulator

Driver distractions can be further divided                  Other researchers explored the willingness
into driving environment complexity effects,                of drivers to use applications that limit some
such as roadside advertisements, and in-                    phone usage such as texting but allow access
vehicle effects including talking with other                to other applications like GPS in order to
passengers, eating/drinking, radio tuning,                  reduce exposure to high-risk behaviors while
or more recently cell phone usage (Horberry                 driving (Oviedo-Trespalacios et al., 2019).
et al., 2006). Some researchers use tuning the
radio as a benchmark for distracted driving                 The three types of research involving cell
(Lee et al., 2018). Numerous studies show                   phones and other driving distractions
that cell phone usage compromises drivers’                  are: epidemiological studies, field studies,
attention (Charlton, 2009; Choudhary &                      and recent research conducted using
Velaga, 2017; Drews et al., 2004; Lipovac et                simulators (Lipovac et al., 2017). (Törnros
al., 2017; Overton et al., 2015; Schlehofer et al.,         & Bolling, 2005) investigated the effects
2010, Ahangari et al, 2019). However, not all               of hand-held and hands-free phones on
usages of the phone have similar distracting                driving performance using a simulator
effects. Texting has been found to be more                  and found that while hands-free usage of
distracting (Drews et al., 2009; Gliklich                   a phone improved lateral driving control
et al., 2016), perhaps because it has both a                during the conversation period, distraction
cognitive demand and a physical constraint                  measurements during dialing and other
compared to talking on the phone (Stavrinos                 activities were no different when compared
et al., 2013). However, other studies suggest               to hand-held usage (Törnros & Bolling,
that texting, even using text-to-speech                     2005). Another study compared talking on a
technology, still impairs drivers’ reaction                 cell phone to talking to a passenger and found
time and attention span (He et al., 2014;                   that phone conversations caused a greater
NHTSA, 2015).                                               deceleration in response time and thereby
                                                            posed a higher collision hazard (Charlton,
In a report published by AT&T, about 97% of                 2009). Lateral performance measures during
teenagers admitted knowing the dangers of                   distracted driving were investigated by
texting and driving; however, 43% reported                  (Choudhary et al., 2017) on 100 drivers and
that they still text sometimes. About 75% of                the results indicated a significant decrease in
the respondents have described texting or                   performance during the texting and driving
emailing while driving as “common” among                    task. They suggest in-vehicle monitoring
their friends and peers. More than 90% of the               devices for driver distraction measurements
participants agreed that a severe legal action              (Choudhary & Velaga, 2017).
(license suspension or a $500 ticket) would
be the most effective preventive method                     In the current study, a simulator is used
(Tomas et al., 2012). The results from similar              to investigate the effects of six different
penalties support these survey findings. For                scenarios of in-vehicle distractions including
instance, (Liu et al., 2019) have investigated              usage of a cell phone with and without hands-
the effectiveness of California’s 2008 ban on               free capability on different types of roads
hand-held phones while driving. Their results               (rural collector, freeway, urban arterial,
show the effectiveness of these regulations                 and local road in a school zone). Drivers
and support a full ban on cell phone usage,                 were given a survey before and after their
not just hand-held devices (Liu et al., 2019).              driving experience. The goal of this research

          253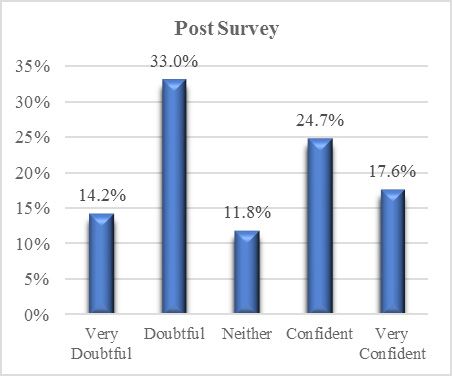
International Journal for Traffic and Transport Engineering, 2020, 10(2): 252 - 265

is to investigate the driver’s behavior in the                            2.3. Driving Simulator
presence of different types of distraction on
different types of roads and compare it with                              The observer made sure that the participants’
no distraction.                                                           cell phones worked properly. They instructed
                                                                          the participants to drive briefly to familiarize
2. Methods                                                                themselves with the simulator environment
                                                                          and explained the procedure before each
2.1. Participants                                                         scenario. Participants were instructed to
                                                                          adjust their cell phone to a loud ringer
We recruited 92 young participants from                                   volume and have it handy before beginning
Morgan State University and the Baltimore                                 each scenario.
metro area via flyers distributed manually,
online and through social media. Flyer                                    The participants started driving in a base
content included contact information,                                     scenario with no distraction to compare
a s u m m a r y of t he req u i re ment s for                             that driving behavior with other types
t he st udy, a nd a n e x pla nat ion of t he                             of distraction. Participants then drove
monetary compensation for driving the                                     six different distraction scenarios in no
simulator. Subsequently, we screened                                      particular order – including hands-free call,
prospective participants for eligibility and                              hand-held call, voice commands text, text,
scheduled them to drive in the simulator                                  clothing, and eating or drinking – on a road
environment.                                                              network north of Baltimore that includes four
                                                                          different classes of the road (rural collector,
Participants were required to possess a valid                             freeway, urban arterial, and local road in a
driver’s license and were compensated at                                  school zone) with different numbers of lanes
$15 per hour for their study participation.                               and speed limits for each road (Figure 1).
In addition, participants were asked to use
their own cellphone during the driving                                    There was one type of distraction in each
experience and bring a hands-free device                                  scenario and the distraction happened
and a jacket/sweater with them for different                              exactly at the same location. The questions
distracting experiences. We provided them                                 involved were similar in cognitive load (but
with water and candy for drinking and eating                              different in content) for a fair comparison
distractions.                                                             between different distractions. Participants
                                                                          were instructed to answer a phone call,
2.2. Procedure                                                            respond to a text message upon receiving
                                                                          it, clothing, and drink or eat during the
Under the supervision of an advisor, a team                               simulated drive. Participants did not know
of undergraduate and graduate student                                     the questions they would receive as a call
research assistants observed the driving                                  or text during any given scenario so that
tasks. Participants were asked to fill out a                              they would not exhibit anticipatory behavior
pre-survey questionnaire, then drive for                                  that would have inf luenced their driving
about two hours in different simulated                                    behavior.
scenarios, and then fill out the post-survey
questionnaire after driving to find the effect                            During each driving scenario, participants
of their experience on driver behavior.                                   were instructed to drive as they typically

                                                                                                             254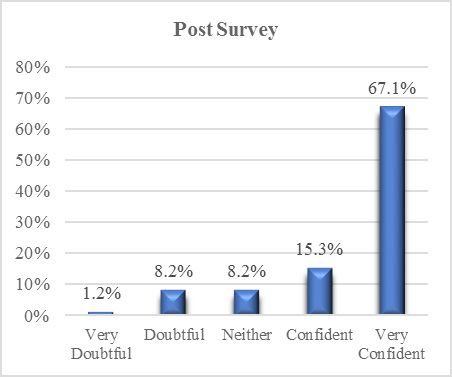
Ahangari S. et al. A Comprehensive Analysis of Distracted Driving Using a Driving Simulator
would on a real road for approximately closely matched driving situations in the
15 min and comply with the speed limit. Baltimore metropolitan area. Traffic flow
The virtual roads environment featured and density were the same in all seven
one lane with a 30 mph speed limit for the scenarios. The driving experience in each
rural collector, three lanes with 55 mph for scenario progresses from rural to freeway,
the freeway, two lanes with 45 mph for the then to urban and finally to a local road, and
urban arterial, and one lane with 30 mph participants received the distraction in the
for the local road. The daytime scenery same location in each scenario (Figure 1).
Fig. 1.
Study Network
2.4. Text and Call Condition about real driving behavior before the
driving simulator experience (pre-survey)
The observers used a script that required and driving behavior after driving the
participants to respond to various open- simulator (post-survey). Observers gave
ended questions. Typical questions were participants the option of completing the
“What comes to your mind when you hear questionnaire on their own or with the
the word ‘America’?” or “What’s your number assistance of the observer.
one vacation destination?” and “How many
of your friends have names beginning with 2.6. Driving Simulator
‘F?”. The participants were distracted five
times during each scenario including once Participants drove about 10 miles in each
in a rural area, twice on the freeway, and scenario in a high-fidelity driving simulator
once in the urban area and in the local area to provide a measure of driving performance
at exactly the same position. under different distracting tasks (http://
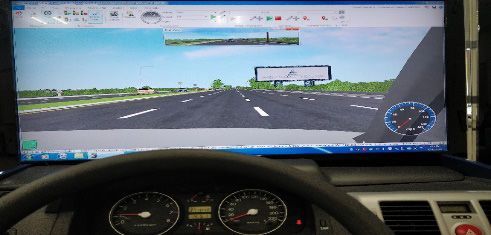
www.forum8.co.jp). The simulation was
2.5. Questionnaires displayed on three, 40-inch LCD screens.
Participants sat within the simulator’s driver
The questionnaires involved completing compartment, which provided a view of the
demographic information and questions roadway and dashboard instruments including
255International Journal for Traffic and Transport Engineering, 2020, 10(2): 252 - 265
a speedometer (Figure 2). The vehicle was Simulated vehicles with varying speed and
controlled by moving a steering wheel in the volume were programmed to interact with the
typical fashion and pressing the accelerator participant driver. Researchers could safely
and brake pedals accordingly. Naturalistic assess the impact of distracted driving by
engine sounds, road noise, and sounds of comparing drivers’ behavior under different
passing traffic simulated the real world. types of distraction with no distraction.
Fig. 2.
Driving Simulator
2.7. Driving Performance changed their speed for each scenario. We
used lane change frequency, defined as the
Different information about the driver’s number of times the driver changed lanes, as
behavior including speed, throttle, brake, an indicator. The brake and throttle behavior
steering velocity, offset from road center, and indicates distraction, which compares with
lane change was calculated for the distraction no distraction behavior. The severe force of
condition. For example, we calculated offset a brake demonstrates inattention to the road
from the road center, which was reported and taking the mind off the road.
as the deviated distance from the road
center toward the right or left side, and 2.8. Data Analyzing
saved it as an indicator of impaired driving
performance. Greater within-lane deviation Descriptive statistics were obtained from pre-
indicated poorer driving precision. Average survey questionnaire data regarding participant
driving speed within the distraction area characteristics. Some 56.52% of participants
(the distraction area was different for each were male and 43.48% were female. The age
road) was calculated based on the speed group of participants was between 18 to 40
of the vehicle and time of distraction and years old; 44.57% of which were in the age
computed as the degree to which drivers group of 21 to 25 years (Table 1).
256Ahangari S. et al. A Comprehensive Analysis of Distracted Driving Using a Driving Simulator
Table 1
Sociodemographic Analysis
Variable Frequency Percent
Female 40 43.48
Gender
Male 52 56.52
18 to 20 15 16.30
21 to 25 41 44.57
Age 26 to 30 15 16.30
31 to 35 9 9.78
36 to 40 12 13.04
Associate degree 7 7.61
College graduate 14 15.22
Education Status College student 50 54.35
High School or less 15 16.30
Postgraduate 6 6.52
No 44 47.83
Full time 18 19.57
Employment Status
Part-time 30 32.61
Total 92 100.00
$20K to $30K 18 19.57
$30K to $50K 19 20.65
Household Annual $50K to $75K 11 11.96
Income $75K to $100K 2 2.17
Less than $20K 27 29.35
More than $100K 15 16.30
1 23 25.00
2 23 25.00
Household Size
3 18 19.57
an or more 28 30.43
3. Results and Discussion use the hands-free phone, 22.8% use a
hand-held phone, 21.7% text, 8.7% read
3.1. Pre-survey Analyzing social media, 6. 5% read email, 16.3%
take pictures, 45.7% drink or eat, and
The pre-survey questionnaire 1.1% change their clothes when driving
demonstrated that 43.5% of participants (Figure 3).
257International Journal for Traffic and Transport Engineering, 2020, 10(2): 252 - 265
Fig. 3.
Pre Survey Analysis
3.2. Post-survey Analyzing A nd 47.2% were doubtf ul about using
technologies while driving for safety’s sake
The results of the post-survey questionnaire compared to only 15.2% who had doubts in
show a great change in the attitude of drivers the pre-survey questionnaire. After driving,
after being involved in such a study. Some 51.8% expressed doubt about their ability
36.5% of the participants stated that the to use cell phones freely and not make any
driving simulator experience encouraged driving mistakes; 26% had stated they were
them to reduce cell phone use while driving. doubtful in pre-survey (Figure 4).
258Ahangari S. et al. A Comprehensive Analysis of Distracted Driving Using a Driving Simulator
To what extent are you confident that YOU, driving in the following situations, would NOT experience
any driving mistakes such as deviating from the destination, going through a red light, near-crash
experience, crash, etc.? [Technologies such as voice to text]
To what extent are you confident that YOU, driving in the following situations, would NOT experience
any driving mistakes such as deviating from the destination, going through a red light, near-crash
experience, crash, etc.? [No cell phone while driving]
Fig. 4.
Comparison of Pre and Post Survey Results
3.3. Driving Simulator Analyzing text, taking on or off clothes, and eating
or drinking) and considering different
We conducted several ANOVA to compare road classes. The results (Table 2) revealed
the driving behavior (speed, throttle, brake, significant differences in speed, throttle,
steering velocity, offset from road center, brake, steering velocity, offset from road
and lane change) under different types of center, and lane change when comparing
distractions (no distraction, hands-free d i f ferent t y pes of d i st rac t ion to no
call, hands-held call, voice commands text, distraction.
259International Journal for Traffic and Transport Engineering, 2020, 10(2): 252 - 265
Table 2
Descriptive and ANOVA Analysis
Std. Std. Std. Std.
Variables N Mean Devia- F N Mean Devia- F N Mean Devia- F N Mean Devia- F
tion tion tion tion
Type of Road
IV (Type of
DV
Distraction)
Rural Collector Freeway Urban Arterial Local Road in a School Zone
No
78 70.31 19.15 156 83.16 9.67 78 52.22 14.55 63 35.72 11.32
Distraction
Hands-Free
81 55.41 14.40 162 74.24 8.25 81 44.85 7.38 64 27.75 10.82
Call
Hand-Held
81 55.00 14.94 160 74.18 7.09 79 45.34 8.55 70 26.29 8.98
Call
Voice
Speed 10.28* 34.45* 6.68* 11.72*
Commands 78 56.62 14.63 154 73.80 8.10 77 43.32 9.77 69 23.78 10.68
Text
Text 77 60.07 13.95 154 73.35 8.37 77 45.16 9.65 70 25.30 9.64
Clothing 42 53.66 16.60 84 69.78 6.99 42 44.34 9.44 38 17.96 11.31
Eating or
43 58.45 15.47 86 70.35 7.00 43 42.20 10.28 40 26.14 11.54
Drinking
No
78 0.37 0.19 156 0.33 0.15 78 0.29 0.16 66 0.12 0.07
Distraction
Hands-Free
81 0.25 0.12 162 0.29 0.13 81 0.23 0.10 64 0.10 0.07
Call
Hand-Held
81 0.27 0.15 160 0.29 0.13 79 0.24 0.11 70 0.11 0.08
Call
Voice
Throttle Commands 78 0.26 0.12 8.45* 154 0.29 0.12 13.01* 77 0.25 0.10 1.83 69 0.09 0.06 2.59*
Text
Text 77 0.33 0.15 154 0.30 0.15 77 0.27 0.15 70 0.11 0.05
Taking off or
42 0.38 0.15 84 0.26 0.11 42 0.25 0.15 38 0.12 0.06
on Clothing
Eating or
43 0.39 0.19 86 0.28 0.13 43 0.26 0.16 40 0.12 0.07
Drinking
No
78 0.01 0.01 156 0.01 0.01 78 0.01 0.01 66 0.10 0.09
Distraction
Hands-Free
81 0.00 0.01 162 0.01 0.01 81 0.01 0.01 64 0.10 0.10
Call
Hand-Held
81 0.01 0.01 160 0.01 0.01 79 0.01 0.01 70 0.09 0.08
Call
Voice
Brake 2.01* 3.50* 0.63 2.09
Commands 78 0.00 0.01 154 0.01 0.01 77 0.01 0.01 69 0.09 0.07
Text
Text 77 0.00 0.01 154 0.01 0.01 77 0.01 0.01 70 0.09 0.07
Clothing 42 0.01 0.02 84 0.01 0.01 42 0.01 0.01 38 0.12 0.09
Eating or
43 0.00 0.01 86 0.01 0.01 43 0.01 0.01 40 0.13 0.11
Drinking
No
78 0.02 0.01 156 0.04 0.03 78 0.02 0.01 66 0.03 0.02
Distraction
Hands-Free
81 0.02 0.01 162 0.04 0.03 81 0.02 0.01 64 0.03 0.05
Call
Hand-Held
81 0.02 0.01 160 0.04 0.03 79 0.02 0.01 70 0.02 0.02
Call
Steering Voice
3.75 0.94 4.03* 3.04*
Velocity Commands 78 0.02 0.01 154 0.04 0.04 77 0.02 0.01 69 0.02 0.02
Text
Text 77 0.02 0.01 154 0.05 0.04 77 0.02 0.01 70 0.03 0.02
Clothing 42 0.02 0.01 84 0.06 0.04 42 0.03 0.01 38 0.03 0.01
Eating or
43 0.02 0.01 86 0.05 0.04 43 0.02 0.01 40 0.03 0.02
Drinking
260Ahangari S. et al. A Comprehensive Analysis of Distracted Driving Using a Driving Simulator
Std. Std. Std. Std.
Variables N Mean Devia- F N Mean Devia- F N Mean Devia- F N Mean Devia- F
tion tion tion tion
No
78 0.97 0.63 156 3.73 3.25 78 2.50 2.22 66 0.61 0.37
Distraction
Hands-Free
81 0.96 0.65 162 3.37 3.06 81 2.48 2.34 64 0.61 0.39
Call
Hand-Held
81 0.93 0.64 160 3.53 3.11 79 2.30 2.24 70 0.61 0.39
Offset Call
From Voice
8.87 6.27* 4.43* 5.97*
Road Commands 78 0.97 0.64 154 3.59 3.23 77 2.41 2.21 69 0.58 0.33
Center Text
Text 77 0.95 0.62 154 3.65 3.17 77 2.36 2.21 70 0.65 0.37
Clothing 42 1.49 0.26 84 6.28 1.76 42 3.91 1.57 38 0.90 0.31
Eating or
43 1.53 0.27 86 6.32 1.55 43 3.81 1.61 40 0.88 0.34
Drinking
No
78 0.09 0.46 156 0.26 0.98 78 0.60 1.42 66 2.32 3.06
Distraction
Hands-Free
81 0.06 0.29 162 0.35 1.14 81 0.44 1.14 64 2.08 2.97
Call
Hand-Held
81 0.23 0.69 160 0.46 1.44 79 0.65 1.72 70 2.17 2.72
Call
Brake Voice
1.68 2.75* 2.37 7.27*
Light Commands 78 0.10 0.44 154 0.31 0.99 77 0.35 1.12 69 2.04 2.71
Text
Text 77 0.13 0.52 154 0.27 0.97 77 0.32 0.94 70 2.23 2.98
Clothing 42 0.00 0.00 84 0.00 0.00 42 0.00 0.00 38 0.00 0.00
Eating or
43 0.00 0.00 86 0.00 0.00 43 0.00 0.00 40 0.00 0.00
Drinking
Table 3 shows the result of the Post hoc scenario. Table 4 presents the speed change
Tu key, wh ich revea ls t he sig n i f ica nt percentages between each distraction and no
difference of independent variables when distraction for all four road classes.
comparing each type of distraction with no
distraction. Steering velocity and brake did As presented in Table 4 and Figure 5, the
not change among different distractions. greatest speed reduction happened on rural
This result shows a negative relationship and local roads, and clothing followed by
between eating/drinking and clothing eating/drinking had the highest speed
distractions and deviation from the road reduction among all distractions. The
center, probably due to taking their hands results indicate that participants reduced
off the wheel to do so. their speeds almost the same percentages
while distracted by a cell phone regardless
Participants significantly reduced their speed of being hand-held or hands-free, which is
and throttle on all four road classes in all six consistent with some previous studies (Liu
distractions compared to the no-distraction et al., 2019).
261International Journal for Traffic and Transport Engineering, 2020, 10(2): 252 - 265
Table 3
Post Hoc Tukey Analysis
Mean Mean Mean Mean
Std. Std. Std. Std.
Variables Difference Difference Difference Difference
Error Error Error Error
(I-J) (I-J) (I-J) (I-J)
Type of Road
DV IV (Type of Distraction)
Rural Collector Freeway Urban Arterial Local Road
Hands-Free Call 14.28* 2.50 8.92* 0.89 7.37* 1.58 7.97* 1.84
Hand-Held Call 15.58* 2.50 8.97* 0.90 6.88* 1.59 9.43* 1.80
No Voice Commands Text 16.25* 2.52 9.36* 0.90 8.90* 1.60 11.93* 1.81
Speed
Distraction Text 14.53* 2.53 9.81* 0.90 7.05* 1.60 10.42* 1.80
Taking off or on Clothing 20.69* 3.01 13.37* 1.08 7.88* 1.90 17.76* 2.13
Eating or Drinking 14.96* 2.99 12.80* 1.07 10.02* 1.89 9.57* 2.10
Hands-Free Call 0.12* 0.02 0.04* 0.01 0.05 0.02 0.01 0.01
Hand-Held Call 0.10* 0.02 0.04 0.01 0.04 0.02 0.00 0.01
No Voice Commands Text 0.11* 0.02 0.05* 0.01 0.04 0.02 0.02 0.01
Throttle
Distraction Text 0.04 0.02 0.04 0.01 0.01 0.02 0.01 0.01
Taking off or on Clothing -0.01 0.03 0.07* 0.02 0.04 0.02 0.00 0.01
Eating or Drinking -0.02 0.03 0.06* 0.01 0.02 0.02 -0.01 0.01
Hands-Free Call 0.00 0.00 0.00 0.00 0.00 0.00 0.01 0.01
Hand-Held Call 0.00 0.00 0.00 0.00 0.00 0.00 0.01 0.01
No Voice Commands Text 0.00 0.00 0.00 0.00 0.00 0.00 0.01 0.01
Brake
Distraction Text 0.00 0.00 0.00 0.00 0.00 0.00 0.01 0.01
Taking off or on Clothing 0.00 0.00 0.00 0.00 0.00 0.00 -0.02 0.02
Eating or Drinking 0.00 0.00 0.00 0.00 0.00 0.00 -0.03 0.02
Hands-Free Call 0.00 0.00 0.00 0.00 0.00 0.00 0.00 0.00
Hand-Held Call 0.00 0.00 0.00 0.00 0.00 0.00 0.00 0.00
Steering No Voice Commands Text 0.00 0.00 -0.01 0.00 0.00 0.00 0.01 0.00
Velocity Distraction Text 0.00 0.00 -0.01* 0.00 0.00 0.00 0.00 0.00
Taking off or on Clothing 0.00 0.00 -0.02* 0.00 -0.01* 0.00 0.00 0.00
Eating or Drinking 0.00 0.00 -0.02* 0.00 0.00 0.00 -0.01 0.00
Hands-Free Call 0.01 0.09 0.36 0.33 0.01 0.35 0.00 0.06
Hand-Held Call 0.05 0.09 0.20 0.34 0.19 0.35 0.00 0.06
Offset
from No Voice Commands Text 0.00 0.10 0.14 0.34 0.09 0.35 0.04 0.06
Road Distraction Text 0.03 0.10 0.08 0.34 0.14 0.35 -0.03 0.06
Center
Taking off or on Clothing -0.52* 0.11 -2.55* 0.40 -1.41* 0.42 -0.29* 0.07
Eating or Drinking -0.55* 0.11 -2.58* 0.40 -1.31* 0.42 -0.26* 0.07
Hands-Free Call 0.03 0.09 -0.09 0.12 0.16 0.19 0.24 0.48
Hand-Held Call -0.14 0.09 -0.19 0.12 -0.04 0.19 0.15 0.47
Brake No Voice Commands Text -0.01 0.09 -0.05 0.12 0.25 0.19 0.27 0.47
Light Distraction Text -0.04 0.09 -0.01 0.12 0.28 0.19 0.09 0.47
Taking off or on Clothing 0.09 0.10 0.26* 0.14 0.60 0.23 2.32* 0.55
Eating or Drinking 0.09 0.10 0.26* 0.14 0.60 0.23 2.32* 0.55
262Ahangari S. et al. A Comprehensive Analysis of Distracted Driving Using a Driving Simulator
Table 4
Speed Change in Comparison with No Distraction
Type of Road
Rural Local Road in a
Freeway Urban Arterial
Collector School Zone
Type of Distraction
Hands-Free Call -21% -11% -14% -22%
Hand-Held Call -22% -11% -13% -26%
Voice Commands Text -19% -11% -17% -33%
Text -15% -12% -14% -29%
Taking off or on Clothing -24% -16% -15% -50%
Eating or Drinking -17% -15% -19% -27%
Fig. 5.
Speed Variations Among Various Distractions on Different Road Classes
263International Journal for Traffic and Transport Engineering, 2020, 10(2): 252 - 265
This study found clothing eating/drinking Motor Vehicle Administration-Maryland
is highly distractive. Participants deviated Highway Safety Office (GN-Morgan State
from the lane center and reduced their speed -2019-291) and the Urban Mobility & Equity
tremendously while taking their clothes on/ Center, a Tier 1 University Transportation
off and eating/drinking. Center of t he U. S . DOT Un iver sit y
Transportation Centers Program, at Morgan
4. Conclusions State University for their funding support.
T h is st udy i nvest igates t he ef fect of References
si x d i f ferent d istract ions on dr ivers’
behavior using a driving simulator. Some Ahangari, S.; Hasanpour, A.H.; Khadem, N.; Banerjee,
92 participants drove one base scenario S. 2019. Investigating the Impact of Distracted Driving
(without distraction) and six distraction among Different Socio-Demographic Groups. Urban
scenarios; each scenario took about 15 Mobility & Equity Center, Morgan State University,
minutes with different types of distraction Baltimore, 54p.
including no cell phone, hands-free call,
hand-held call, voice commands text, text, Charlton, S. G. 2009. Driving while conversing: Cell
clothing, eating and drinking. The results phones that distract and passengers who react, Accident
showed that participants decreased their Analysis & Prevention 41(1): 160–173.
speed in the presence of all cell phone-related
distractions on all roads. Furthermore, speed Choudhary, P.; Velaga, N. R. 2017. Analysis of vehicle-
reduction was the highest when distracted based lateral performance measures during distracted
by clothing and eating/drinking. The results driving due to phone use, Transportation Research Part F:
suggest a full ban on cell phone usage, not Traffic Psychology and Behaviour 44: 120–133.
just hand-held devices. Also, transportation
safety policymakers may need to regulate Drews, F. A.; Pasupathi, M.; Strayer, D. L. 2004.
clothing and eating/drinking. The highest Passenger and cell-phone conversations in simulated
speed reduction happened on the local road driving, Proceedings of the Human Factors and Ergonomics
when clothing (50%), voice command texting Society Annual Meeting 48: 2210–2212.
(33%), and texting (29%). In general, speed
reduction was the highest on the local road Drews, F. A.; Yazdani, H.; Godfrey, C. N.; Cooper, J. M.;
probably because of high cognitive load Strayer, D. L. 2009. Text messaging during simulated
(stop signs and traffic lights, pedestrians driving, Human Factors 51(5): 762–770.
and cyclists). The high-speed reduction on
the rural road was partly because of driving Gliklich, E.; Guo, R.; Bergmark, R. W. 2016. Texting
way over the speed limit due to low traffic while driving: A study of 1211 US adults with the
and very few intersections. This could Distracted Driving Survey, Preventive Medicine Reports
lead to crashes when high-speed vehicles 4: 486–489.
approach the distracted low-speed vehicle, or
an animal or a pedestrian cross those roads. He, J.; Chaparro, A.; Nguyen, B.; Burge, R. J.; Crandall,
J.; Chaparro, B.; Ni, R.; Cao, S. 2014. Texting while
Acknowledgments driving: Is speech-based text entry less risky than
T he aut hors wou ld l i ke to t han k t he handheld text entry?, Accident Analysis & Prevention 72:
Maryland Department of Transportation- 287–295.
264Ahangari S. et al. A Comprehensive Analysis of Distracted Driving Using a Driving Simulator
Horberry, T.; Anderson, J.; Regan, M. A.; Triggs, T. Oviedo-Trespalacios, O.; Williamson, A.; King, M.
J.; Brown, J. 2006. Driver distraction: The effects 2019. User preferences and design recommendations for
of concurrent in-vehicle tasks, road environment voluntary smartphone applications to prevent distracted
complexity and age on driving performance, Accident driving, Transportation Research Part F: Traffic Psychology
Analysis & Prevention 38(1): 185–191. and Behaviour 64: 47–57.
Lee, J. D. 2017. Driver Distraction and Inattention: Schlehofer, M. M.; Thompson, S. C.; Ting, S.;
Advances in Research and Countermeasures, CRC Press Ostermann; S.; Nierman, A.; Skenderian, J. 2010.
Vol. 1. Psychological predictors of college students’ cell phone
use while driving, Accident Analysis & Prevention 42(4):
Lee, J. Y.; Lee, J. D.; Bärgman, J.; Lee, J.; Reimer, B. 2018. 1107–1112.
How safe is tuning a radio?: Using the radio tuning task
as a benchmark for distracted driving, Accident Analysis Stavrinos, D.; Jones, J. L.; Garner, A. A.; Griffin, R.;
& Prevention 110: 29–37. Franklin, C. A.; Ball, D.; Welburn, S. C.; Ball, K. K.;
Sisiopiku, V. P.; Fine, P. R. 2013. Impact of distracted
Lipovac, K.; Djerić, M.; Tešić, M.; Andrić, Z.; Marić, B. driving on safety and traffic flow, Accident Analysis &
2017. Mobile phone use while driving-literary review, Prevention 61: 63-70.
Transportation Research Part F: Traffic Psychology and
Behaviour 47: 132–142. Stutts, J. C.; Reinfurt, D. W.; Rodgman, E. A. 2001.
The role of driver distraction in crashes: An analysis of
Liu, C.; Lu, C.; Wang, S.; Sharma, A.; Shaw, J. 2019. A 1995-1999 Crashworthiness Data System Data. In Annual
longitudinal analysis of the effectiveness of California’s Proceedings. Association for the Advancement of Automotive
ban on cellphone use while driving, Transportation Medicine, 45: 287–301.
Research Part A: Policy and Practice 124: 456–467.
Thomas, S.; Zuckman, J.; Beck, D. 2012. AT&T teen
Neale, V. L.; Dingus, T. A.; Klauer, S. G.; Sudweeks, J.; driver survey. Available from internet: .
Administration, 05-0400: 1-10
Törnros, J. E.; Bolling, A. K. 2005. Mobile phone
NHTSA. 2015. National Survey on Distracted Driving use—Effects of handheld and handsfree phones on
Attitudes and Behaviors, Behavioral Safety Research. driving performance, Accident Analysis & Prevention 37(5):
Available from Internet: .
Overton, T. L.; Rives, T. E.; Hecht, C.; Shafi, S.; Gandhi,
R. R. 2015. Distracted driving: Prevalence, problems,
and prevention, International Journal of Injury Control and
Safety Promotion 22(3): 187–192.
265You can also read